Key stats
About TRON
Tron is one of the largest stablecoin settlement blockchains in crypto. The Tron blockchain is a delegated proof of stake, layer 1, smart contract solution that allows for decentralized applications to be built on it. These applications center around decentralized finance, NFTs and Web3. It's unique in that it utilizes an energy and bandwidth system, instead of gas, to make Tron blockchain transactions essentially free for large users.
No news here
Looks like there's nothing to report right now

TRX/USD – Support Retest Underway🟢 LONG above $0.3398 – bounce targeting $0.3440+
TRX remains in a steady uptrend above the 200 SMA. After a recent pullback to support, price is consolidating with RSI near neutral. Holding $0.3398 could ignite a push toward the $0.3440–$0.3460 zone.
📊 Keywords: #TRXUSD #TrendSupport #CryptoBounce


Classic Liquidity Trap on TRX -TRXUSDT-4HPrice hunted buy-side liquidity with a sharp fakeout move, trapping breakout traders.
After breaking structure (BOS) and forming internal liquidity, the short setup was confirmed.
Entry placed on the mitigation of the order block with clear risk defined above the fakeout.
Targeting sell-side liquidi

TRX 1D – SR Flips and Trendline Support Hold StrongTRX continues to respect trend structure — clean support retests, ascending trendline intact, and back-to-back SR flips fueling continuation.
With another higher low forming off the recent flip zone, bulls may be eyeing a move into the $0.35+ range. But watch closely — if price breaks below $0.30,

TRX/USD – Knocking on Resistance🟢 LONG above $0.3418 – breakout target $0.3450+
TRX is riding above the 200 SMA with RSI holding at 55, showing steady bullish momentum. Price is consolidating just under $0.3418 resistance — a break here could trigger continuation toward $0.3450–$0.3470.
📊 Keywords: #TRXUSD #BreakoutSetup #Crypto

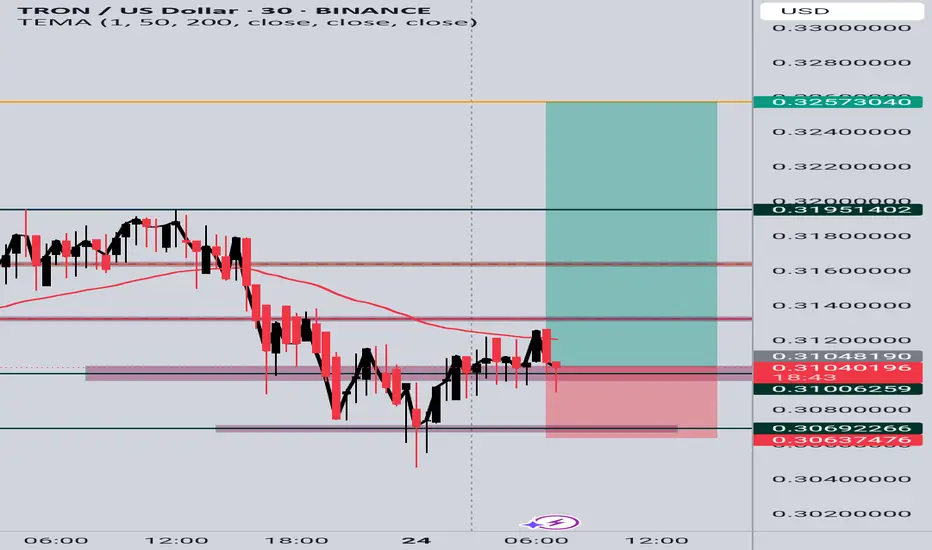
TRX/USD Long Setup (30m Chart)TRX/USD Long Setup (30m Chart)
Price formed a consolidation base around 0.3100 after a strong drop. I entered long on a potential bullish breakout above the short-term structure, targeting partial profits at key resistance levels:
TP1: 0.3195
TP2: 0.3257
Stop loss is set below recent support near
TRX Grinding Higher – Are These the Next Targets?📈🔥 TRX Grinding Higher – Are These the Next Targets? 🧱🚀
Continuing the Altcoin Series, let’s take a look at TRX (Tron) — quietly grinding higher while the crowd stays distracted elsewhere.
As I’ve said before: I’m preparing to divorce altcoins at the top of this cycle. But until then, I’m a trader


See all ideas
Summarizing what the indicators are suggesting.
Oscillators
Neutral
SellBuy
Strong sellStrong buy
Strong sellSellNeutralBuyStrong buy
Oscillators
Neutral
SellBuy
Strong sellStrong buy
Strong sellSellNeutralBuyStrong buy
Summary
Neutral
SellBuy
Strong sellStrong buy
Strong sellSellNeutralBuyStrong buy
Summary
Neutral
SellBuy
Strong sellStrong buy
Strong sellSellNeutralBuyStrong buy
Summary
Neutral
SellBuy
Strong sellStrong buy
Strong sellSellNeutralBuyStrong buy
Moving Averages
Neutral
SellBuy
Strong sellStrong buy
Strong sellSellNeutralBuyStrong buy
Moving Averages
Neutral
SellBuy
Strong sellStrong buy
Strong sellSellNeutralBuyStrong buy
Displays a symbol's price movements over previous years to identify recurring trends.
Curated watchlists where TRXUSD is featured.

Gen 3 crypto: A new day dawns…
25 No. of Symbols

Smart contracts: Make the smart decision
36 No. of Symbols

Staking Coins: Pick up a stake
18 No. of Symbols

Top altcoins: Choose your alternatives carefully
28 No. of Symbols
See all sparks
Frequently Asked Questions
The current price of TRON (TRX) is 0.34451 USD — it has risen 1.82% in the past 24 hours. Try placing this info into the context by checking out what coins are also gaining and losing at the moment and seeing TRX price chart.
The current market capitalization of TRON (TRX) is 32.50 B USD. To see this number in a context check out our list of crypto coins ranked by their market caps or see crypto market cap charts.
TRON (TRX) trading volume in 24 hours is 956.89 M USD. See how often other coins are traded in this list.
TRON price has risen by 4.81% over the last week, its month performance shows a 14.01% increase, and as for the last year, TRON has increased by 165.88%. See more dynamics on TRX price chart.
Keep track of coins' changes with our Crypto Coins Heatmap.
Keep track of coins' changes with our Crypto Coins Heatmap.
TRON (TRX) reached its highest price on Dec 4, 2024 — it amounted to 0.44948 USD. Find more insights on the TRX price chart.
See the list of crypto gainers and choose what best fits your strategy.
See the list of crypto gainers and choose what best fits your strategy.
TRON (TRX) reached the lowest price of 0.00126 USD on Sep 15, 2017. View more TRON dynamics on the price chart.
See the list of crypto losers to find unexpected opportunities.
See the list of crypto losers to find unexpected opportunities.
The current circulating supply of TRON (TRX) is 94.69 B USD. To get a wider picture you can check out our list of coins with the highest circulating supply, as well as the ones with the lowest number of tokens in circulation.
You can judge how popular TRON (TRX) is and how actively traders buy and sell it by its number of transactions - it's now reached 7.98 M, which is 209.71 M USD.
The safest choice when buying TRX is to go to a well-known crypto exchange. Some of the popular names are Binance, Coinbase, Kraken. But you'll have to find a reliable broker and create an account first. You can trade TRX right from TradingView charts — just choose a broker and connect to your account.
Crypto markets are famous for their volatility, so one should study all the available stats before adding crypto assets to their portfolio. Very often it's technical analysis that comes in handy. We prepared technical ratings for TRON (TRX): today its technical analysis shows the strong buy signal, and according to the 1 week rating TRX shows the buy signal. And you'd better dig deeper and study 1 month rating too — it's strong buy. Find inspiration in TRON trading ideas and keep track of what's moving crypto markets with our crypto news feed.
TRON (TRX) is just as reliable as any other crypto asset — this corner of the world market is highly volatile. Today, for instance, TRON is estimated as 2.27% volatile. The only thing it means is that you must prepare and examine all available information before making a decision. And if you're not sure about TRON, you can find more inspiration in our curated watchlists.
You can discuss TRON (TRX) with other users in our public chats, Minds or in the comments to Ideas.