Euro FX Playbook: Key Levels That Will Decide the Next Leg1. Macro overview
The broader narrative driving the dollar and Euro FX in the past quarter has been centered on shifting Federal Reserve expectations and the market’s evolving outlook on global growth. The dollar has remained firm as traders continue to balance softer inflation prints against persistent uncertainty around the timing and magnitude of future rate adjustments. While inflation has moderated, the market has not fully embraced a clear easing cycle, which has kept the dollar supported during periods of risk aversion.
For Euro FX, this environment has created a backdrop where price action has been more about relative policy expectations and the pace at which each central bank signals a shift. The Euro has struggled to sustain directional conviction because both sides have been sending mixed signals. This has produced choppy two sided auctioning within a broader range. Sellers have shown responsiveness at the upper end of the structure, while buyers have continued to defend well defined pockets of liquidity near the lows. The result has been repeated consolidation blocks forming as neither side fully takes control.
2. What the market has done
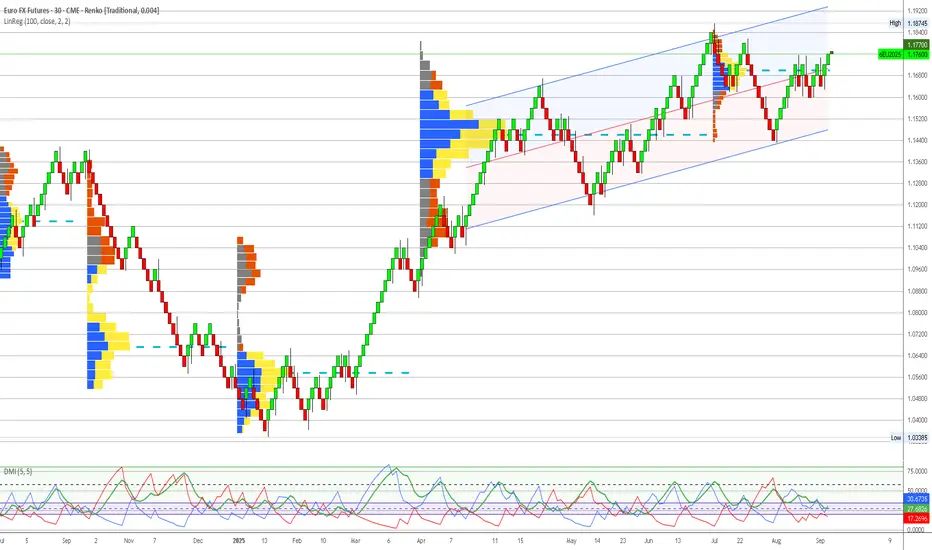
The market was trending lower from September into November while still trading within the larger multi month range between 1.200 (daily resistance) and 1.155 (daily support). Offers consistently stepped down through this period.
Buying liquidity was found again at the 1.155 area. Buyers had previously responded here, initiating the August rally off May’s Bid Block 1 which formed the daily support. This zone once again acted as a key response area. Bids stepped up as the market compressed into late November, and buyers were able to push back through the descending offer sequence.
From there, the market auctioned two way between the 1.174 area (1 December weekly VAH and daily pivot zone 2) and the 1.155 daily support. Buyers stepped up bids in early December and succeeded in bidding prices back above 1.174, showing that buyers were still present and willing to auction the market back up. This move also confirmed that sellers failed to hold the breakdown from the prior 1.5 month consolidation block.
3. What to expect in the coming week
The key level to watch is the 1.182 area (29 September weekly VAH).
Bullish Scenario
• If the market is able to accept above 1.182, it is expected to continue higher toward 1.187 (daily pivot zone 1).
• Sellers are expected to respond here from 1.187.
• If sellers fail to respond, the next upside target becomes 1.1967 (15 September weekly VPOC) and possibly 1.200 (daily resistance).
• A move into these levels would place price near the upper boundary of the larger multi month range.
Neutral Scenario
• If the market is unable to accept above 1.182, or if sellers defend and reject price from 1.187 (daily pivot zone 1), the market is expected to remain rotational.
• The likely rotation range sits between 1.173 (1 December weekly VAH / daily pivot zone 2) and 1.187.
• This should allow the market to establish value higher and form a base for further directional resolution.
Bearish Scenario
• If buyers fail to defend 1.173 (1 December weekly VAH, daily pivot zone 2, and Bid Block 3 range high), the market is expected to push lower to 1.1666 area (17 November VAH).
• If selling continues, price may extend further to 1.1644 (24 November weekly VPOC).
Conclusion
Euro FX remains in a larger range with clearly defined response zones on both sides, and next week’s behavior around 1.182 will set the tone for whether the market rotates higher or slips back into balance.
Let me know what levels you are watching or if you see anything different on your charts. Please give this post a boost so more traders in the community can join the discussion! Thank you.
Disclaimer: This is not financial advice. Trade your own plan and manage your own risk carefully.
6e

Euro Futures (6E) - Technical Analysis Report - 20250908Analysis Date: September 8, 2025
Current Price: 1.1742
Market Session: Post-Market Analysis
---
Executive Summary
Euro Futures presents the strongest technical setup among analyzed markets, with exceptional execution chart alignment despite moderate institutional positioning. The currency pair has emerged from a major bottoming pattern with validated bullish momentum signals across all timeframes. While institutional accumulation is less pronounced than in commodity markets, the technical breakout quality and central bank policy divergence create compelling risk/reward opportunities.
---
Quarterly Volume Profile Analysis
Institutional Positioning Intelligence
The quarterly volume profile (Q3 2025) reveals moderate but strategically positioned institutional activity in the Euro:
Primary Institutional Activity Zone: 1.1550-1.1700
Moderate blue volume concentration representing institutional positioning during major low formation
Current price (1.1742) trades at upper boundary of institutional accumulation zone
Volume profile shows classic bottoming pattern with accumulation at major support levels
Institutional activity concentrated around key technical support levels from previous cycles
Volume Profile Architecture:
Core Accumulation: 1.1580-1.1650 (primary institutional positioning)
Extended Support: 1.1450-1.1550 (secondary institutional interest)
Breakout Level: 1.1700-1.1750 (current resistance/breakout zone)
Void Zone: Above 1.1800 (minimal resistance, potential acceleration territory)
Resistance Structure Analysis:
1.1750-1.1800: Initial resistance with mixed volume activity
1.1850-1.1900: Moderate yellow volume indicating previous distribution
1.1950+: Historical distribution zones from earlier 2025 highs
Price Structure Context
Historical Pattern Recognition:
The current Euro setup displays textbook currency reversal characteristics following a major multi-month decline. The institutional accumulation at 1.1550-1.1700 represents strategic positioning by smart money during the formation of a significant low, typical of major currency cycle turning points.
Critical Structure Validation:
Institutional Floor: 1.1450 represents absolute lower boundary of smart money positioning
Volume Point of Control: 1.1620 shows peak institutional activity within accumulation zone
Breakout Validation: Current price above institutional accumulation confirms technical breakout
Risk Definition: Clear institutional boundaries provide precise risk management parameters
Central Bank Policy Context
Policy Divergence Supporting Euro Strength:
European Central Bank maintaining restrictive policy stance
Federal Reserve approaching policy pivot with potential dovish shift
Interest rate differential dynamics favoring Euro in medium term
Quantitative tightening policies supporting European currency fundamentals
---
Execution Chart Technical Analysis
Current Technical Configuration - EXCEPTIONAL BULLISH ALIGNMENT
DEMA Analysis - STRONGEST BULLISH SIGNAL IN ANALYZED MARKETS:
Black Line (Fast DEMA 12): Currently at 1.1742
Orange Line (Slow DEMA 20): Currently at 1.1712
Configuration: Perfect bullish crossover with expanding gap
Trend Bias: Strongest technical momentum across all analyzed markets
DMI/ADX Assessment - CONFIRMED TRENDING CONDITIONS:
ADX Level: 35+ indicating strong directional movement
+DI vs -DI: +DI clearly dominant over -DI with expanding spread
Momentum Direction: Confirming sustained bullish bias with conviction
Trend Strength: ADX rising confirms institutional and technical alignment
Stochastic Analysis - HEALTHY MOMENTUM STRUCTURE:
Tactical Stochastic (5,3,3): Bullish configuration with room for extension
Strategic Stochastic (50,3,3): Confirming longer-term bullish momentum shift
Divergence Analysis: No negative divergences, clean momentum structure throughout
Support and Resistance Levels
Immediate Technical Levels:
Current Support: 1.1710 (DEMA 20 orange line)
Key Support: 1.1680 (recent breakout consolidation)
Major Support: 1.1620 (institutional accumulation core)
Immediate Resistance: 1.1780 (near-term extension target)
Key Resistance: 1.1820 (major resistance zone)
Major Resistance: 1.1900 (significant distribution zone)
---
Trading Scenarios and Setup Criteria
Scenario 1: Continuation Long Setup (PRIMARY)
Optimal Conditions for Long Entry:
DEMA bullish maintenance: Black line remaining above orange line with gap expansion
DMI confirmation: +DI sustaining dominance over -DI with strengthening ADX
Breakout validation: Price holding above 1.1700 breakout level
Volume confirmation: Increased volume supporting upward momentum
Policy support: Central bank divergence maintaining fundamental backdrop
Entry Protocol:
Primary Entry: Current levels 1.1740-1.1760 (validated breakout zone)
Secondary Entry: 1.1710-1.1720 on any pullback to DEMA support
Position Sizing: Aggressive 2.5% account risk given exceptional technical setup
Stop Loss: Below 1.1680 (breakout failure)
Profit Targets:
Target 1: 1.1820 (first major resistance) - Take 40% profits
Target 2: 1.1900 (distribution zone approach) - Take 30% profits
Target 3: 1.1980-1.2000 (major resistance complex) - Trail remaining 30%
Scenario 2: Pullback Accumulation Setup (SECONDARY)
Conditions for Pullback Entry:
Price retracement to 1.1700-1.1720 breakout support zone
DEMA holding bullish configuration during pullback
Stochastic oversold providing tactical entry signal
Volume profile respect at breakout support levels
Pullback Setup Parameters:
Entry Range: 1.1700-1.1720 (breakout support zone)
Stop Loss: Below 1.1680 (breakout invalidation)
Targets: Same as primary scenario with enhanced risk/reward
Position Sizing: Maximum allocation given superior entry point
Scenario 3: Acceleration Breakout Setup (AGGRESSIVE)
Breakout Trading Framework:
Acceleration Level: Above 1.1800 (void zone entry)
Volume Confirmation: Significant volume expansion supporting breakout
Technical Validation: DEMA gap expansion with ADX above 40
Momentum Persistence: +DI expanding dominance over -DI
Acceleration Parameters:
Entry: 1.1805-1.1820 on confirmed acceleration
Stop: Below 1.1750 (failed acceleration)
Extended Targets: 1.1950, 1.2000, 1.2050+
Position Management: Trail stops using 0.004 structure levels
---
Risk Management Protocols
Position Sizing Guidelines
Aggressive Approach (Recommended for 6E):
Maximum Risk: 2.5% of account (increased allocation due to exceptional technical quality)
Contract Calculation: Account Size × 0.025 ÷ (Stop Distance × $12.50 per pip)
Example: $100,000 account with 60-pip stop = 33 contracts maximum
Rationale: Strongest technical setup justifies aggressive allocation
Stop Loss Hierarchy
Tactical Stop: 1.1710 (DEMA support)
Strategic Stop: 1.1680 (breakout support)
Emergency Stop: 1.1650 (institutional accumulation boundary)
Profit Management Framework
Systematic Profit Taking:
First Target (40%): Lock in profits at initial resistance zone
Second Target (30%): Capture extended move through distribution areas
Final Position (30%): Trail for potential acceleration beyond 1.2000
Trail Stop Method: Use 0.004 structure chart levels once in profit
---
Market Context and External Factors
Fundamental Catalysts Supporting Euro Strength
Central Bank Policy Dynamics:
ECB maintaining restrictive stance longer than Fed
Interest rate differential shifting in favor of Euro
Quantitative tightening supporting currency fundamentals
Inflation dynamics favoring European monetary policy
Economic Factors:
European energy security improvements reducing volatility
Manufacturing sector stabilization supporting economic outlook
Current account dynamics favoring Euro strength
Political stability improving investor confidence
Technical Market Structure
Currency Market Positioning:
Speculative positioning showing Euro oversold conditions reversing
Commercial hedger activity supporting Euro strength
Cross-currency relationships confirming Dollar weakness
Volatility patterns suggesting sustained directional move
---
Monitoring Checklist and Alert Levels
Daily Monitoring Requirements
DEMA Configuration: Maintain bullish black above orange relationship
Breakout Respect: Confirm price behavior above 1.1700 breakout level
Volume Analysis: Monitor for volume expansion on upward moves
Central Bank Events: ECB and Fed policy statements, economic data releases
Dollar Correlation: Monitor relationship with DXY and other major currency pairs
Critical Alert Levels
Bullish Escalation Alerts:
Break above 1.1800 with volume expansion
DEMA gap expansion beyond 30 pips
+DI moving above 40 with ADX persistence above 40
ECB hawkish policy statements supporting fundamental backdrop
Risk Management Alerts:
DEMA bearish crossover (black below orange)
Break below 1.1700 breakout support level
ADX declining below 25 indicating momentum loss
Fed policy pivot announcements affecting interest rate differential
---
Strategic Outlook and Conviction Assessment
Risk/Reward Analysis
Exceptional Setup Characteristics:
Risk: 60 pips to breakout support (1.1680)
Reward: 150+ pips to first major resistance (1.1900+)
Risk/Reward Ratio: 2.5:1 minimum, potential 4:1+
Probability Assessment: High (80%+) based on technical breakout quality
Portfolio Allocation Recommendation
Maximum Technical Conviction Positioning
Euro Futures represents the highest quality technical setup in the current market environment. The exceptional alignment of DEMA crossover, DMI momentum, and validated breakout above institutional accumulation creates optimal conditions for aggressive positioning. While institutional accumulation is less pronounced than in commodities, the technical execution quality and central bank policy support justify maximum allocation within risk parameters.
Allocation Framework:
Primary Portfolio Weight: 20-25% (maximum technical conviction)
Entry Method: Immediate positioning with scale-in capability on pullbacks
Hold Period: Expect 3-8 week position duration
Exit Strategy: Systematic profit-taking at technical resistance levels
---
Conclusion and Strategic Assessment
Euro Futures presents the strongest technical setup among all analyzed markets, with exceptional DEMA crossover quality and validated breakout above institutional accumulation. While the institutional positioning is less dramatic than commodity accumulation patterns, the technical execution signals are pristine and supported by favorable central bank policy dynamics. Current positioning above breakout support offers superior risk/reward characteristics with clearly defined parameters for both profit-taking and risk management.
Implementation Priority: Immediate aggressive positioning recommended - this technical setup quality represents the gold standard for momentum-based entries with institutional validation.
Next Review: Daily monitoring of DEMA configuration and breakout level respect
Position Management: Systematic profit-taking protocol with trailing stops at technical levels
---
Important Disclaimer
Risk Warning and Educational Purpose Statement
This analysis is provided for educational and informational purposes only and does not constitute financial advice, investment recommendations, or trading signals. All trading and investment decisions are solely the responsibility of the individual trader or investor.
Key Risk Considerations:
Futures trading involves substantial risk of loss and is not suitable for all investors
Past performance does not guarantee future results
Market conditions can change rapidly, invalidating any analysis
Leverage can amplify both profits and losses significantly
Individual financial circumstances and risk tolerance vary greatly
Professional Guidance: Before making any trading decisions, consult with qualified financial advisors, conduct your own research, and ensure you fully understand the risks involved. Only trade with capital you can afford to lose.
Methodology Limitations: Volume profile analysis and technical indicators are tools for market assessment but are not infallible predictors of future price movement. Market dynamics include numerous variables that cannot be fully captured in any single analytical framework.
The views and analysis presented represent one interpretation of market data and should be considered alongside other forms of analysis and individual judgment.
Euro Futures (6E) – Bearish Drift Below ResistanceEuro Futures (6E) appears to be grinding lower showing clear signs of fading bullish momentum.
After a bounce off 1.16160 support on July 17, Euro Futures (6E) made a failed push into 1.17995 resistance on Tuesday, July 22, a level that’s acted as a firm ceiling since June 26.
Since then, price action has been in a descending broadening channel, often a precursor to further downside with expanding volatility as sellers control the tempo.
As of 5:20 AM GMT, the structure points to continued weakness. I expect 6E to settle around 1.17170 – 1.16990 by close of Wednesday, July 23, 2025.
📉 Bias: Bearish
🔍 Pattern: Broadening Descending Channel
🕒 Date: July 23, 2025

Opportunities Arise from Dollar WeaknessSince the dollar peaked in 2022, it has declined by 24%.
Such a decline may not seem significant for a stock, it’s a different story when it comes to currencies, especially a reserve currency for USD. US purchasing power has dropped by a quarter, meaning they will now have to pay 24% more for imports from EU.
However, the decline in the USD also presents opportunities in other markets.
Mirco EUR/USD Futures
Ticker: M6E
Minimum fluctuation:
0.0001 per euro = $1.25
Disclaimer:
• What presented here is not a recommendation, please consult your licensed broker.
• Our mission is to create lateral thinking skills for every investor and trader, knowing when to take a calculated risk with market uncertainty and a bolder risk when opportunity arises.
CME Real-time Market Data help identify trading set-ups in real-time and express my market views. If you have futures in your trading portfolio, you can check out on CME Group data plans available that suit your trading needs www.tradingview.com

Dollar Decline Against All Major CurrenciesThe Dollar’s decline didn’t start with the recent ‘Liberation Day’ tariffs. In fact, it has been gradually weakening since the 1970s.
More recently, however, the Dollar has lost value against many currencies since January. Why is that?
Why have the USD/CHF and USD/SGD strengthened against the US Dollar over the past few decades? One reason is that both countries have managed their money supply with discipline. For example, as of end-2024, Switzerland’s net federal debt stood at 141 billion Swiss franc, their debt to GDP ratio at 17.2%.
In contrast, the United States has expanded its national debt at an alarming rate. Some might point out that Japan’s debt-to-GDP ratio is even higher—around 230%. That is why the Japanese Yen has also been in decline for decades.
Why does printing more money through QE and increasing the money supply weaken a currency?
Just imagine in a close economy with 10 people and 1 central bank. If the central bank printed $100 and distributed equally to the 10, each of them will receive $10 to buy 10 available cheesecakes.
But now the central bank decided to print $1,000 and each person will have $100 to buy 10 available cheesecakes.
The global economy is not a close, but an open system.
When the US and other major economies printed massive amounts of money, they didn’t just inflate their own economies—they exported inflation worldwide. This contributes to rising cost of living not all around the world.
In my view, Gold is also a currency pair against the US at the start of 1971. The moment dollar unpeg itself from gold, gold appreciates. With each QE, we can see how the currencies have diluted with gold and inflation appreciating over these years.
Why different currencies have started to appreciate against the USD since January this year?
We can see all the currencies have either reached its bottomed in January and started moving higher or it formed a reversal pattern like the Aussie dollar and the Dollar Yuan, in this case with this inverted hammer, it is indicating Dollar Yuan to reverse downward, meaning dollar coming off and yuan to appreciate.
January was President Trump inauguration and February was when he rolled out tariffs against Canada, Mexico and China, and the market do not like that and has been selling the USD against the rest of the currencies?
If US has printed the so much money, but why other than Swiss franc and Singapore Dollar, many other currencies have been depreciating against dollars over the past decades?
I’d like to hear your thoughts on this.
Euro FX Futures & Options
Ticker: 6E
Minimum fluctuation:
0.000050 per Euro increment = $6.25
Disclaimer:
• What presented here is not a recommendation, please consult your licensed broker.
• Our mission is to create lateral thinking skills for every investor and trader, knowing when to take a calculated risk with market uncertainty and a bolder risk when opportunity arises.
CME Real-time Market Data help identify trading set-ups in real-time and express my market views. If you have futures in your trading portfolio, you can check out on CME Group data plans available that suit your trading needs www.tradingview.com
Trading the Micro: www.cmegroup.com

Why Has the USD Been Falling?Dollar has lost value against many currencies since January. Why is that?
The Dollar’s decline didn’t start with the recent ‘Liberation Day’ tariffs. In fact, it has been gradually weakening since the 1970s.
U.S. Treasury Futures & Options
Ticker: 6E
Minimum fluctuation:
0.000050 per Euro increment = $6.25
Disclaimer:
• What presented here is not a recommendation, please consult your licensed broker.
• Our mission is to create lateral thinking skills for every investor and trader, knowing when to take a calculated risk with market uncertainty and a bolder risk when opportunity arises.
CME Real-time Market Data help identify trading set-ups in real-time and express my market views. If you have futures in your trading portfolio, you can check out on CME Group data plans available that suit your trading needs www.tradingview.com
Trading the Micro: www.cmegroup.com

Take the Red Pill: The EURO COT Long Play RevealedTake the Red Pill: The EURO Long Play Revealed
"Let me tell you why you're here. You're here because you know something. What you know, you can't explain, but you feel it." – Morpheus
Most traders move blindly through the markets, buying and selling on impulse, on what they think they know. But for those who understand how to read deeper signals, patterns begin to emerge—patterns that separate the merely active from the truly informed. Right now, if you're willing to look, Commitment of Traders (COT) data is showing us something intriguing about the EURO. This is your red pill: a glimpse into how those in the know see beyond the chart.
The Setup: A Commercial Long Play
Behind the scenes, commercials—the ones who have true skin in the game—have loaded up on longs, reaching a 26-week extreme in positioning. Not only that, but they're holding their longest exposure in three years, a sign that those with the best intel in the market believe in a coming shift. Meanwhile, the "small specs," often driven by emotion rather than insight, have gone nearly max-short. Historically, this group isn't just wrong; they’re almost predictably wrong.
The result? A textbook setup. But if you’re looking to take advantage, know this: jumping in without discipline is how people get burned. We wait for a confirmed trend change on the daily timeframe. Nothing less. Because only the disciplined get to see beyond the shadows and reap the rewards.
The Undervaluation: Gold, Treasuries, and the EURO’s True Position
If you look at the EURO in comparison to gold and treasuries, something stands out—it’s undervalued. This doesn’t show up in headlines or make for easy soundbites, but for those who know how to look, it’s a flashing signal. And there’s a seasonal edge, too: the EURO’s tendency to rally through mid-December. It’s another puzzle piece that, when added up with positioning extremes and market sentiment, paints a picture that only a few will truly grasp.
Supplementary Signals: Layers of Confirmation
For those still seeking confirmation, additional indicators are lining up: %R, Stochastic, and even bullish momentum divergence are signaling alignment. But understand this—the market doesn’t reward the impatient. We wait, observe, and move only when the trend change is confirmed on the daily chart.
The Truth Beneath the Surface
This is no ordinary trade idea. It’s a blueprint to help you see the hidden dynamics that move the market. Those who look only at surface price action may be blindsided by the moves yet to come. But for those willing to see beyond—those ready to know what the COT data, the fundamentals, and the seasonal tendencies are saying—this is a rare opportunity.
Now, if you’re ready to see what the rest don’t, follow Tradius Trades. You’ll be one of the few with eyes open, equipped to move with purpose.
---
> "I didn’t say it would be easy, Neo. I just said it would be the truth."

EURUSD 6E SHORTPrice strongly respecting premium bearish array on daily.
Strong bearish displacement on H1.
I'm looking for new short entry opportunities via respect of h1 bearish premium arrays, to then hunt m5 bearish displacement entries.

EURUSD 6E LongToday EU had a fairly strong daily close. Also, DXY rejected from some key daily levels.
My Daily DOL is Monday's high.
We also saw SMT divergence at the lows (EU failing to make lower lows while DXY made higher highs).
I want to see the H1 discount bullish arrays respected, to then look for a bullish displacement entry trigger on M5/M15.

EURUSD 6E Long-Price failed to close below 50% of the Daily RDRB price range.
-Price failed to close below Tuesdays low, as well as failing to close below several other previous daily lows.
-Daily DOL is Wednesdays high.
-I need to see H4/H1 discount arrays being respected to then look for bullish displacement entry triggers on M15/M5

EURUSD Short IdeaPrice has rejected multiple times on the daily chart from the 50% level of the bearish orderblock @ 1.08635 . Price also failed to displace and close above Mondays high.
My Draw on Liquidity (DOL) is Tuesday's low, and am hunting a short setup.
I want to see H1 candles closing with rejection wicks in the H1 bearish FVG areas ( 1.08565 to 1.08580) as well as 50% of the H1 bearish orderblock (1.08605).
H1 candle closing rejecting this area, and I'd look for entry on M5.
Let me know your thoughts on this trade idea, and what you are looking for on EUR.

EURUSD Bullish ExpectationThis expectation is a framework to look for a potential trading setup; I don't just execute based on these levels, I always wait for confirmations on lower timeframes
This Analysis was done using my complete Strategy which includes:
- Smart Money Concepts
- Multi Timeframe Liquidity and Market Structure
- Supply And Demand
- Auction Theory
- Volume Analysis
- Footprint
- Market Profile
- Volume Profile
- WYCKOFF
- ETC

EURUSD Short-Term Bearish ExpectationThis expectation is a framework to look for a potential trading setup; I don't just execute based on these levels, I always wait for confirmations on lower timeframes
This Analysis was done using my complete Strategy which includes:
- Smart Money Concepts
- Multi Timeframe Liquidity and Market Structure
- Supply And Demand
- Auction Theory
- Volume Analysis
- Footprint
- Market Profile
- Volume Profile
- WYCKOFF
- ETC

EURUSD Bullish ExpectationThis expectation is a framework to look for a potential trading setup; I don't just execute based on these levels, I always wait for confirmations on lower timeframes
This Analysis was done using my complete Strategy which includes:
- Smart Money Concepts
- Multi Timeframe Liquidity and Market Structure
- Supply And Demand
- Auction Theory
- Volume Analysis
- Footprint
- Market Profile
- Volume Profile
- WYCKOFF
- ETC

EURUSD 6E - Bears to Dominate next week?📉Bearish Bias Next Week 📉
🔴Weekly IRL Tagged
🔴Strong H4 Bearish PA after Weekly IRL Tag
🔴Looking to short towards Weekly ERL
🎯Target: 4235.5

EURUSD 6EF Short Trade Idea 6EZ2023 - EURUSD - SHORT
6E / EURUSD just had a strong bearish reaction on the H4 timeframe to the area of sensitivity (weekly fair value gap FVG).
On a pullback into a H4 premium, I will be hunting short triggers on M15 timeframe to then target the PWL (previous weekly low).
This correlates nicely with DXY, which just had the same reaction to a weekly FVG. There is a nice weekly fractal high within the weekly fair value gap on DXY which should act as the next DOL. 6EZ2023 doesn't have a fractal high to act as a draw, so I will be watching DXY to determine when to exit the short.

Wizard731, Anticipation of 6EThe market 6E is attempting, after the correction, to resume the upward trend and reach a higher level than the previous one.

Euro Futures 6E1 Finding Support?Looking a 4 hr line chart at some reoccuring retrace levels and time cycles we can see price is reaching the 70% retrace level of our last major uptrend. The question is will it be "retrace" and bounce or break the low of the last major swing signaling a reversal of the longer running macro uptrend.
Looking at the log chart we can see the rate at which price is dropping is slowing signaling we may be finding support at a 70% retrace of the last swing.
IF we are finding support a reasonable expecation would be to form a range of accumulation before seeing a push to up side.
The current chart is pointing out squares of time and price from the down trend giving high probability price levels and time cycles of future trend.
First major point of resistance is the 1.96 zone where we have the .236 retrace level of the entire down trend IF it is has bottomed, the 50% retrace level from the last high of the downtrend, the 45 degree mark from squaring the last down trend, and the 200 EMA on the 4hr.
Just looking at the chart this zone could be an accumulation zone for a continuation of macro uptrend or if we are seeing a macro reversal it could also be seen as point of rejection and continuation of our current down trend.
Current trading plan is to trade the current range from this hopeful low to local resistance.
IF it brakes to the upside next local target would be the swing golden pocket.
IF it brakes to the down side there is a small gap to fill down to the 1.081 area.
Trade Well......

EURUSD Bullish Trade IdeaThis expectation is a framework to look for a potential trading setup; I don't just execute based on these levels, I always wait for confirmations on lower timeframes
This Analysis was done using my complete Strategy which includes:
- Smart Money Concepts
- Multi Timeframe Liquidity and Market Structure
- Supply And Demand
- Auction Theory
- Volume Analysis
- Footprint
- Market Profile
- Volume Profile
- WYCKOFF
- ETC

EURUSD Bearish Short-Term Trade IdeaThis expectation is a framework to look for a potential trading setup; I don't just execute based on these levels, I always wait for confirmations on lower timeframes
This Analysis was done using my complete Strategy which includes:
- Smart Money Concepts
- Multi Timeframe Liquidity and Market Structure
- Supply And Demand
- Auction Theory
- Volume Analysis
- Footprint
- Market Profile
- Volume Profile
- WYCKOFF
- ETC

Look at the futures market open post NFP Miss. A short look across major futures markets after we have an NFP Miss

EURUSD Bearish Trade IdeaThis expectation is a framework to look for a potential trading setup; I don't just execute based on these levels, I always wait for confirmations on lower timeframes
This Analysis was done using my complete Strategy which includes:
- Smart Money Concepts
- Multi Timeframe Liquidity and Market Structure
- Supply And Demand
- Auction Theory
- Volume Analysis
- Footprint
- Market Profile
- Volume Profile
- WYCKOFF
- ETC

6E - 14/7 Analyzeas you see we have strong resistance at current price due to the 4 month range
manipulation is high (volume in the image)
if it break this zone next target 1.2, otherwise 1
