GBPCAD breakout or rejection? All eyes on 1.8850!GBPCAD is testing a major technical zone as macro and price catalysts align. Here's what traders need to know:
Catalysts & Macro Drivers
GBP : Supported by USD weakness (US shutdown, weak data), sticky UK inflation, and Bank of England caution. November’s UK budget looms as a key event.
CAD : Under pressure from falling oil prices (oversupply/weak demand) and a dovish Bank of Canada. Further rate cuts are possible, especially if oil stays low.
Technical Outlook
Weekly chart : Strong impulsive rally past 61.8% Fibonacci (1.8310), with 1.9490 (78.6% Fib) as the next longer-term upside target.
4h chart : Ascending triangle with resistance at 1.8850. Breakout/close above 1.8850 confirms bullish momentum, with targets at 1.90 and then 1.93–1.95.
RSI : Long-term RSI above 60 signals strength, but divergence is a risk factor. Watch for RSI reset or failure at highs.
Trading Scenarios
Bullish : Hold above 1.8850 for 3 sessions +, look for upside extension to 1.90/1.93/1.95.
Bearish : Failure to break 1.8850 or drop below 1.8600 could trigger reversal to 1.84/1.81 support.
Levels to Watch
Key resistance: 1.8850, 1.9000, 1.9340, 1.9490
Key support: 1.8600, 1.8400, 1.8310
This content is not directed to residents of the EU or UK. Any opinions, news, research, analyses, prices or other information contained on this website is provided as general market commentary and does not constitute investment advice. ThinkMarkets will not accept liability for any loss or damage including, without limitation, to any loss of profit which may arise directly or indirectly from use of or reliance on such information.
786fib

$BTC to Retest .786 Fib Next ~$102k - BTFD!timberrrrr
the crypto gods shall giveth one last chance.
buy the fckn dip!!!

BTCUSDT Diamond Gartley T BarPrice action:
T Bar reversal on 1H chart
Extreme bearish
Trend:
Exiting from Diamond
88.6% FIB rejection
Gartley AB=CD .786 - 1.272 optional TP
14.6% key level Fibonacci retracement @ 17K final TP
Patterns:
Descending broadening structure
Triangle
Rising wedge
Diamond

Next possible short on Nifty, MAYBE?Most 786+ POC confluence gives out great possibilities for an entry, one such entry is around the corner.
Why bear?
we are forming lower high on high time frame, gives me a reason this will continue as we have lower levels to visit especially the 618 fib fan.
Here we can see most of the fib fan working, even on the 2008 crash we found support at 618.
This analysis is to be taken as a form of hedge, I'm not saying this will work but in the technical analysis world we are at resistance, its time to enter short (under the correct conditions).
How to enter?
This is my expectations (in an ideal situation) take out the support and flip bearish.

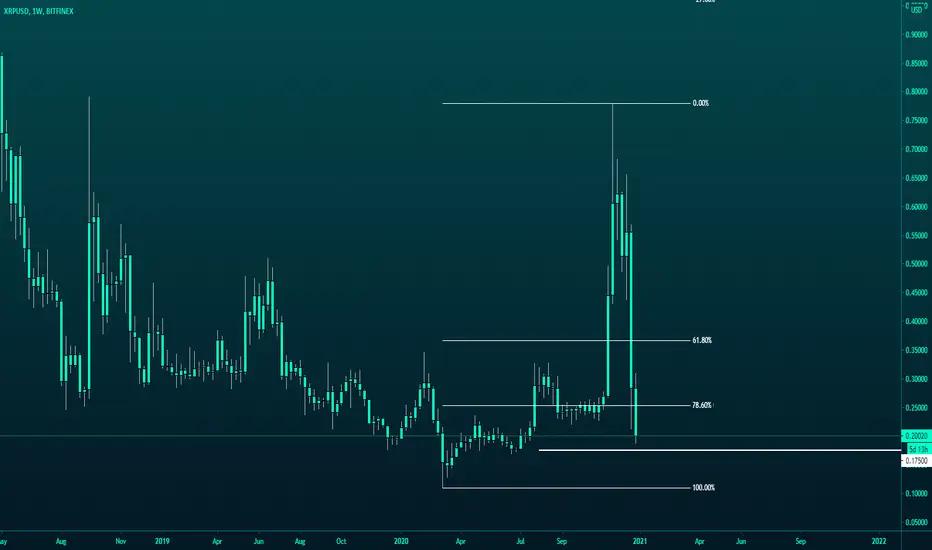
weekly fibs say....Bitcoin is out of steam
weekly fibs show we are at a perfect level to turn around.
All time high to 3k swing low fib we just hit the .786
3k swing low to 14k swing high is almost at the 1.272 ($16,741)

Bitcoin out of steam at least for now weekly fibs show we are at a perfect level to turn around.
All time high to 3k swing low fib we just hit the .786
3k swing low to 14k swing high is almost at the 1.272 ($16,741)

Trendline Break Setup (Paper trade)*Not trading advice, entertainment purposes only, DYOR
Reasons for a trade:
1.) Putting in market structure at or below
78.6, off fibs from 3 most recent highs.
2.) Has W and working on confirmation of larger W
3.) Moving Average Convergence
4.) Put in market structure after break of 2
significant downward sloping trendlines
5.) Divergence in MACD
6.) Market structure and cross on the Willy coming out of oversold
7.) Market Structure on OBV w/MA cross
8.) Bears falling asleep
9.) Beautiful candle body that closed above VP POC
10.) 2:1 RR just above gap at top of most recent range
11.) 6.1:1 RR by a return and touch to 200MA.
12.) 10.2:1 RR by returning to Gann 50%
13.) Near Original breakout out levels from 1992, sheesh
Enter trade at check of top of double bottom $6.30
Set stop just below double bottom at $6.01
Sell 1/2 my position at 2:1 ($6.88) and move remaining to scratch.
use 3 highs/Lows method on remaining if PA continues to put in bullish market structure.
NYSE:GE

EURUSD Weekly AnalysisOn the monthly/weekly we can have a 50% retracement up to 1.1875.
On the daily, we are expecting to test the upper bound of the downward sloping channel since the beginning of 2019.
Downward sloping channel upper bound: 1.1393
.786 Fib from early March swing: 1.1366
Potential TP: 1.1265
Since the ECB on 20190307, we haven't retraced 50% of this 7 day crawl up. 100pips potential.
My BIG REGRET this time was selling the tranche that I got at 1.1180 very very very early at 1.1200, thinking that I could pick it up again right away, but it left me behind on this slow crawl up. Could have at least held it to 1.1280 mid channel.
Lots of data this coming week that may be the catalyst.
GMT+8
20190321 2am US FOMC Meeting Announcement, then EU leader's summit for the whole day.
20190321 830pm US Jobless Claims
20190322 5pm EZ: PMI Flash
20190322 10pm US Home Sales
