Gold Lacks a Healthy CorrectionGold has been trending steadily within an ascending channel, with buyers keeping control and driving price higher and higher.
And recently price broke above the channel, but it lacked conviction and price is falling back inside the channel.
This might signal buyer exhaustion and a potential shift in momentum. If sellers take over decisively, price could retrace back toward the middle or lower boundary of the channel for a healthy correction.
Community ideas
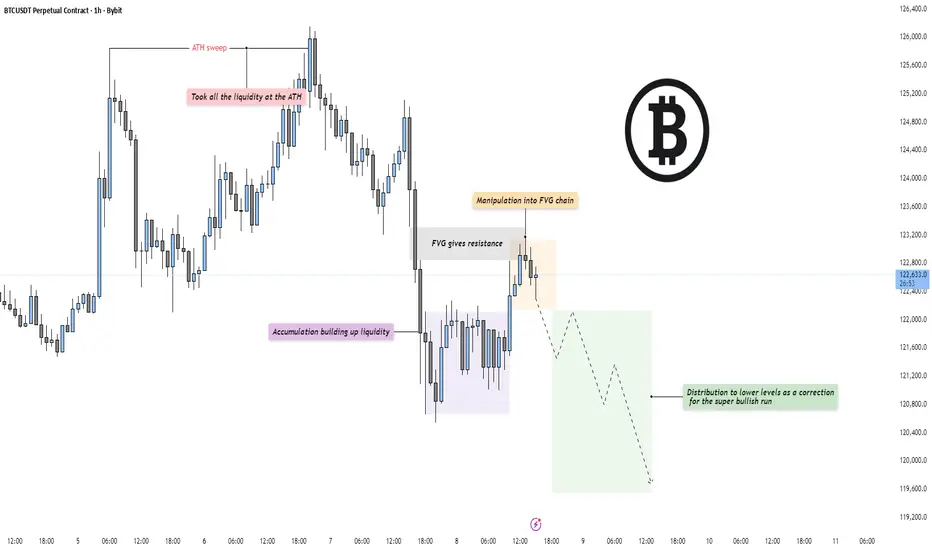
BTC - Distribution after ATH sweepMarket Context
Bitcoin has completed a clear liquidity sweep at the all-time high (ATH) and is now transitioning into a corrective phase. After taking all the liquidity above the prior high, price aggressively rejected and shifted structure to the downside, signaling that smart money may now be engineering a retracement. The move lower has found a temporary pause within a lower accumulation zone where liquidity is rebuilding.
Fair Value Gaps & Manipulation
Following the ATH sweep, price manipulated back into a fair value gap (FVG) chain, where it met resistance. This area acted as a precise reaction point, rejecting further bullish attempts and confirming the FVG as an active supply zone. Each touch into this chain has resulted in lower highs, supporting the idea that distribution is underway. The fair value gaps below are likely to be targeted next as price seeks efficiency.
Liquidity Dynamics
Liquidity above has already been collected — the current draw now lies beneath. The accumulation zone below current price holds resting sell-side liquidity, and the market could aim to fill those inefficiencies before finding new demand. A retracement into these lower levels would act as a healthy correction to the prior bullish impulse, maintaining structural balance.
Final Thoughts
The market has shifted from an aggressive expansion phase to a potential distribution stage. With liquidity taken at the highs and FVGs now providing resistance, the bias leans toward a corrective move lower before any renewed bullish continuation. A break below the local accumulation floor would confirm deeper targets.
If this breakdown helped clarify the current BTC structure, a like is always appreciated — and let me know: are you positioning for the correction, or waiting for the next bullish leg to form?
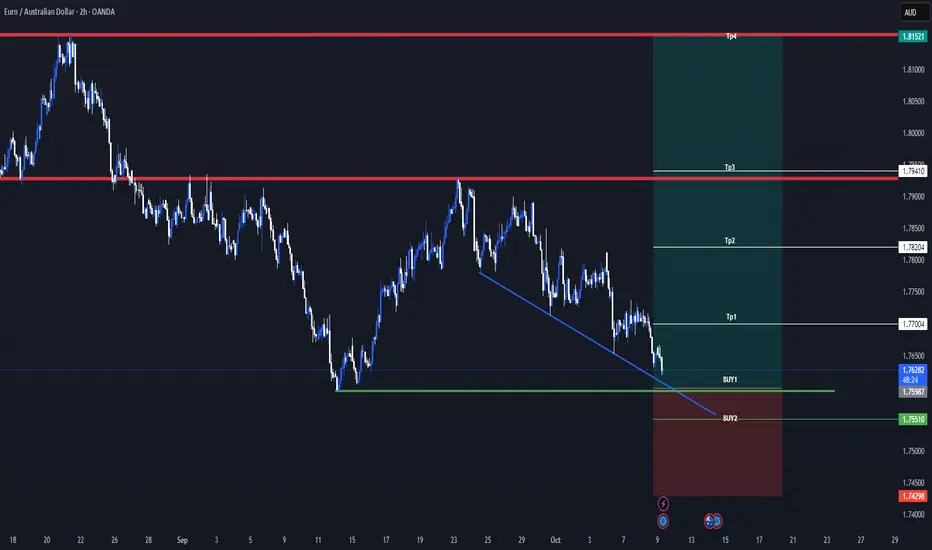
EURAUD Signal : H2 / H4 : Big Long !!!Hello Traders! 👋
What are your thoughts on EURAUD ?
This correction could offer a buy-the-dip opportunity, with potential for a move back toward the recent highs.
EURAUD H2 / H4
Market price : 1.7620
Buy limit : 1.7600 - 1.7550
Tp1 : 1.7700
Tp2 : 1.7820
Tp3 : 1.7940
Tp4 : 1.8150
Sl : 1.7430 ( 145 pip )
Don’t forget to like and share your thoughts in the comments! ❤️
Remember this is a position that was found by me and it is a personal idea not a financial advice, you are responsible for your loss and gain.
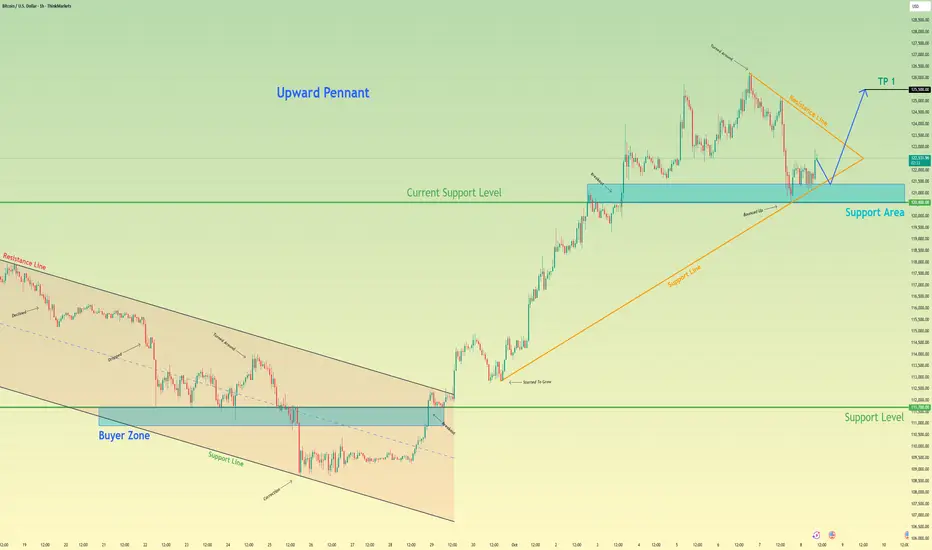
Bitcoin will Bounce From Pennant Support and Rally HigherHello traders, I want share with you my opinion about Bitcoin. The market structure for Bitcoin has recently undergone a major transition from bearish to bullish, following a decisive reversal from the 111700 support level. This shift triggered a breakout from the previous descending channel and gave rise to a new upward pennant pattern, a clear signal of strengthening bullish sentiment. After setting a new all-time high around 126000, BTC has entered a short-term corrective phase, retracing toward the 120600 area, which coincides with both the pennant’s ascending support line and a key horizontal support zone. To me, this pullback looks like a textbook healthy correction within an ongoing uptrend, allowing the market to consolidate before the next move higher. I anticipate that buyers will step in around this level, defending the support and initiating a strong rebound. If the price holds and bounces off the pennant’s support line, it could trigger a bullish breakout, resuming the upward momentum. Based on this outlook, my TP target remains set at 125500. Please share this idea with your friends and click Boost 🚀
Disclaimer: As part of ThinkMarkets’ Influencer Program, I am sponsored to share and publish their charts in my analysis.
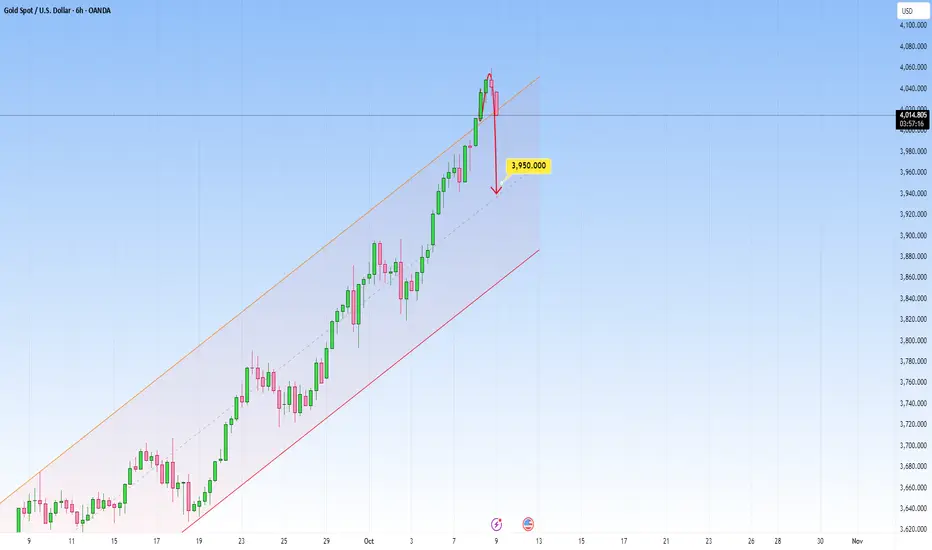
Lingrid | GOLD Psychological Barrier Cleared Upside IntactThe price perfectly fulfilled my previous idea . OANDA:XAUUSD continues its climb inside the upward channel, holding above the key 4,000 support after a clean rebound. Price action shows consistent higher lows supported by the upward trendline, signaling sustained bullish momentum. As long as the 4,000 level remains intact, a move toward 4,100 and potentially higher remains in play. The structure points to buyers consolidating for another extension within the ongoing trend.
⚠️ Risks:
A break below 4,000 could trigger a deeper retracement toward 3,950 support.
Rising U.S. yields or FOMC meeting may dampen gold’s momentum.
Profit-taking near psychological resistance could slow short-term upside continuation.
If this idea resonates with you or you have your own opinion, traders, hit the comments. I’m excited to read your thoughts!

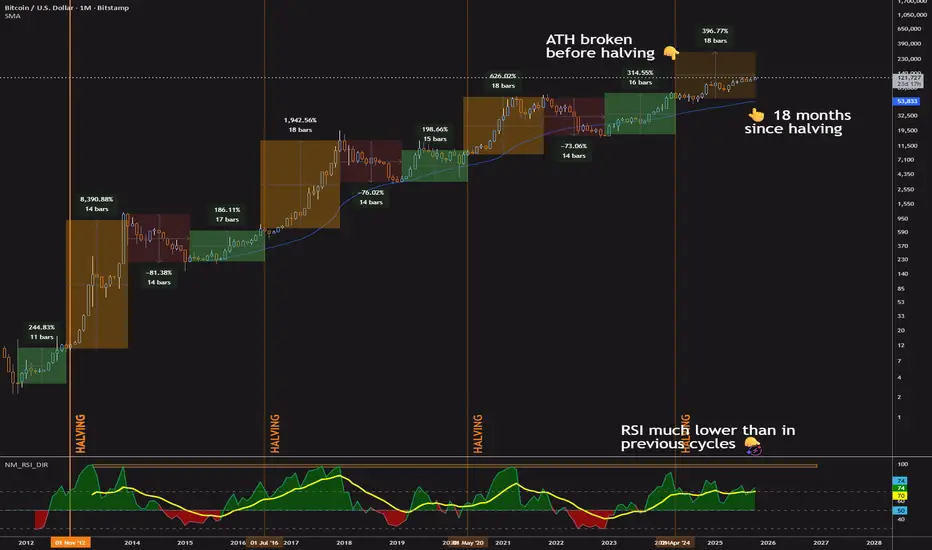
Is Bitcoin's 4-Year Cycle Over? Bitcoin’s 4-year cycle has been a go-to for traders, driven by halving events that spark price surges, sharp corrections, and recovery periods. But something’s off this time.
We’re 18 months into the post-2024 halving rally—hitting the historical peak for bull runs—yet there’s no sign of a crash, and the monthly RSI isn’t screaming overbought like in past cycles.
Instead, we’re seeing a slower, steadier climb that could keep going. The traditional cycle may be fading, and the shift from retail traders to institutional investors is the biggest driver.
❓ What Is Bitcoin’s 4-Year Cycle?
Bitcoin’s halving happens roughly every four years (or 210,000 blocks), cutting the reward miners get for adding new blocks in half. This reduces new bitcoin supply, often driving prices up if demand holds. The cycle typically has four stages:
Pre-Halving Rally: Prices rise in the months before the halving as anticipation builds.
Post-Halving Bull Run: After the halving, prices surge, often hitting new highs.
Bear Market: The rally fades, leading to a sharp correction.
Accumulation Phase: Prices stabilize at lower levels, setting up for the next cycle.
Here’s how these stages have unfolded in the past, also including the current cycle for comparison, with durations and price ranges (they are indicated on the chart):
📈 2012 Halving (November 2012):
Pre-Halving Rally: ~12 months (Nov 2011–Nov 2012, $2 to $12)
Post-Halving Bull Run: ~12 months (Nov 2012–Nov 2013, $12 to ~$1,150)
Bear Market: ~13 months (Dec 2013–Jan 2015, $1,150 to ~$170)
Accumulation Phase: ~15 months (Jan 2015–Apr 2016, ~$170–$450)
📈 2016 Halving (July 2016):
Pre-Halving Rally: ~10 months (Sep 2015–Jul 2016, $230 to $650)
Post-Halving Bull Run: ~17 months (Jul 2016–Dec 2017, $650 to ~$20,000)
Bear Market: ~12 months (Dec 2017–Dec 2018, $20,000 to ~$3,200)
Accumulation Phase: ~16 months (Dec 2018–Apr 2020, ~$3,200–$8,500)
📈 2020 Halving (May 2020):
Pre-Halving Rally: ~10 months (Jul 2019–May 2020, $4,000 to $8,700)
Post-Halving Bull Run: ~18 months (May 2020–Nov 2021, $8,700 to ~$69,000)
Bear Market: ~14 months (Nov 2021–Jan 2023, $69,000 to ~$16,500)
Accumulation Phase: ~15 months (Jan 2023–Apr 2024, ~$16,500–$60,000)
📈 2024 Halving (April 2024): Current cycle
Pre-Halving Rally: ~12 months (Apr 2023–Apr 2024, ~$26,000 to ~$73,000)
Post-Halving Bull Run: ~18 months (Apr 2024–Oct 2025, ~$73,000 to ~$90,000, ongoing)
Bear Market: nowhere to be seen
In the past, retail traders drove these cycles, fueled by hype on platforms like YouTube, X or Reddit. Now, institutions are reshaping the game.
ℹ️ Why the 4-Year Cycle May Be Over
We’re 18 months past the 2024 halving (April 2024–October 2025), matching the typical length of past bull runs. Yet, there’s no sign of a reversal. The monthly RSI, which hit 90+ at the peaks of previous cycles (2013, 2017, 2021), is only in the 60s–70s now, signaling controlled, gradual growth rather than a parabolic spike. This steady climb could continue, and here’s why the traditional cycle might be breaking down, with institutions leading the charge.
1️⃣ Institutions Are Driving the Market
Bitcoin used to be retail territory—everyday traders chasing hype on social media, buying into rallies, and selling in panic. Now, institutional investors like BlackRock, Fidelity, and MicroStrategy are pouring in billions. The U.S. spot Bitcoin ETFs launched in 2024 have amassed over $10 billion in assets by October 2025. Unlike retail traders, institutions don’t ride emotional waves. They treat Bitcoin as a long-term hedge or portfolio asset, creating steady demand.
This shift is a game-changer. A key difference this cycle? Bitcoin broke its previous all-time high (~$69,000 from 2021) before the 2024 halving, hitting ~$73,000 in March 2024—something that never happened in prior cycles, where new highs came post-halving. This early breakout, along with the 18-month rally without a crash and a moderate RSI, shows institutions are driving consistent buying, smoothing out the wild swings of past cycles. It’s like the market’s gone from a rollercoaster to a steady climb, and big money is the driving factor.
2️⃣ Halvings Have Less Impact
Early halvings slashed Bitcoin’s supply growth significantly—25% to 12% in 2012. The 2024 halving only dropped inflation from ~1.7% to ~0.85%. With ~19.7 million of 21 million coins already mined, the supply shock is weaker. Markets now price in halvings early, reducing the explosive surges of past cycles and miners have less BTC to sell, reducing impact on the market.
3️⃣ Macro Factors Are Taking Over
Bitcoin is increasingly tied to global markets. It fell in 2022 with stocks when the Fed raised rates and rallied in 2023–2024 as rate cuts seemed likely. Macro trends—interest rates, inflation, the dollar—now outweigh the halving’s influence. Institutions, focused on these factors, align Bitcoin’s price with broader financial markets, not its internal cycle. The Fed's announcement of further cuts, making money cheaper, point towards a further increase of BTC price.
4️⃣ Market Sentiment Has Matured
Retail FOMO used to cause massive pre-halving rallies, but traders are more disciplined now. The 2024 pre-halving rally was modest compared to past cycles, despite breaking the all-time high. Competition from altcoins and DeFi splits market focus. Institutions, with their data-driven approach, don’t chase hype, contributing to the steady growth we’re seeing.
5️⃣ On-Chain Data Shows a Shift
Models like Stock-to-Flow, once reliable, failed to predict 2024’s price action. Long-term holders are selling less, partly due to institutional custody, reducing sell pressure and muting bull run spikes. The moderate RSI and lack of a crash at the 18-month mark reflect a market driven by steady accumulation, not retail mania.
‼️ Traders: Bias can be dangerous
With the 4-year cycle potentially fading, caution is advised. Here’s how to adapt:
Track Macro Trends : Monitor Fed policy, inflation, and stock market moves. Use TradingView’s correlation tools to see how Bitcoin tracks with assets like the Nasdaq.
Use On-Chain Metrics : Check MVRV or Puell Multiple on TradingView to gauge market sentiment, independent of halving timelines.
Stay Flexible : Focus on shorter-term charts (daily, weekly) to catch trends, rather than waiting for cycle milestones.
Manage Risk : With less predictability, use tight stop-losses and smaller position sizes.
📃 So what's the conclusion?
Bitcoin’s 4-year cycle was a trader’s roadmap, but it’s losing its edge. We’re 18 months into the post-2024 halving rally, with no crash in sight and a monthly RSI signaling controlled growth that could persist.
Breaking the previous all-time high before the halving sets this cycle apart, driven by institutional demand. With weaker halvings, macro influences, and a more mature market, the old cycle may be history. In October 2025, Bitcoin is still going strong, but it’s moving to a new rhythm—driven by big money, not hype.
📢 What do you think?
Will Bitcoin’s cycles keep fading, or is the old pattern coming back? Share your thoughts in the comments!
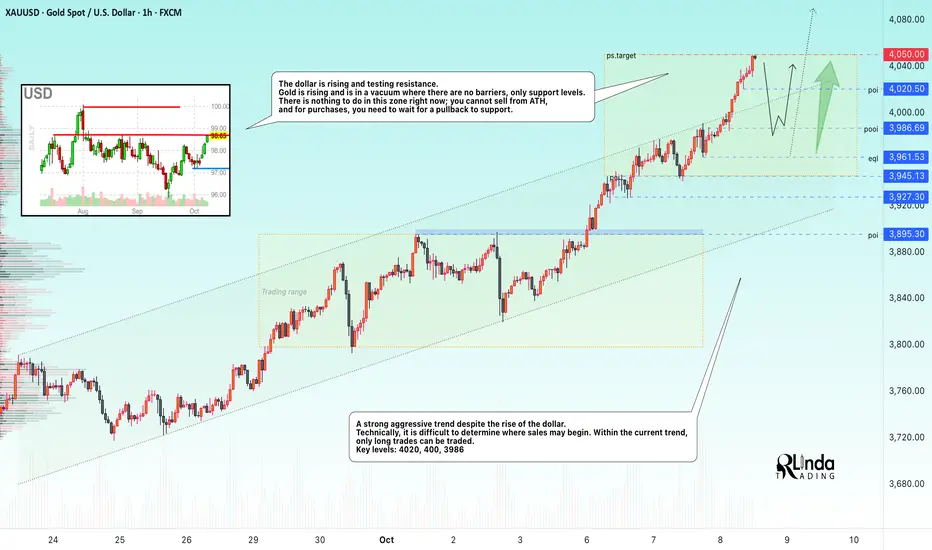
GOLD → Testing 4050 - 4100. Need a pullback to tradeFX:XAUUSD is hitting a new all-time high, testing $4,050, and looks set to reach $4,100. This record growth is linked to falling interest rates and economic risks, which are causing money to flow into hedge assets...
Key drivers: The White House may announce civil service cuts amid the shutdown, which increases uncertainty. The probability of interest rate cuts in October is 95%, supported by the delay in data publication due to the shutdown. Global central banks continue to build up reserves. However, as prices rise, so do the risks of correction. The USD is also receiving support as a safe haven, which may limit further growth in gold.
Resistance levels: 4050, 4075, 4100
Support levels: 4020, 400, 3986
Technically, we need to wait for a slowdown and correction to take a full breath before further movement. I consider the local liquidity zones of 4020 - 4000 - 3986, 3961 to be promising areas of interest. I do not rule out the possibility of sharp shocks in the market, so we need to be prepared...
Best regards, R. Linda!
S&P 500 INDEX (US500): Bullish Signal!? As US500 Eyes New HighUpdate on 📈US500
A confirmed breakout above a significant daily resistance level was observed.
Subsequently, the market retested the breached structure and initiated consolidation within a narrow range on the 4-hour timeframe.
The range resistance was breached yesterday, which constitutes a strong intraday bullish signal.
Further upward movement may extend to the 6800 level.

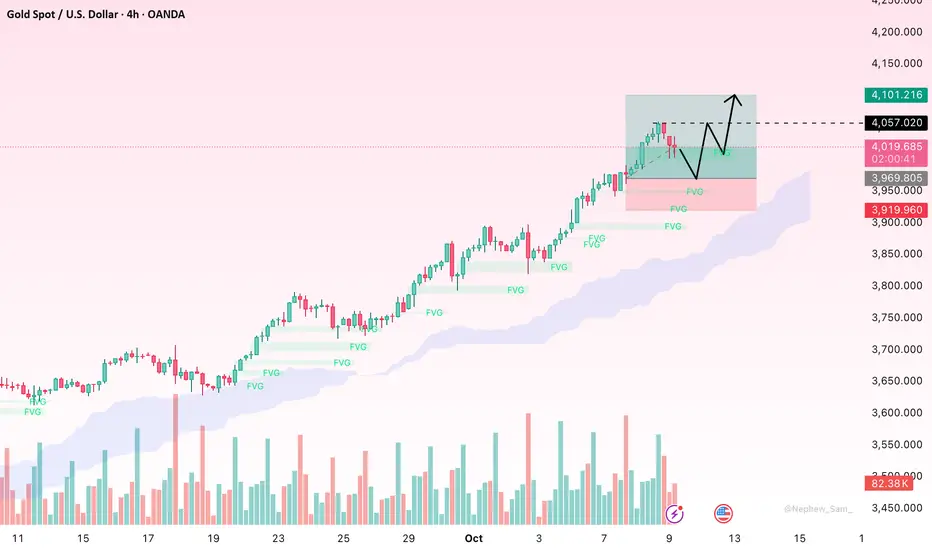
XAU/USD – Uptrend Persists After a Brief CorrectionHello everyone,
Gold is currently taking a natural pause after an impressive October rally. After reaching a peak near $4,036, prices pulled back slightly to around $4,021, yet the overall structure remains firmly bullish. The stepwise Fair Value Gaps (FVG) continue to form and fill shallowly — a healthy sign that the market is simply “breathing” before making its next move.
On the 4H chart, the Ichimoku cloud remains beneath price and is sloping upward, serving as a strong dynamic support zone. The pattern of higher highs and higher lows is intact, confirming that buying momentum continues to dominate. The $4,021 area aligns with a freshly formed FVG, while $4,000 acts as both a psychological and structural support level — both zones that buyers may use to reload positions.
Conversely, resistance lies near $4,036, and if broken decisively, gold could extend toward $4,050–$4,100 in the short term. The base case remains a shallow pullback to $4,021 or $4,000 before a continuation higher, possibly breaking prior highs.
What do you think — will gold soon break above $4,050, or does it need one more test before heading higher?
GOLD ROUTE MAP UPDATEHey Everyone,
Another PIPTASTIC day on the markets with our chart idea playing out as analysed.
After completing all our bullish targets, we stated yesterday that we now had a confirmed EMA5 cross and lock above 3965 opening 3993.
- This target was hit perfectly followed with a further cross and lock opening 4019 also hit today completing this chart idea!!
Please now review our remaining multi timeframe chart ideas to continue to track the movement as this chart idea is now completed.
Bullish Progress Recap
✅ 3907 – Done
✅ 3937 – Done
✅ 3965 – Done
✅ 3993 – DONE
✅ 4019 – DONE
As always, we will keep you all updated with regular updates throughout the week and how we manage the active ideas and setups. Thank you all for your likes, comments and follows, we really appreciate it!
Mr Gold
GoldViewFX

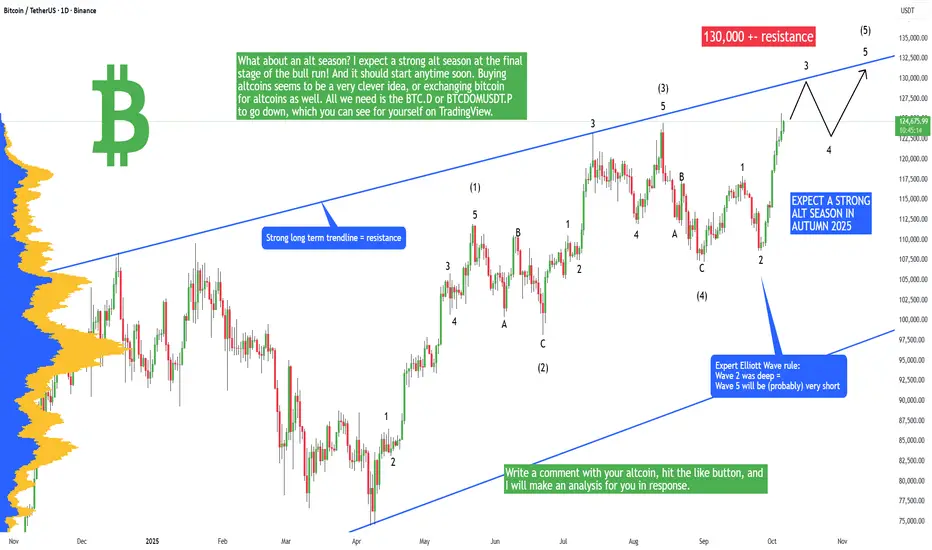
Bitcoin + ALT-SEASON 2025 Starting! (sell here, thank me later)Bitcoin has been pumping heavily in past days! And this trend will likely continue the whole month of October. We have a very likely scenario that will probably happen on Bitcoin, and in this analysis I will tell you which one!
The Elliott Wave theory is one of the strongest tools that you can use to analyze the crypto market. Why? Even banks use this theory, and they pay in gold to expert Elliott wave analysts. What we can see on the current chart of Bitcoin is that we are clearly in wave 3. Wave 1 and Wave 2 are also very clear, so it's really hard to argue against this Elliott wave count because it's pretty much a textbook example. That's very exciting because we can predict the future with a high probability of success. I drew an arrow on the chart so you see this prediction without any misunderstanding. Together with the blue long-term trendline, I think we have an extremely strong resistance. If you sell Bitcoin here and tell everyone that you sold the top at 131K, I would consider it a huge success.
What about an alt season? I expect a strong alt season at the final stage of the bull run! And it should start anytime soon. Buying altcoins seems to be a very clever idea, or exchanging bitcoin for altcoins as well. All we need is the BTC.D or BTCDOMUSDT.P to go down, which you can see for yourself on TradingView.
So I think you see my prediction and I hope you like it! But what altcoins to buy? Write a comment with your altcoin + hit the like button, and I will make an analysis for you in response. Trading is not hard if you have a good coach! This is not a trade setup, as there is no stop-loss or profit target. I share my trades privately. Thank you, and I wish you successful trades!
Gold Bullish Setup Targeting New ATHThis XAU/USD 1-hour chart shows gold trading around 4039 with a bullish setup. Price is respecting the support trend line, confirming upward momentum. Key support is marked near 4001, providing a strong base for buyers.
The chart highlights the previous ATH at 4060 and projects a potential breakout towards a new all-time high at 4115. The structure suggests a possible short-term pullback to retest support before continuing higher. As long as the trend line holds, the bias remains bullish with upside targets at 4058, 4087, and finally 4115.

XAU/USD | Gold Breaks into $4K Zone – Eyes on $4084 Next!By analyzing the Gold (XAUUSD) chart on the 15-minute timeframe, we can see that the price finally entered the historic $4000 channel today and even surged up to $4050!
It’s now trading around $4042, and if gold manages to stay above $4028, we can expect further bullish movement.
The next upside targets are $4060, $4070, and $4084 — keep a close eye on the price reaction, especially around $4084!
Please support me with your likes and comments to motivate me to share more analysis with you and share your opinion about the possible trend of this chart with me !
Best Regards , Arman Shaban

Latest Gold Price Update Today👋Hello everyone, let's take a look at OANDA:XAUUSD !
Gold has just experienced an incredible surge, briefly reaching 4059 USD, setting a new historic high. This recent upward movement continues to be supported by the ongoing US government shutdown and various geopolitical uncertainties, which have pushed the price of this precious metal to new heights.
From a technical perspective, at the time of writing, XAUUSD is experiencing a slight pullback. However, the most favorable path remains upward, and there are no signs yet of a deep correction threatening the precious metal. Any short-term correction is seen as a buying opportunity, especially as gold remains a safe haven. The next target is 4100 USD. 💬Do you think this will happen?

NZDUSD Eyes 0.5730 Rebound as Dollar Weakens Near DXY ResistanceHey Traders,
In today's trading session, we are monitoring NZDUSD for a buying opportunity around the 0.57300 zone. The pair has been moving within a descending channel and is now approaching the lower boundary, suggesting potential for a technical rebound from channel support.
From a macro perspective, the bearish bias on the U.S. Dollar—driven by the ongoing government shutdown and sustained pressure near the 98.800 resistance on DXY—could further support upside momentum in NZDUSD.
Trade safe,
Joe.

Xauusd again Bullish SetupGold (XAU/USD) is trading near the demand zone after a pullback. Price is expected to bounce from support around 4020 toward the target level of 4082. Buy setup active with stop loss below 3995.

ETH/USDT: Two shortsHi guys!
Overall Market Structure
The price has been moving within a rising parallel channel, making higher highs and higher lows, which forms a bullish structure.
Recently, however, the price broke below the lower boundary of the ascending channel, signaling a potential bearish reversal or a correction phase.
The recent bounce toward the previous channel support (now resistance) forms a potential short entry zone.
📉 Short Position 1 (Aggressive Entry)
Entry: Around $4,485–$4,500
Reasoning: Price retested the broken channel support line (now acting as resistance).
Stop-Loss: Above $4,575, just beyond recent swing high/structure break.
Take-Profit: Around $4,345.
Risk–Reward: Approx. 1:2
📉 Short Position 2 (Conservative Entry / Continuation Setup)
Entry: After a confirmed lower high and bearish candle close below $4,450.
Reasoning: Confirms momentum shift toward the downside.
A break and retest of $4,345 support could open the way to $4,090, the next demand zone.
Stop-Loss: Above $4,510 (recent minor resistance).
Take-Profit: Around $4,090 (bottom of marked green area).
Risk–Reward: Approx. 1:3 or higher

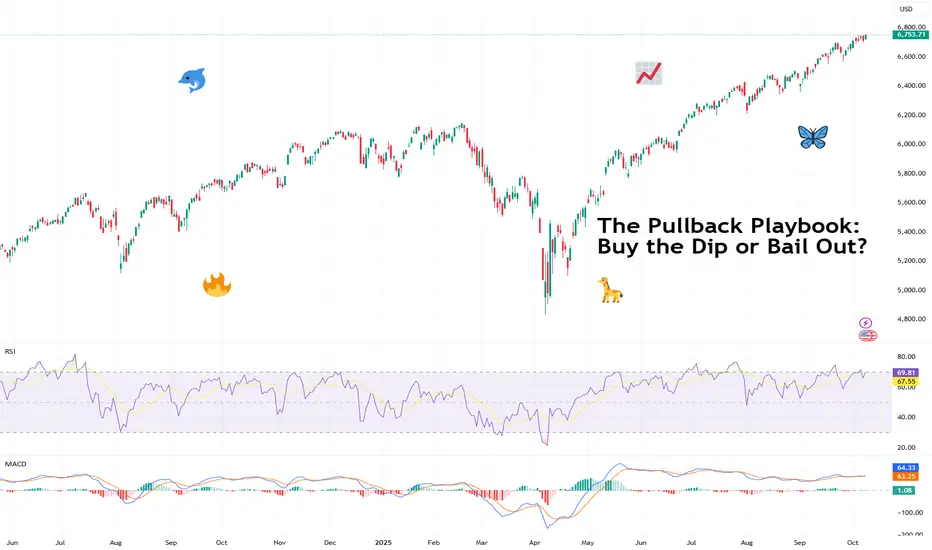
The Pullback Playbook: Buy the Dip or Bail Out?Markets don’t go up in straight lines. Even the strongest trends pause, retrace, and test your conviction.
These pauses are called pullbacks and they can either be healthy breathers before the next leg higher or the first cracks in a trend about to fall apart. The challenge for traders is knowing the difference.
📉 What Exactly Is a Pullback?
Think of a pullback as a temporary trend halt, not necessarily a crash. The price moves against the prevailing trend for a short period, testing support levels or shaking out weak hands before deciding where to go next. They’re common, normal, and — if managed right — they’re opportunities rather than threats.
But here’s where it gets tricky: not all pullbacks are trend halts. Some are the start of a flat-out reversal. And unless you’re comfortable holding through a potential nosedive, you need skills and tools to tell which is which.
🧐 Pullbacks vs. Trend Reversals
So how do know if you’re looking at a pullback or a trend reversal? The main differentiating factor is the length of the move. The healthy pullback looks orderly — modest in size, controlled in volume, and often retracing to familiar moving averages or support zones.
A healthy pullback might retrace 3-5% in a bull run, testing the 20- or 50-day moving average before bouncing higher.
A trend reversal barrels through multiple support levels in days, erasing weeks of gains. It’s often sharper, louder, and driven by news or panic.
Signs of a healthy pullback include:
• Price holding above key moving averages (20, 50-day. Some stretch to the 100-day but these tend to be rare — it’s more likely a trend reversal by then).
• Volume shrinking on the way down, then swelling on the rebound.
• Oscillators like RSI cooling off from overbought territory without plunging into oversold.
Trend reversals look more like:
• Breaks of multiple support levels in one go.
• Heavy, accelerating sell volume.
• Headlines driving panic: tariffs, central bank surprises, data releases from the Economic calendar , crypto exchange blowups, or noise coming from the Earnings calendar .
📊 Technical Tools to Judge the Dip
Charts can’t predict the future, but they can help you gauge probabilities. Pullbacks often line up with Fibonacci retracements, moving averages, or horizontal support and resistance levels.
• Moving Averages : If price pulls back to the 50-day and holds, that’s often a green light for trend continuation. If it slices straight through the 100-day? Not so healthy.
• Trendlines : Respecting the line = confidence. Breaking it = trouble.
• Volume : Low-volume pullbacks suggest sellers aren’t that committed. High-volume dumps are red flags.
None of these are crystal balls. But together, they give you a framework to avoid buying every dip.
🏄♂️ The Psychology of Buying the Dip
Why do traders love dips? Because everyone wants a discount. A pullback offers a chance to jump on a trend at a better price, and social media culture has turned “buy the dip” into a meme strategy. But memes don’t pay the bills when a dip turns into a crater.
The psychology works both ways:
• Optimists see dips as golden tickets.
• Pessimists see them as traps.
• Realists know both can be true, depending on the setup.
Being aware of your own bias — whether you lean toward buying too early or panicking too soon — is half the battle.
🔄 Asymmetric Risk and the Smart Bet
Here’s where it gets interesting. You don’t need to be right all the time if your risk-reward ratio is skewed in your favor. A tight stop and a wide target can mean one win cancels out several small losses.
Imagine risking 1% to potentially make 10%. Even if you’re wrong most of the time, the math can work. Pullbacks are prime territory for asymmetric setups: smart, thought-out entries, clear invalidation points (below support, trendline breaks), and attractive upside if the trend resumes.
This doesn’t mean chasing every dip. A pullback can wipe your position clean if you’ve placed your stop loss a little too close, a little too early.
⏳ Timing Matters
The biggest mistake with pullbacks is trying to catch the exact bottom. Traders love to brag about nailing the wick, but most who try end up paying for it. Smarter is to wait for confirmation — a bounce, a reversal candle, a break back above a short-term moving average.
Yes, you may miss the lowest price. But you’ll also miss buying into a freefall.
🌍 Pullbacks in Context
Context is everything. A dip in a raging bull market is not the same as a dip in a shaky sideways market. Macro matters too. If the Fed is cutting rates , risk assets might rebound fast. If tariffs, wars, or inflation are spiking, a pullback could turn into something bigger and deeper.
That’s why traders zoom out before diving in. Daily charts tell one story; weekly charts often tell the bigger tale.
🚀 Buy or Bail?
So, do you buy the dip or bail out? The honest answer is: it depends. A well-structured pullback in a strong uptrend with unchanged fundamentals is an opportunity.
A violent, volume-heavy selloff in a fragile market with cracked fundamentals is a warning.
The pullback dilemma isn’t just about charts but also about psychology. Can you hold your nerve when the market wobbles, or will you cut and run? Both choices can be right in the right context.
🎯 Final Takeaway
Pullbacks are part of every trend’s DNA. They test conviction, patience, and risk management. The key isn’t to predict every wiggle but to recognize whether price action is just cooling off or signaling something bigger.
Stay disciplined, respect your stops, and let the chart, not the noise, tell you when it’s time to stay in or step aside.
Off to you : Buy the dip? Or bail out? How do you respond to expected and unexpected market pauses? Let us know your coping mechanism in the comments!
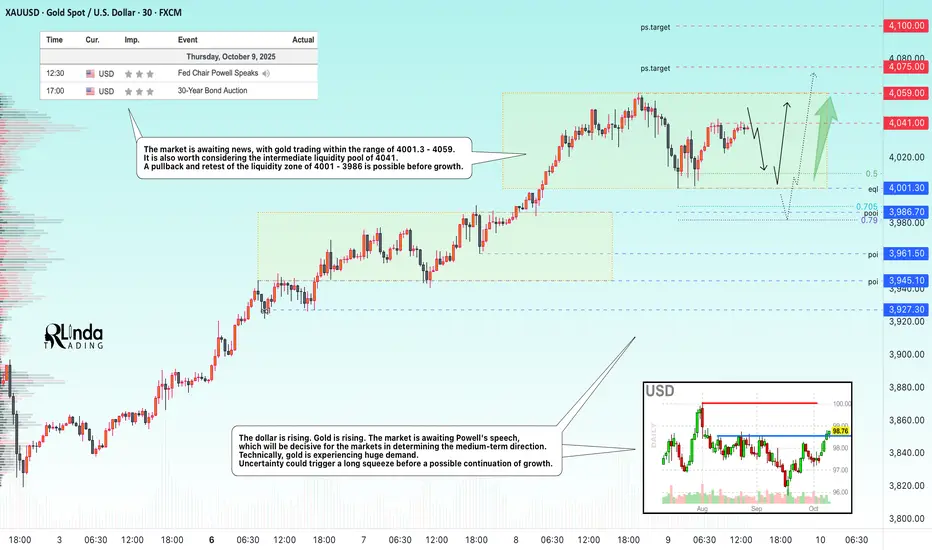
GOLD → The correction will provide a good opportunity for longFX:XAUUSD remains above the psychologically important level of $4,000, having corrected from a record high of $4,059. The market is awaiting Powell's speech, which could set the medium-term tone for the markets...
Key supporting factors: Uncertainty over the shutdown: The phased reopening plan has not yet been approved, which is keeping demand for safe-haven assets high.
Expectations of Fed easing: The probability of a rate cut in October is 100%, and in December is 80%, despite disagreements within the Fed.
As prices rise, the risks of a correction increase, especially against the backdrop of the Fed chair's speech.
Gold remains in a bullish trend. A correction to $4,000 looks like a healthy pause. Further dynamics depend on the Fed's tone and developments with the shutdown — a break below $4,000 is unlikely without new fundamental reasons.
Resistance levels: 4041, 4059, 4100
Support levels: 4001, 3986
Technically, gold has been rising without pullbacks for 35 days. The growth amounted to more than 22%. Accordingly, the market may form corrections, pullbacks, or consolidations within local timeframes. News may provoke such corrective maneuvers before the main movement. I consider the support levels of 4000 - 3986 - 3961 to be areas of interest. A retest or false breakdown could trigger a rebound and growth.
Best regards, R. Linda!
Bitcoin Holds Strong: Bullish Breakout Could Target 127KBitcoin Holds Strong: Bullish Breakout Could Target 127K
Bitcoin recently reached a historic high near 125,760 before correcting about 4%, pulling back to around 120,600.
After this brief correction, the price has started to accumulate again, forming and breaking out from a clear bullish triangle pattern — a signal of renewed upward momentum.
If this breakout confirms, Bitcoin could extend its rally toward the 123,700 and 124,900 levels, which are reasonable short-term targets before any larger correction.
A break above the recent top would strengthen the bullish case, opening the way for a potential rise toward 127,000.
Key Targets:
123,700
124,900
127,000
For now, Bitcoin should respect this short-term pattern. If the structure fails, it might become a temporary trap for short-term traders — though swing and long-term investors would likely remain unaffected.
You may find more details in the chart!
Thank you and Good Luck!
❤️PS: Please support with a like or comment if you find this analysis useful for your trading day❤️

Bitcoin 119K & 116K will pump it above $130000As we can see price is still bounded with range zone and previous breakout was fake and still 126K$ and 125K$ holding strong but soon from the mentioned support we can expect heavy pump and new ATH above 127K$ or 132K$.
DISCLAIMER: ((trade based on your own decision))
<<press like👍 if you enjoy💚

Gold Holds 4,010 Ahead of Powell as Shutdown Clouds CPI OutlookHey Traders,
In today’s session, we’re keeping a close eye on XAUUSD for a potential buy setup around the 4,010 zone. Gold remains in a broader uptrend, and the current pullback brings price action near a key support and trend confluence that could attract fresh buyers.
All eyes are on Fed Chair Powell’s remarks later today. With the U.S. government shutdown disrupting key economic releases, including a possible delay of next week’s CPI data, Powell’s tone could heavily influence short-term Dollar sentiment—and by extension, Gold momentum.
If Powell hints at policy caution amid data uncertainty, the safe-haven narrative could re-emerge quickly. We’ll be watching closely for a potential technical trigger to align with the macro backdrop.
Trade safe,
Joe.

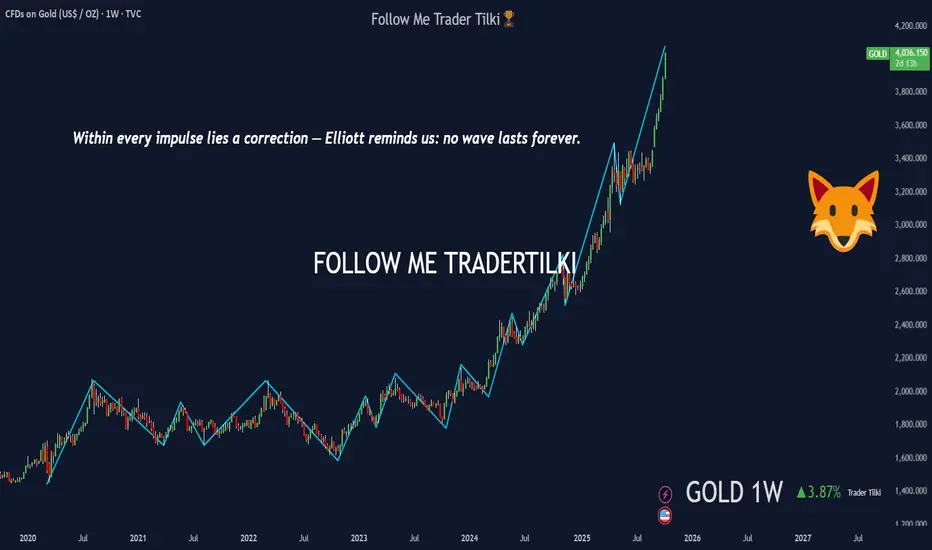
Impulse and Correction — XAUUSD-GOLD InformationElliott Wave Perspective on Gold
Gold is now testing the $4,000 level, marking one of its historic highs. On a yearly basis, the metal has been in a strong uptrend for a long time. But Elliott Wave Theory reminds us: no impulse lasts forever — every rally hides a correction.
At some point, this climb will lose steam and give way to a pullback. The real question is when — and that timing is known only by the market movers. Elliott’s structure shows us probabilities, not certainties.
👉 Consider this purely educational and informational. One day we will see sharp drops in gold, because just as every relentless rally comes with a relentless fall, gold is no exception.
💬 My friends, every single like from you is my biggest motivation to keep sharing these analyses. Thank you to all who support me with your likes.