GOLD - Hunting for liquidity ahead of growth. Focus on 4475FX:XAUUSD reached a new historic high of around $4,525. However, profit-taking is causing a correction, with the 4,475-4,470 range being the area of interest in the bull market.
The dollar is weakening, with the market anticipating two rate cuts in 2026. Geopolitical risks are supporting demand for safe-haven assets. Positive US GDP data for Q3 (+4.3%) did not support the dollar due to expectations of a slowdown in growth in Q4.
The dollar index has hit its lowest level since early October. Today, US jobless claims data will be released, which may increase volatility. The overall positive sentiment in the stock markets is holding back more active growth in gold.
The upward trend in gold continues. Any significant correction is likely to be seen as a buying opportunity, given the Fed's accommodative monetary policy and geopolitical uncertainty.
Resistance levels: 4500, 4525
Support levels: 4475, 4470, 4466, 4452
Focus on the current trading range of 4475-4525. A false breakdown of support could attract buyers waiting for favorable prices. I do not rule out a retest of 4452-4442 before growth (against the backdrop of aggressive profit-taking).
Best regards, R. Linda!
Community ideas

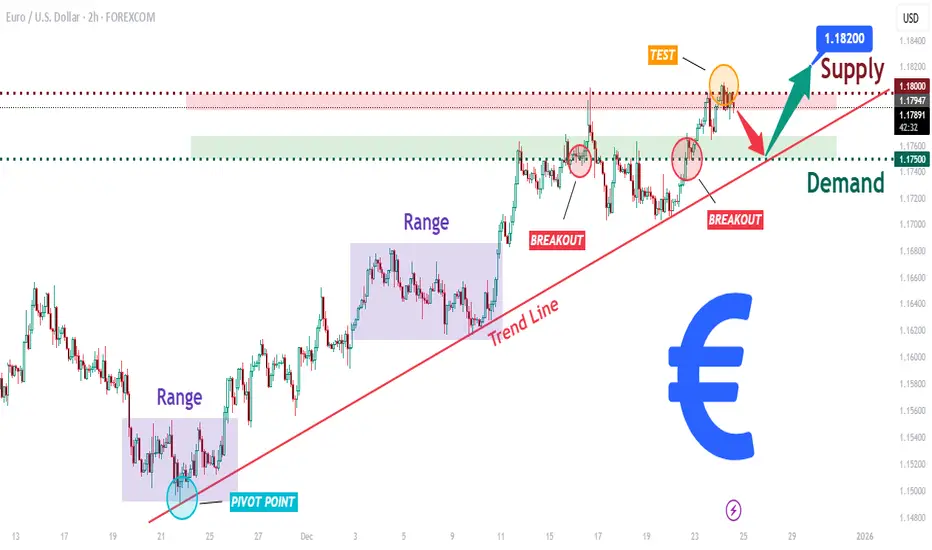
EURUSD Long: Trend Line Support Keeps Buyers, Move to 1.8200Hello traders! Here’s a clear technical breakdown of EURUSD (2H) based on the current chart structure. EURUSD is trading in a well-defined bullish trend, supported by a rising trend line that has guided price action from the recent pivot low. After an initial consolidation phase, price broke out of multiple range structures, confirming increasing buyer strength and a shift in market control to the upside. Each breakout was followed by shallow pullbacks, showing strong demand absorption.
Currently, EURUSD pushed into the supply zone around 1.1800, where selling pressure emerged. The current rejection from this area appears corrective, not impulsive, suggesting profit-taking rather than a trend reversal. Price remains above the key demand zone near 1.1750, which aligns with previous breakout levels and the ascending trend line, reinforcing its importance as structural support.
My scenario: as long as EURUSD holds above the 1.1750 demand zone, the bullish structure remains valid. A strong reaction from demand could lead to another test of the 1.1800 supply, and a clean breakout with acceptance above this level may open the path toward 1.1820 and higher. A decisive breakdown below demand would weaken the bullish setup and signal a deeper correction. For now, the bias remains bullish while price respects the ascending structure. Manage your risk!
XAUUSD Maintains Support – Buyers Eye $4,560Hello traders! Here’s my technical outlook on XAUUSD (Gold, 2H) based on the current chart structure. Gold continues to trade within a well-defined ascending channel, confirming a sustained bullish market structure. After a prolonged consolidation phase (range) on the left side of the chart, price successfully broke above resistance, signaling a shift in control from sellers to buyers. This breakout marked the beginning of the current impulsive bullish leg. Following the breakout, price accelerated higher and is now approaching the Seller / Resistance Zone around 4,500–4,510, where selling pressure has started to appear. The recent pullback is bringing price back toward the Buyer Zone near 4,430, which aligns with the previous breakout level and the midline/support of the ascending channel. This confluence makes the area a key demand zone to watch. Structurally, the pullback remains corrective, with price still holding above channel support and the broader bullish trend intact. My scenario: as long as Gold holds above the 4,430 Buyer Zone, the bullish structure remains valid. A strong reaction from this area could trigger another push toward the 4,560 (TP1) and potentially higher if a clean breakout occurs. A decisive breakdown below the buyer zone would signal a deeper correction. For now, buyers remain in control while price respects the ascending channel. Please share this idea with your friends and click Boost 🚀

Bitcoin - Channel no one talks about! (new Year's crash!)Bitcoin's price and development (code) are completely controlled by banks and government. They already have a roadmap on Bitcoin price, so they know what the price will be in 2030. Bitcoin technology is great for total control because all transactions are public. How to profit from that? First of all, you have to identify the big players on the chart and trade with them. They want to make as much money as possible on the way up, so that's why they cannot push the price to the upside in a straight line - they create a lot of traps and patterns on the chart.
When too many people are bullish, it's not worth it to them to send the price up, rather they push the price down in the short term and take all stop losses (your money is a stop loss). You are forced to sell, and guess who buys your order? Most likely the banks, because they love Bitcoin.
What we see on the chart is a blue descending parallel channel. This channel is the current pattern that we play on Bitcoin in this timeframe. Because the price is inside the channel and near the trendline resistance, we cannot be bullish at this point. What traders must understand is that we sell a resistance and buy a support, not the opposite. Currently the price is in a sell zone around 90k - 91k at the top of the channel. There is still an unfilled FVG at 91k - 92k that acts as a strong resistance. January is ticking on the door, and we know that statistically January is one of the most bearish months for Bitcoin. Currently I do not see any reason to be bullish, so I have to stay bearish at this point.
Write a comment with your altcoin + hit the like button, and I will make an analysis for you in response. Trading is not hard if you have a good coach! This is not a trade setup, as there is no stop-loss or profit target. I share my trades privately. Thank you, and I wish you successful trades!

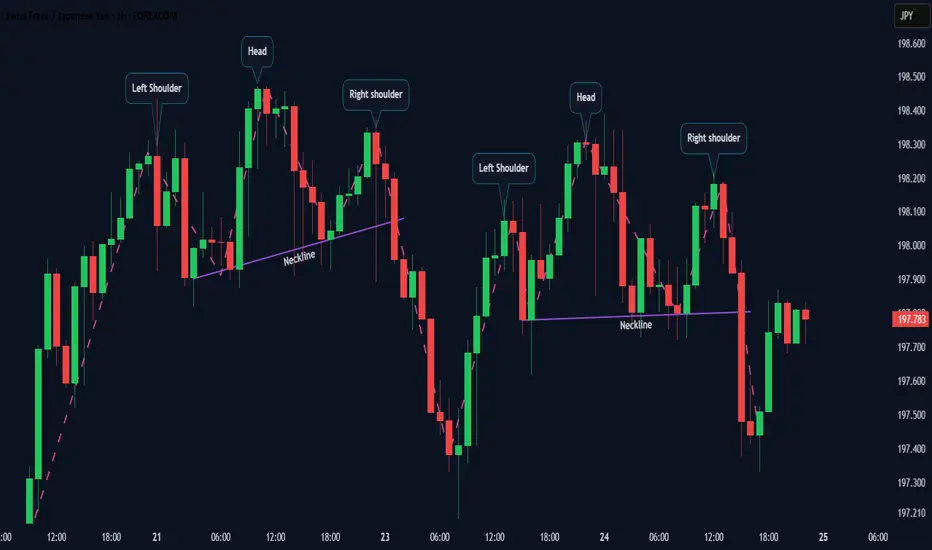
Rare Double Head & Shoulders After an Uptrend Market Context
After a sustained uptrend, price started to lose momentum and formed a classic Head & Shoulders pattern. What makes this structure interesting is that the market did not reverse impulsively — instead, it developed a second Head & Shoulders formation shortly after the first one.
Why this is interesting
Seeing two consecutive Head & Shoulders patterns after an uptrend is relatively rare. This often reflects a gradual distribution phase, where buyers slowly lose control and sellers gain confidence step by step.
Key Observation
Both structures respected their respective necklines , highlighting how the market transitions from strength to weakness through structure rather than randomness.
ETHICAL & EDUCATIONAL NOTICE
This content is presented solely for educational and analytical purposes , based on historical price data.
It does not promote or encourage any specific trading method, financial instrument, gambling, leverage, margin usage, short selling, or interest-based activity .
Readers are encouraged to align any financial activity with their own ethical, legal, and religious principles .
⚠️ DISCLAIMER
This material is strictly educational and informational .
It does not constitute financial advice, investment recommendations, or trading instructions.
The author does not provide personalized guidance.
Any decisions made based on this content are the sole responsibility of the individual.
Gold Hits ATH Before Christmas — Is a Correction Coming?🎄🎄🎄 Merry Christmas, Traders! 🎄🎄🎄
Wishing you a joyful Christmas filled with good vibes, calm markets, tight stop-losses, and charts that respect your levels😄.
May you spend this season with your family, loved ones, and everyone who truly matters — away from stress, noise, and overtrading.
Enjoy the holidays, protect your capital,and come back refreshed for the new trading year.
Best wishes to all my followers — thank you for being part of this journey ✨
-----------------------------
Historically, Gold has not printed all-time highs during the Christmas period.
Most ATHs have occurred during macro stress events, not holiday sessions.
As we approach Christmas, the market typically sees:
Lower trading volume
Reduced institutional participation
More range-bound and slower price action
This period is usually characterized by consolidation or mild directional moves, rather than strong breakouts.
Important trends and decisive moves in Gold often emerge after the holidays, when liquidity returns and institutional positioning resumes in early January.
-----------------------------
Currently, gold is moving near a resistance zone($4,506-$4,494) and, over the past few days, it has consistently formed new all-time highs (ATHs).
From a classic technical perspective, gold, after experiencing a strong decline in momentum yesterday, seems to have formed a symmetrical triangle. A break below the lower line of this triangle could lead to a short-term downward movement for gold.
From an Elliott Wave perspective, it appears that gold has completed wave 5, and we should now expect corrective waves. Given the intensity of the downward momentum, these corrective waves could be quite significant.
I expect gold to decline from the resistance zone($4,506-$4,494) and the lower line of the symmetrical triangle, at least down to the support zone. Considering the approach of Christmas, trading volume is likely to be low, so larger targets might be more relevant after the holiday season.
First Target: Support zone($4,478-$4,466)
Second Target: Support zone($4,43-$4,426)
Stop Loss(SL): $4,514
Points may shift as the market evolves
💡 Please respect each other's opinions and express agreement or disagreement politely.
📌 Gold Analyze (XAUUSD), 15-minute time frame.
🛑 Always set a Stop Loss(SL) for every position you open.
✅ This is just my idea; I’d love to see your thoughts too!
🔥 If you find it helpful, please BOOST this post and share it with your friends.

SOLUSDT may continue its trend after correctionSOL is falling. Downward trend. A cascade of resistance is forming. At the moment, the price is testing the 121 level from D1. I expect a pullback due to a local change in the imbalance of forces after a false breakout of support and a subsequent fall from the 123-124 zone to 116.
Any upward pullback is accompanied by a weak surge in volume, which immediately fades away. There are no buyers in the market.
Scenario:
There are two important zones to which the market may react:
- A retest of 123.0 and a false breakout could lead to a decline.
- A close below 121.0 could also lead to a decline

2026 - The best year ever!🙏 2026 will be the best year ever :
-> Focus on financial health
-> Focus on physical health
-> Focus on social health
and always remember to keep your #LONGTERMVISION
SwingTraderPhil
SwingTrading.Simplified. | Investing.Simplified. | #LONGTERMVISION

EURUSD: The Uptrend Remains Intact – BUY Still Holds the AdvantaHello everyone, below is my view on today’s EURUSD outlook.
From a fundamental perspective, the overall backdrop continues to support the euro. The U.S. dollar remains under pressure as expectations for U.S. interest rates weaken, despite occasional short-term technical rebounds. The key point is that USD strength is not sufficient to reverse the trend, which overall allows EURUSD to maintain its upward momentum.
Looking at the chart, the bullish structure remains very clean and well-respected. Price is trading above the Ichimoku cloud, with the cloud sloping upward, confirming that the primary trend is bullish. The ascending trendline has been respected throughout and has not been broken. After the recent rally, price is now consolidating above the 1.1770 support zone, which signals a healthy market, not distribution.
As long as EURUSD holds above this key base, the probability remains high for price to continue pushing toward the 1.1840 area, as marked on the chart. Any volatility along the way should be seen as technical corrections, not as a change in the overall bullish structure.
Conclusion: EURUSD is still moving in line with its bullish trend. The strategy remains to BUY with the trend, avoid FOMO at the highs, and wait patiently for confirmation that support holds. As long as the structure stays intact, the advantage remains with the buyers — and that is always the side worth aligning with.

BTC/USDT | More Downside Ahead? Let's Discuss in the Comments!Bitcoin climbed back to $90,500, tapped resistance, and is now trading around $87,800. This bounce looks more like a classic liquidity grab than a trend reversal. I’m still leaning bearish. As long as $90,000 doesn’t flip into solid support, we’re likely heading lower. My next downside targets: $85,000 → $82,700 → $80,500
Nothing’s changed, structure is still weak, and the pressure’s on the bulls.
Please support me with your likes and comments to motivate me to share more analysis with you and share your opinion about the possible trend of this chart with me !
Best Regards , Arman Shaban

Lingrid | GOLD Compression Then Acceleration in Bull MoveOANDA:XAUUSD remains firmly inside a rising channel after breaking above the previous all-time high, with the former resistance now acting as dynamic support. Price recently paused near 4520, but the structure still shows higher highs and higher lows, suggesting continuation rather than distribution. The pullback looks corrective so far, occurring above the ascending trendline and prior breakout zone.
If buyers continue to defend the 4,410 area, gold may attempt another expansion toward the 4,600 resistance, where the upper channel boundary aligns with projected extension targets. Momentum conditions still favor upside as long as price holds above the reclaimed trendline.
➡️ Primary scenario: support holds at 4,410 → continuation toward 4,600.
⚠️ Risk scenario: loss of 4,410 could trigger a deeper retracement toward 4,300 before buyers re-engage.
If this idea resonates with you or you have your own opinion, traders, hit the comments. I’m excited to read your thoughts!

Elise | BTCUSD | 30M – Distribution → BOS → Liquidity SweepBITSTAMP:BTCUSD
The sell-side liquidity sweep produced a technical bounce; however, price has failed to reclaim key structure or break descending resistance. This indicates a corrective retracement, not accumulation. Until a bullish structure shift occurs, downside continuation remains the higher-probability scenario.
Key Scenarios
❌ Bearish Continuation (Primary Bias)
Rejection below descending trendline keeps BTC vulnerable to another liquidity run.
🎯 Target 1: 86,600
🎯 Target 2: 86,200 – 86,000
✅ Bullish Invalidation
Only a 30M close above 88,000 with structure shift invalidates bearish continuation and opens room for higher retracement.
Current Levels to Watch
Resistance 🔴: 87,900 – 88,000
Support 🟢: 86,600 → 86,000
⚠️ Disclaimer: This analysis is for educational purposes only. It is not financial advice.

BITCOIN Merry Christmas with symmetry at its very best!First of all allow me to wish everyone Merry Christmas with Tradingshot's best wishes to everyone for great health and prosperity!
Now as far as Bitcoin (BTCUSD) is concerned, this chart on the 1W time-frame displays once more its symmetry among Cycles at its very best.
They key component here is the Supertrend. Every time this indicator turned red (bearish) as it has done now since November 10, BTC has already started its Bear Cycle. The amazing symmetry here is found in the past 5 weeks when the price has been ranging within the 1W MA50 (blue trend-line) and the 1W MA100 (green trend-line).
As you can see the moment it broke below the 1W MA100, it also breached the 0.182 Fibonacci retracement level and entered the 0.182 - 0.236 Fib Zone. This has happened every single time with remarkable precision since the 2014 Bear Cycle. The last two Cycles bottomed on the 0.382 Fib at least.
So what does that mean for us now/ today? Well first of all, the current Bear Cycle is likely to reach $56500 (0.382 Fib) at least. Secondly, every Bear Cycle bottomed around 44 - 46 weeks after the Supertrend turned red. This gives us a fair time horizon for the potential bottom around September 14 2026.
Would you be buying once $56500 hits or come September 2026? Feel free to let us know in the comments section below!
---
** Please LIKE 👍, FOLLOW ✅, SHARE 🙌 and COMMENT ✍ if you enjoy this idea! Also share your ideas and charts in the comments section below! This is best way to keep it relevant, support us, keep the content here free and allow the idea to reach as many people as possible. **
---
💸💸💸💸💸💸
👇 👇 👇 👇 👇 👇

BTCUSDT: Buyers Defend 86K Support, Upside in FocusHello everyone, here is my breakdown of the current BTCUSDT setup.
Market Analysis
BTCUSDT has shifted its structure after breaking out of a prolonged Downward Channel, signaling a loss of bearish control and the start of a stabilization phase. Following the breakout, price entered a broad range, bounded by a clear Resistance Zone around 90,300 and a Support Zone near 86,000. This range reflects market indecision after the strong sell-off.
Currently, price has formed a triangle structure, with descending resistance and ascending support lines, indicating compression and preparation for a directional move. Recently, BTCUSDT tested the lower boundary of the range and successfully defended the Support Zone, followed by a breakout from the short-term structure, suggesting renewed buyer interest. Current price action shows consolidation above support, favoring a bullish continuation scenario.
My Scenario & Strategy
My primary scenario is bullish as long as BTCUSDT holds above the 86,000 support zone. The recent pullback appears corrective within the broader recovery structure. I expect price to continue higher toward the range high and resistance zone around 90,300.
Therefore, a clean breakout and acceptance above this resistance would confirm bullish continuation and open the path for further upside expansion. However, a sustained breakdown below the support zone would invalidate the bullish setup and increase the risk of a deeper move lower. For now, structure and price behavior favor buyers while support remains intact.
That's the setup I'm tracking. Thank you for your attention, and always manage your risk.

After Intense Selling Pressure, Bitcoin Starts to StabilizeHello, Camila here!
Observing the chart at the current moment, Bitcoin remains in a short-term downtrend. Price has gone through a strong and decisive sell-off, and after being firmly rejected at a key resistance zone, the market has started to move sideways and consolidate, showing early signs of stabilization.
If buyers are able to defend the current accumulation area and gradually push price higher, the next reasonable target would be the Fibonacci retracement zone at 0.5–0.618, corresponding to the 107,000–109,000 area. This is a key zone where sell orders are likely waiting, and the market may show a clear reaction there.
Wishing you all successful trading!

Gold 1H – Smart Money Traps Form Near 4540–4450 Range🟡 XAUUSD – Intraday Smart Money Plan | by Ryan_TitanTrader (23/12)
📈 Market Context
Gold remains structurally bullish on the higher timeframes, but price is now trading inside a compression zone after a clear impulsive expansion. With year-end liquidity thinning and traders positioning ahead of fresh Fed rate expectations and USD yield fluctuations, Gold is vulnerable to liquidity manipulation rather than clean continuation.
Recent USD softness and mixed macro headlines keep Gold supported, yet extended pricing near highs increases the probability of stop hunts on both sides before the next decisive move.
Smart Money behavior here favors range engineering — drawing in breakout traders above highs and shaking out impatient longs below key demand — before revealing true intent.
🔎 Technical Framework – Smart Money Structure (1H)
Current Phase: Bullish HTF structure with short-term distribution
Key Idea: Expect liquidity interaction at premium (4540–4542) or discount (4450–4448) before displacement
Structural Notes:
• Higher-timeframe bullish BOS remains intact
• Recent CHoCH signals short-term distribution risk
• Price is trading in premium, extended from equilibrium
• Clear impulsive leg left unmitigated inefficiencies below
• A defined scalping range has formed between premium and discount
• Liquidity rests clearly above 4540 and below 4450
Liquidity Zones & Triggers:
• 🔴 SELL GOLD 4540 – 4542 | SL 4560
• 🟢 BUY GOLD 4450 – 4448 | SL 4440
🧠 Institutional Flow Expectation:
Liquidity sweep → MSS / CHoCH → BOS → displacement → FVG / OB retest → expansion
🎯 Execution Rules (matching your exact zones)
🔴 SELL GOLD 4540 – 4542 | SL 4560
Rules:
✔ Sweep above premium buy-side liquidity
✔ Bearish MSS / CHoCH on M5–M15
✔ Clear downside BOS with impulsive displacement
✔ Entry via bearish FVG refill or refined supply OB
Targets:
1. 4510
2. 4485
3. 4450 – extension if USD strengthens or yields push higher
🟢 BUY GOLD 4450 – 4448 | SL 4440
Rules:
✔ Liquidity grab into discount and prior demand
✔ Bullish MSS / CHoCH confirms demand control
✔ Upside BOS with strong bullish displacement
✔ Entry via bullish FVG fill or demand OB retest
Targets:
1. 4480
2. 4510
3. 4540 – extension if USD weakens and bullish flow resumes
⚠️ Risk Notes
• Premium trading increases fake breakout probability
• No entry without MSS + BOS confirmation
• Expect volatility during U.S. session and thin year-end liquidity
• Reduce risk around Fed-driven or USD yield headlines
📍 Summary
Gold is still bullish by structure, but current price action signals liquidity games inside a defined range. Smart Money is likely to engineer stops before expansion:
• A sweep above 4540 may fade back toward 4485–4450, or
• A liquidity grab near 4450 could reload longs toward 4510–4540+
Let price show intent — Smart Money waits, retail reacts. ⚡️
📌 Follow @Ryan_TitanTrader for daily Smart Money gold breakdowns.

XAUUSD: Bullish Trend Holds FirmLooking at the XAUUSD H3 chart at the current moment, I can clearly see that the bullish trend remains well intact. The previous upward moves were not random but supported by active buying flow, as reflected in the market’s ability to consistently maintain higher highs and higher lows. After each pullback, price has quickly found support, indicating that selling pressure is not strong enough to alter the broader market direction.
From my perspective, this behavior signals a healthy trend that is temporarily slowing down to rebalance. As long as the current support zone continues to hold, I still favor the scenario of gold extending its upside move. At this stage, the appropriate approach is to remain patient, wait for price confirmation around key support areas, and continue trading in line with the prevailing trend, rather than chasing short-term price fluctuations.

Novo Nordisk (NVO) 1WI’m looking at the weekly NVO chart as of late December 2025, and this is no longer about fear or headlines. It’s about structure and valuation. After a powerful multi year rally from 2022 to 2024, the stock went through a deep and healthy correction. In 2025, price built a strong weekly demand base around the 50–55 USD area, where volume profile, historical support and long term buyers align. Selling pressure is fading, volatility is compressing, and price action is stabilizing.
Technically, NVO is transitioning into a post correction accumulation phase. On the weekly timeframe, RSI has recovered from oversold territory and is holding a neutral bullish range. MACD is forming a constructive reversal structure, while declining volume on down moves suggests exhaustion rather than distribution. As long as price holds the weekly base and does not break lower, the recovery scenario remains valid, with upside reference zones near 72–75 USD and later 90–92 USD if momentum confirms.
From a fundamental perspective, as of the end of 2025, Novo Nordisk remains one of the highest quality businesses in global healthcare. Revenue exceeds 39 billion USD, with the Diabetes and Obesity Care segment generating more than 85% of total sales, continuing to show resilient growth. The United States and Europe remain the core revenue drivers, while international markets continue to expand steadily.
Cash flow quality remains strong. Operating cash flow is above 18 billion USD on a TTM basis, free cash flow stays positive despite heavy investments into capacity expansion and R&D. Dividend policy remains disciplined and shareholder friendly, with TTM dividend yield around 2.3% and a payout ratio near 35–36%, leaving room for both reinvestment and future dividend growth.
What matters is that the 2025 correction did not come with any structural deterioration of the business. This was not a business breakdown, but a valuation reset after an extreme growth phase. Expectations have been normalized, multiples compressed, while fundamentals stayed intact. That’s where asymmetry begins to emerge.
Tactically, I see NVO as a long term quality compounder, where 2025 served as a reset year. As long as the weekly structure holds, the path for gradual upside remains open. This is not a short term trade, but a trend rebuilding phase driven by cash flow, market leadership and scale.
Sometimes the best opportunities appear not at peak optimism, but when the market has already done its emotional damage and the numbers are still standing.

SOL at a Critical Decision Zone – Double Bottom vs ResistanceHi!
Market Context
Solana is trading near a key decision zone after a corrective move from recent highs. Price action suggests short-term bullish attempts, but the broader structure remains mixed.
Technical Structure
Broken Trendline: The descending trendline from the recent high has been broken, indicating a short-term momentum shift.
Double Bottom Formation: A clear double bottom has formed near the $121–$122 area, showing strong buyer reaction and short-term demand.
Support Zone: The horizontal support around $120 remains critical. This level has been tested multiple times and is still holding.
Resistance & Scenarios
Bullish Scenario: If price holds above $120 and continues higher, a move toward the $125–$126 supply zone is likely. This area previously acted as resistance and may trigger selling pressure.
Bearish Scenario: Failure to sustain above current levels, followed by a breakdown below $120, would invalidate the double bottom and open the door for a deeper correction.
Conclusion
While short-term bullish signs are present, confirmation requires continuation above resistance. Until then, SOL remains in a sensitive zone where both scenarios are possible. Risk management is essential around these levels.

Gold Continues to Maintain Its Bullish Streak Into Year-EndHello everyone,
Today, OANDA:XAUUSD is taking a pause during the Christmas holiday period, currently trading around 4,479 USD. Although slightly lower than the previous session, gold continues to hold a strong high-price base after a powerful rally, driven by rising safe-haven flows, escalating geopolitical tensions, and expectations that the Fed may cut interest rates in 2026.
On the chart, price has broken out of the previous sideways range and formed a clear bullish structure. At the moment, gold is consolidating within the 4,450–4,525 range, with 4,520–4,525 acting as the nearest resistance (weak high)—a zone where liquidity may be drawn before the market commits to its next direction.
From a scenario perspective, as long as price holds above key support, any pullbacks are considered healthy, and the uptrend remains dominant. A decisive break above 4,525 could open the door toward 4,600 USD and beyond, especially if supportive factors such as low interest rates and ongoing geopolitical risks persist.
The preferred strategy at this stage remains buy-biased, focusing on patience, confirmation-based entries, trading in line with the trend, and avoiding FOMO.
What’s your view on the current XAUUSD trend? Feel free to leave a comment.
Wishing you a peaceful and joyful Christmas!

EURUSD H1 OutlookEURUSD H1 Outlook – Bullish Continuation While Holding 1.177 Support (Key Levels + Trade Plans)
EURUSD on the H1 chart is trading in a bullish continuation phase after a clean impulse leg from the 1.170 base. Price has transitioned into a tight consolidation under the recent highs, and the market is repeatedly defending the 1.176–1.177 area. This is typically the type of structure that precedes another leg higher, as long as buyers keep protecting the higher-low zone.
Today’s edge is simple: avoid chasing the middle of the range, focus on buying pullbacks into support, or trading a breakout with confirmation.
H1 Market Structure and Price Behavior
Trend: Higher highs and higher lows since the 1.170 swing base
Current phase: Range / re-accumulation under the highs
Key observation: Multiple reactions from 1.176 and 1.177 suggest demand absorption (buyers stepping in consistently)
Bias for today: Bullish while price holds above 1.176–1.177 on H1 closes.
Key Support and Resistance Levels (Intraday)
Support Zones (buy-side focus)
1.1770–1.1765: Primary intraday support (range base and “hold level”)
1.1760: Deeper pullback support (prior reaction low)
1.1700–1.1710: Major base support (trend foundation)
Resistance Zones (breakout triggers)
1.1795–1.1805: Immediate supply / prior swing top area
1.1820: First upside target zone if breakout holds
1.1840–1.1860: Extension zone if momentum accelerates
Fibonacci Confluence (Where the Dip Buyers Usually Win)
Anchor Fibonacci from the impulse low near 1.170 to the recent swing high (around the 1.180 area):
0.382 retracement often aligns with the 1.176–1.177 region
0.50 retracement tends to sit near the deeper pullback level (around 1.175–1.176 depending on the exact high)
That’s why the 1.176–1.177 area is the “decision zone” today: it’s both structural support and a common Fibonacci reload level.
EMA and RSI Filters (Execution Quality)
EMA (trend filter)
Bullish continuation is favored when price holds above the rising EMA cluster (commonly 20/50 EMA on H1)
Best long entries tend to occur when price taps EMA support and quickly reclaims the range with strong candles
RSI (momentum filter)
Continuation is healthier if RSI holds above 50 during pullbacks
If RSI slips and holds below 45 while price breaks 1.176, expect a deeper retracement toward 1.170
Trade Plans for Today (H1)
Plan A – Buy the Pullback at 1.176–1.177
Entry trigger:
Price dips into 1.176–1.177 and prints bullish rejection on H1
Optional confirmation: break back above the local consolidation high after the rejection
Invalidation:
H1 close below 1.176 with weak follow-through and RSI failing to recover
Targets:
TP1: 1.1795–1.1805
TP2: 1.1820
TP3: 1.1840–1.1860 (only if breakout is strong)
Plan B – Breakout Long Above 1.1805
Entry trigger:
H1 close above 1.1805
Retest 1.1800–1.1805 holding as support (preferred)
Stop logic:
Below the retest low (keep it technical, not emotional)
Targets:
1.1820 then 1.1840–1.1860
This plan is best if volatility increases and the market prints clear expansion candles, not slow grinding.
Plan C – Bearish Alternative Only If 1.176 Fails
If price breaks and holds below 1.176 on H1:
Look for a retest of 1.176–1.177 as resistance
Then the path opens toward 1.1720 and ultimately 1.1700–1.1710
Invalidation:
Strong reclaim back above 1.177 with RSI recovering above 50

BTCUSD Below a Downtrend Line: Don’t Rush to Trust the BounceBTCUSD is still trading in a bearish-leaning environment , as neither the news backdrop nor the technical structure supports a clear bullish reversal yet. Profit-taking from large players, combined with cautious year-end sentiment, means recent Bitcoin rebounds are more technical in nature rather than the start of a new uptrend. In a thin-liquidity environment, the market tends to favor selling rallies instead of chasing higher prices.
On the chart, price remains below the descending trendline and capped by the Ichimoku cloud, confirming that sellers continue to control the primary trend. Upside attempts have been shallow and quickly sold into, reflecting a lack of conviction from buyers. The 89,500 area stands out as a key resistance zone, where price has tested multiple times without a decisive breakout.
In the short term, the most reasonable scenario is for BTC to rebound into resistance and then weaken, before revisiting support around 86,800. A clean break below this level could open the door for further downside extension. Conversely, only a strong breakout and sustained hold above 89,500–90,000 would truly invalidate the current bearish structure.

EURUSD: Bullish Structure Holds Inside Upward ChannelHello everyone, here is my breakdown of the current EURUSD setup.
Market Analysis
EURUSD has confirmed a bullish structure after breaking out of the previous Downward Channel. This breakout shifted market control to buyers and initiated a steady move higher. Price is now trading within a well-defined Upward Channel, forming higher highs and higher lows, which supports the bullish trend.
Recently, EURUSD pulled back from the Resistance Zone near 1.1800 and found support around the 1.1750–1.1760 area. This zone aligns with the channel support and previous breakout structure, showing strong buyer interest. Current consolidation above support suggests continuation rather than reversal.
My Scenario & Strategy
My primary scenario remains bullish as long as EURUSD holds above the Support Zone around 1.1750. The recent pullback looks corrective within the broader uptrend. I expect price to resume its upward move and push toward the upper boundary of the Upward Channel, 1.1840 - 1.1850 as the next key target.
A clean breakout and acceptance above 1.1800 would confirm trend continuation and open the door for further upside expansion. However, a sustained breakdown below 1.1750 would weaken the bullish setup and could lead to a deeper correction. For now, the structure favors buyers, with support holding and momentum aligned with the prevailing uptrend.
That's the setup I'm tracking. Thank you for your attention, and always manage your risk.
