Novo Showing Bullish SignsHello everyone, happy Sunday. Today I am presenting my "cup and handle" bullish pattern on $NYSE:NVO. From a technical perspective, the stock has shown a typical cup pattern with resistance, and I expect a handle to soon form before a bullish continuation upwards. Currently in with 75 shares around
Key facts today
Next report date
—
Report period
—
EPS estimate
—
Revenue estimate
—
2.90USD
12.14 BUSD
33.70 BUSD
3.34 B
About NOVO NORDISK B A/S
Sector
CEO
Lars Fruergaard Jørgensen
Headquarters
Bagsværd
Website
Employees (FY)
63.37 K
Founded
1931
FIGI
BBG000BQBKR3
Novo Nordisk A/S is a global healthcare company, which engages in the discovery, development, manufacturing and marketing of pharmaceutical products. It operates through the Diabetes and Obesity Care, and Rare Disease segments. The Diabetes and Obesity Care segment includes diabetes, obesity, cardiovascular, and emerging therapy areas. The Rare Disease segment refers to rare blood disorders, rare endocrine disorders, and hormone replacement therapy. The company was founded by Harald Pedersen and Thorvald Pedersen in 1923 is headquartered in Bagsværd, Denmark.

$NVO Become a New Watch List?!NYSE:NVO is a new watchlist since it keeps forming a very good bullish structure.
Let's see where it goes.

Novo Nordisk's Wegovy Secures China Approval, Poised for Major MDanish pharmaceutical giant Novo Nordisk gains significant access with the approval of its weight-loss drug Wegovy in China. This move grants Novo Nordisk entry into the world's second-largest economy, targeting a growing population facing obesity challenges.
Key Considerations:
Wegovy target

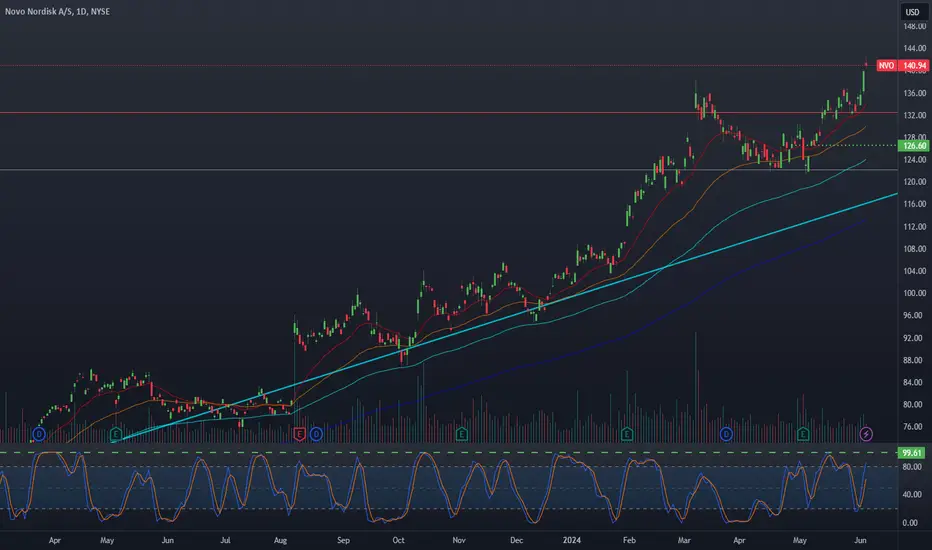
Update on NVO swingI charted my entry on the dotted green, I did go with calls for June 21st, I am debating closing them now before theta decay starts to really ramp up, but I still think we might hit 144-145$ in a few days the way this is going. The stochastic RSI still has room to run a few more days and the stock l
NVO: Super-Duper-To-GoFundamentals:
An insulin and diabetes drug care company based in Denmark. Booming fundamentals, booming funds, great cashflow, stable earnings and accelerating sales. Pays a little dividend.
Technicals:
Shallow pb
uHd
extreme indicator
34%-50% pb
a-b-c pb completion
horizonal support
kijun bounc

Novo Nordisk Stock Slipped 3.3% ThursdayNovo Nordisk ( NYSE:NVO ) stands as a beacon of innovation, continually pushing boundaries in the treatment of diabetes and obesity. However, despite its recent successes, the company finds itself navigating the delicate balance between bullish growth projections and meeting market expectations.
Th

BUY Novo NordiskHello everybody
I think NVO is long in long time It is your responsibility to check and tade with yourself This analysis has an educational aspect .
Dont go into details and short timeframe
Trade with your little money and Invest with your big money
Good Luck

NOVO NORDISK: 2 ways, statistically one is more probable We can keep climbing if the price will go back to the top before 14th may, otherwise...

Novo Nordisk A/S (NVO) as of 7th March 2024.Novo Nordisk A/S (NVO) has exhibited a robust upward trajectory over the preceding quarter, as indicated by the persistent development within the bullish Ichimoku Cloud. A closer inspection of the technical facets as of March 7th, 2024, suggests a consolidation phase nearing culmination, with potent

NOVO NORDISK on the 1D MA50 starts looking a buy again.Novo Nordisk (NVO) hit the 1D MA50 (blue trend-line) again for the first time since December 18 2023 and after a long time it gives buy signals again. The correction came after the March 07 rejected at the top of the (dotted) Channel Up, following overbought 1D RSI levels before that for 2 weeks.
T

See all ideas
An aggregate view of professional's ratings.
Trade directly on the supercharts through our supported, fully-verified and user-reviewed brokers.


Curated watchlists where NVO is featured.

