Bitcoin’s Next Move Starts Here Key Levels MappedBTC is currently in a technically critical phase. Price is trading below a major dynamic trendline resistance after a confirmed bearish break, keeping the broader structure corrective rather than impulsive. Momentum remains capped unless bulls reclaim key dynamic levels.
The plan from here is straightforward and scenario-based:
A. If price retraces into the Immediate Dynamic Trendline (IDT) and gets rejected again, that rejection becomes a high-probability short trigger. In that case, downside continuation toward the Demand Pool Zone (DPZ) is expected to complete leg 5 of the corrective wave. This zone is where I would anticipate strong accumulation and a relief rally, targeting a move back into the Supply Pool Zone (SPZ).
B. Alternatively, if BTC breaks and holds above the IDT, momentum should accelerate to the upside, with the Supply Pool Zone remaining the primary upside target, exactly as mapped on the chart.
What happens at the Supply Pool is decisive. If bulls fail to hold price and we see a strong rejection, that would confirm distribution and could trigger a complete bearish expansion, opening the door to much deeper targets, potentially toward the $50k region.
Market is at a decision point.
Are you bullish or bearish from here?
Let’s discuss your view
Community ideas

You Don’t Lose by Being Wrong — You Lose by OveranalyzingYour problem isn’t that you don’t understand the market.
In fact, most losing traders understand the market fairly well. They know what a trend is, where key levels sit, and which side the structure is leaning toward. But when it’s time to make a decision, they sabotage that edge with something very familiar: just a little more analysis.
At first, everything is clear. The chart tells a simple story.
Then doubt creeps in. You zoom into another timeframe. Add another zone. Add another tool. Not because the market demands it, but because you’re not ready to accept the risk of a decision. And with every extra layer of analysis, you don’t gain more certainty — you create another narrative.
This is the key point many traders miss:
the market hasn’t changed — the story in your head has.
When you overanalyze, you’re no longer reading the market; you’re negotiating with yourself. One timeframe says buy, another says wait. One level looks valid, another suddenly looks dangerous. In the end, you’re no longer searching for a good opportunity — you’re searching for reasons to delay or reverse a decision. And by the time you enter, you’re either late or lacking conviction.
Overanalysis also destroys your sense of informational weight.
On a chart, not all data carries equal value. A price level in the right context is worth more than ten minor signals. But when everything is marked, everything looks “important,” and you lose sight of what’s actually worth risking money on. The market needs prioritization, not enumeration.
Here’s an uncomfortable truth:
Many traders overanalyze not because they’re curious, but because they’re afraid to commit. They fear being wrong, so they look for more confirmation. But the market doesn’t reward the trader with the most confirmations. It rewards the trader who accepts risk at the right location. Every time you delay a decision through analysis, you move yourself further away from that location.
I only started trading better when I realized this:
analysis is not meant to make decisions certain — it’s meant to make them reasonable.
Beyond that point, what matters is discipline and acceptance of outcomes. The market doesn’t require you to be right 100% of the time. It only requires that you don’t break your own structure.
If you often find yourself “right on direction but wrong on results,” try cutting back on analysis. Not to oversimplify the market, but to clarify what truly matters. When the picture is already clear, adding detail doesn’t make it better — it just makes you hesitate.
And in trading, hesitation is often more expensive than being wrong.

Market Panic: Gold or Crypto?When the market enters a state of panic, the question is no longer “How much profit can I make?” but rather “Which asset helps me survive and protect my capital?”
In moments like these, gold and crypto are often placed side by side. Both are seen as safe havens—but in very different ways, and that difference is the key to making the right decision.
1) Gold – Where Capital Flows When Confidence Breaks
Gold has existed for thousands of years with one core purpose: preserving value.
When inflation rises, geopolitical tensions escalate, or the financial system shows signs of stress, large capital tends to move into gold first.
Why gold performs well during crises:
High global liquidity, accepted across all markets
Relatively “orderly” volatility, suitable for defensive positioning
Often benefits when real interest rates fall and the USD weakens
In other words, gold won’t make you rich overnight, but it helps you avoid being washed away when the storm hits.
2) Crypto – An Asset Driven by Expectations and Emotion
Crypto represents a new generation of assets, where value is heavily influenced by future expectations, technology narratives, and speculative capital.
In normal or euphoric market conditions, crypto can rise very quickly.
But when panic sets in, the story changes.
Here’s the reality we need to face:
Crypto reacts extremely sensitively to “risk-off” sentiment
High leverage + thin liquidity during stress periods can trigger chain liquidations
In major shocks, crypto is often sold alongside growth stocks, rather than acting as a true safe haven
Therefore, crypto is not a defensive asset in the traditional sense—it is an asset of belief and market cycles.
3) When Should You Choose Gold? When Should You Hold Crypto?
The answer is not “which is better,” but what the market context is.
True panic (systemic risk, war, financial crisis):
➡ Gold is usually the preferred choice.
Capital seeks certainty, not stories.
Short-term crisis followed by monetary easing:
➡ Gold often leads the first wave,
➡ Crypto tends to recover more aggressively after a psychological bottom forms.
Stable markets with abundant liquidity:
➡ Crypto performs at its best.
4) My Perspective: Don’t Choose with Emotion
From my experience, the biggest mistake traders make during panic is choosing assets based on personal belief instead of capital flow and market behavior.
A professional trader asks:
Where is large capital taking refuge?
Is current volatility suitable for my trading style?
Is my goal capital preservation or outsized returns?
If your priority is safety and stability, gold is usually the more reasonable choice.
If you accept high risk in pursuit of high reward, crypto should only be approached after clear confirmation, not during extreme panic.

BTCUSDTHello Traders! 👋
What are your thoughts on Bitcoin?
Bitcoin has entered a corrective phase after a strong bearish move and is currently ranging between a clearly defined support and resistance zone. As long as price remains inside this range, no major directional move is expected.
At the moment, price is expected to move toward the upper boundary of the range. Once this area is reached, price behavior should be closely monitored for confirmation.
Bullish case:
If price breaks and holds above the range high, the next upside targets marked on the chart will come into play.
Bearish case:
If price gets rejected from the range high and the lower boundary of the range is broken, bearish continuation is likely, with the next downside target around 73,000.
⚠️ Until a clear breakout occurs, the market remains in a consolidation phase
Please Don’t forget to like and share your thoughts in the comments! ❤️

BITCOIN - Manipulation and liquidity hunting before the crash BINANCE:BTCUSDT.P is stuck in the range of 85K - 90K. There is no liquidity in the market, but at the same time, the downward trend continues...
Earlier, we discussed such a nuance as the breakdown of support for the upward local trend. The global trend is bearish, and this nuance generally indicates a weak market. In addition to this, there is no liquidity in the market: there has been no inflow of funds into the cryptocurrency market in the last few weeks, hence the current manipulations that have been taking place over the last few days. (A low-liquidity instrument is easy to control...)
Technically, Bitcoin is within the trading range of 85,000-89,400, which is formed after the breakout of the support of the upward channel, i.e., in the short zone. A retest of 89-90K could lead to a short squeeze and a fall.
Resistance levels: 89,400, 89,900, 90,600
Support levels: 85,000, 83,800
A short squeeze and liquidity capture relative to the specified resistance zone could trigger a further decline, provided that bears keep the market near the previously broken boundary of the upward line...
Sincerely, R. Linda!

Spx lowerI'm in the hospital and using the app to trade. Hopefully I'll be out of here today or tomorrow.
I think it's a short from here 10:05 Eastern. If they continue rallying the rest of today, I'm wrong. From here we should test and possible break the lows.
Good luck 🤞

BTC – Weak Rebound Below EMAs, Bias Still Toward CorrectionHello everyone, Domic here.
Looking at BTC on the H4 timeframe right now, the overall feeling is not panic — but there is certainly nothing reassuring either. Price is trading around 85,700 USD, sitting firmly below both the EMA34 and EMA89, and that alone already says a lot about the current market condition.
Since mid-month, a lower high – lower low structure has become fairly clear. The rebound we are seeing at the moment is essentially just a technical pullback after the prior sharp sell-off, as price attempts to climb back up and retest resistance. However, BTC has still failed to reclaim the EMA34, which shows that buying pressure is not strong enough to regain short-term control. At this stage, EMA34 acts as an overhead pressure ceiling, while EMA89 remains the key boundary defining the H4 trend. As long as price stays below both of these moving averages, the market should still be viewed from a defensive perspective.
On the macro and news side, BTC is not being driven by any crypto-specific shock, but rather by broader macro conditions and the risk-on / risk-off environment. The Fed continues to signal higher rates for longer, making it difficult for risk assets to attract fresh inflows. US Treasury yields remain elevated, pushing short-term capital toward the USD and bonds instead of crypto. US equities are undergoing a mild correction, and BTC, at this stage, is still moving quite in sync with the broader risk asset complex. In addition, inflows into spot Bitcoin ETFs have cooled significantly compared to the earlier surge, further weakening the price support.
From my perspective, as long as BTC remains below the EMA34, any upward move should still be treated as a rebound into resistance. And while price stays below the EMA89, the H4 trend remains in a corrective state.

GBPUSD - Relief Rally Into Resistance? Sellers Watching Closely📉GBPUSD remains overall bearish on the higher timeframe. Price is still trading within a descending structure, and the broader trend continues to favor sellers rather than buyers.
The recent upside move is best viewed as a corrective bounce, not a trend reversal. Price is now approaching a key confluence zone, where the former structure, horizontal resistance, and the descending trendline align.
This is the type of location where trend-following shorts become interesting. I’m not interested in selling blindly, but rather in waiting for lower-timeframe bearish confirmation once price reacts at this resistance zone.
⚔️As long as price remains below the descending trendline and fails to reclaim the range above, the bearish bias stays intact. A clean break and hold above this resistance would be the only thing that forces a reassessment.
For now, this looks like sellers getting another chance at a better price.
Will this resistance cap the move once again, or do bulls finally break the structure? 🤔
⚠️ Disclaimer: This is not financial advice. Always do your own research and manage risk properly.
📚 Stick to your trading plan regarding entries, risk, and management.
Good luck! 🍀
All Strategies Are Good; If Managed Properly!
~Richard Nasr

$USDT Dominance Is it really different this time?CRYPTOCAP:USDT has broken a major resistance across multiple timeframes, showing clear strength.
Technically, this is not a positive sign for CRYPTOCAP:BTC and other altcoins.
Tether has been in an uptrend for the last 75 days. A reversal could be around the corner in Q1 2025, but for now, the structure does not favour the bulls.
This is not FUD; it's simply clear observations based on the chart.
There has been no major altcoin season this year. Every KOL, including myself, has been wrong in calling an altseason so far.
Is it really different this time?
Only time will tell.
Do share your views in the comments and hit the like button if you like it.
Thank you
#PEACE

How to Stop Guessing and Start Trading with IntentThe Psychology Behind Trading Decisions
Estimates suggest that only about 5% of human brain activity is conscious . The remaining 95% operates at a subconscious level — outside our direct control and awareness. If this is true, then in trading, most decisions are also made unconsciously.
As Somerset Maugham once said:
“ Money is a sixth sense — without it, you cannot fully use the other five. ”
Money goes far beyond being a simple medium of exchange. It becomes an emotional and psychological factor that directly affects our sense of security, freedom, and control .
Investing and trading are among the few fields where participants work directly with money for the purpose of increasing it . And this is exactly where the trap lies — one that almost all beginners, and even experienced traders, fall into.
Why Trading Is Psychologically Different from Business
When the object of activity is not a product, not a service, and not a process, but money itself , the psyche begins to respond differently.
Consider a motherboard manufacturer. Their activity generates income only after the product is sold. There is always distance between the action and the money :
development
production
logistics
marketing
distribution
time
Profit in such a business is the result of a well-built system , not the outcome of each individual action.
In trading and investing, this distance disappears.
Money is no longer the result — it becomes the direct object of work.
Every decision is instantly reflected in the account balance
Every mistake becomes an immediate loss
Every winning trade delivers instant emotional reward
At this point, money ceases to be a neutral tool and turns into a psychological trigger .
How the Market Hijacks Decision-Making
Fear of loss intensifies.
Greed increases.
Decision-making accelerates.
Choices are no longer driven by logic, but by automatic reactions :
fear of loss
greed
the need to be right
the urge to quickly recover losses
The market constantly provokes these reactions. Without structure, a trader begins to act impulsively — even while believing that everything has been “ carefully thought through .”
The Illusion of Rationality
A sense of rational process emerges:
the chart is analyzed
arguments for entry are found
exit levels are reconsidered
Yet without pre-defined rules , these actions are not logic. They are attempts to justify a decision made under the influence of the moment.
Trading turns into a sequence of chaotic market decisions:
mental pressure builds
motivation fades
fatigue sets in
internal tension accumulates
Each new trade begins to feel like a way to “ fix ” the previous one.
In such an environment, the trader stops managing risk and starts being managed by emotions .
An illusion of control appears:
just a bit more analysis, one more argument — and the market has to respond correctly.
If this sounds familiar, you know the feeling.
Why Most Losses Actually Happen
Most losses occur not because of poor analysis, but because the plan was not fixed before entry .
When trade management is no longer handled by a strategy, it is taken over by the psyche.
And the psyche cannot work with probabilities — it can only:
avoid pain
seek pleasure
Where Logical Trading Begins
Logical trading begins where the subconscious has nothing left to decide .
All key questions are answered in advance:
What is a valid trigger and confirmation for entry?
When and how will I exit?
How do I interpret mistakes?
Under what conditions do I not trade?
How is risk managed?
At the moment of execution, the trader does not think — he executes .
And the fewer decisions that must be made while in a position, the lower the chance that those decisions will be driven by fear or hope .
The Role of a Trading Strategy
So how can this be achieved?
The answer is a trading strategy.
A trading strategy is not :
a set of indicators
a “favorite setup”
A trading strategy is a formalized logic of actions that exists before entering the market.
It answers all key questions in advance and leaves no room for improvisation at the moment when pressure is highest.
Crucially, the strategy must be documented — not only in your head, but on paper or in digital form — so the market has no chance to confuse you.
What a Solid Trading Strategy Defines
A complete strategy clearly specifies:
which method of analysis is used
under what market conditions trading makes sense
how a trade idea is formed
what time of day trading is conducted
which analytical tools are used and how they are interpreted
where the trade idea is proven wrong
specifics of trading different assets
how risk and position size are calculated
how the trade is managed after entry
how mistakes are reviewed and analyzed
A strategy is not something you “feel”
If it can be changed during the trade — it is not a strategy
Strategy vs. Losses
It is important to understand:
A strategy does not eliminate losses. It eliminates chaos.
A loss within a strategy is a planned expense , not a mistake.
A mistake is a rule violation driven by emotion .
When a strategy is clearly defined and tested, the trader’s role is reduced to execution .
At this point:
you stop “feeling the market”
you start working with probabilities
A single trade no longer matters.
What matters is the series , the statistics , the long run .
That is why professionals think not in terms of profit or loss, but in terms of process .
Final Thought
A trading strategy takes over the 95% of decisions that were previously made subconsciously.
The trader is left with only one task:
Follow the system..
Enjoy!

XAUUSD Short: Supply Zone Holds - Gold Slips Into CorrectionHello traders! Here’s a clear technical breakdown of XAUUSD (Gold) based on the current chart structure. Gold is still trading within a broader ascending trend, supported by a well-defined rising trend line from the pivot point. The market previously made an impulsive bullish move, but price has now reached a major Supply Zone around 4,350, where strong selling pressure emerged. This area has already produced a fake breakout, clearly signaling buyer exhaustion and the presence of aggressive sellers at higher levels. At the highs, price action shows hesitation and rejection inside the supply zone, indicating that bullish momentum is weakening rather than continuing. After the fake breakout, gold started to roll over, suggesting that the recent move was a liquidity grab rather than true continuation.
Currently, price is pulling back toward the 4,260 Demand Zone, which also aligns with the rising trend line and a previous breakout area. This zone represents the first key downside target and a critical decision area for the market. The move lower appears impulsive, supporting the idea of a corrective phase turning into a deeper pullback.
My scenario: as long as XAUUSD remains below the 4,350 Supply Zone, the short-term bias favors sellers. I expect continuation to the downside toward the 4,260 Demand Zone. A clean breakdown below this level would signal a loss of bullish structure and open the door for a deeper correction. However, a strong bullish reaction from demand could lead to consolidation or a temporary bounce. For now, the structure favors a short-term bearish correction, with 4,350 as key resistance and 4,260 as the main downside target. Manage your risk!

Rambling off about Mitsubishi Heavy IndustriesAs you can see by the title of this idea it will be me writing about a company i think is interesting. It might end up being a lengthy read but I don't know how much I will manage to write before I get bored or covered all the topics I think are important from an investors point of view because I want to try and stay on topic when I write my ideas as best I can. Don't think that this is some kind of trading advice because its not, actually it makes me upset when people ask me to tell them if I think the price of a stock or index will go up or down. I can say that I wouldn't buy it if I didn't think it would go up, but I don't know when it will go up.
Looking at the valuation of the stock first, it appears to be quite overvalued and I'm going to hold off on buying it for awhile. There's a few reasons why I am going to wait to buy it, the first reason actually is because I only wanted to allocated 1 or 2 percent of my portfolio to the stock and for some reason right now it is prohibited to open a new position on the depository receipts. I would already start buying the stock if this was not the case but there's nothing I can do except wait for the trading permission to be available again. Like I said the stock is also very overvalued right now, there's really not any realistic room for upside in the near future. Granted that would not have stopped me from buying it, I probably would have still bought it if the OTC exchange would have allowed me because I just want to own the stock and price is not the most important thing to me when making these decisions.
I have started expanding my knowledge beyond most conventional ideas and have made my way into the Japanese stock market. Since I worked in the industries for a majority of my life I can't help but find the Japanese stock market incredibly interesting to me. I feel like a lot of the companies are major industrial entities in the world, I think most people might overlook the importance of some of the companies that trade on the Tokyo stock exchange. Mitsubishi Group is actually a vast conglomerate company which expands across hundreds of companies. Mitsubishi Heavy Industries is responsible for managing its business operations in sectors like aerospace, defense, energy and heavy machinery, which also happen to align with my personal preference of companies that I like to invest in.
As you can see I have added some photos to my idea and I'm not trying to offend anyone when I posted photos of airplanes but this is one of the core business operations of the company and I have to say what I want to. That being said I also added some other photos of Mitsubishi products. The company is famously an engineering company at its core, I don't want to write too much about the history of the company even though I probably can dedicated several paragraphs to just that.
I am going off topic a little bit here so I am going to go back on topic and now write about some of the ways Mitsubishi Heavy Industries uses capital in their business. This is a key element for every investor to pay attention to when deciding whether they will buy shares of a stock or not. Since the company is a conglomerate it will be pretty straight forward, there's really nothing special about how they utilize capital, pretty much the same as other conglomerate companies. I wrote an idea about Berkshire Hathaway some time ago and I think that is a text book example of how an ideal conglomerate company would want to utilize capital. Mitsubishi is a little different though because they are actually an industrial company and not a financial company like Berkshire. So its like comparing apples to oranges essentially.
It would be safe to assume the business model for Mitsubishi Heavy Industries is so incredibly complicated and need I say, unpredictable but I would also use words like reliable or necessary. Since I worked in heavy industries for along time I know it well and its easy for me to interpret the things I think will make the company money over a long period of time. I am starting to feel like it would make me bored to try and write about the specific elements of capital allocation now. In all seriousness I really just like the company and that's why I decided to write this idea today. I will probably keep exploring the Japanese stock market and might come up with more random ideas to share.

XAU Near All-Time Highs Bullish Continuation or Fake Breakout?Hello and respect to all TradingView followers 🙌
Hope you’re having profitable trades and disciplined risk management 📊💚
🟡 Gold Market Overview (XAUUSD)
Gold has always been considered a safe-haven asset, especially during periods of economic uncertainty, inflationary pressure, and geopolitical tensions.
Recently, gold has maintained a strong bullish structure across all timeframes, attracting both long-term investors and short-term traders 📈
At the moment, price is very close to its All-Time High (ATH). However, a new historical high has not been confirmed yet, making this zone extremely critical and decision-making for the market ⚠️
📊 Technical Analysis
🔼 Bullish Scenario
Overall market structure remains bullish on all timeframes
Price is holding above dynamic support (ascending trendline)
If price breaks and firmly closes above the ATH resistance, we can expect:
Continuation of the bullish trend
Formation of new All-Time Highs
Entry into price discovery mode 🚀
📌 Key confirmation: strong candle close above resistance + sustained momentum
🔽 Bearish (Corrective) Scenario
Despite the bullish trend, momentum weakness is visible near the ATH zone
If price fails to break the resistance and we see:
Rejection from resistance
Or a fake breakout
then a healthy correction becomes likely
Potential downside targets:
Nearest static support zones
And in a deeper pullback, the dynamic support (ascending trendline)
🔹 Such a move would be considered a normal correction within a larger bullish trend, not a trend reversal 🔄
🧠 Summary
Overall trend: Bullish
Current price location: Near All-Time High
Market condition: Sensitive zone + momentum weakness
Trading approach: Wait for confirmation — breakout or rejection
⚠️ Disclaimer
This analysis is for educational purposes only and not financial advice.
Always manage your risk properly and follow your own trading plan 💼📉
📣 Poll Question
❓ Do you think gold will successfully print new All-Time Highs?
🔘 Yes, after a confirmed breakout
🔘 No, a deeper correction comes first
Share your thoughts in the comments 👇👇
🏷️ Tags
#Gold #XAUUSD #TechnicalAnalysis #PriceAction
#SupportResistance #ATH #TradingView
#Forex #Commodities #SmartMoney
#BullishTrend #MarketStructure #TradingPsychology 💹
XAUUSD Near All-Time Highs Bullish Continuation or Fake Breakout?

Gold 1H – CPI Data Uncertainty Fuels Liquidity Traps at Extremes🟡 XAUUSD – Intraday Smart Money Plan | by Ryan_TitanTrader (19/12)
📈 Market Context
Gold is trading in a tightly engineered range as markets digest the latest U.S. CPI print, which has drawn caution from economists over data reliability and seasonal distortions.
Despite headline inflation showing signs of cooling, analysts warn the data lacks clarity, keeping the Fed firmly data-dependent and USD flows unstable.
This uncertainty-driven backdrop favors liquidity manipulation over clean trends, with Smart Money likely probing both premium and discount zones to trigger stops before committing to expansion.
🔎 Technical Framework – Smart Money Structure (1H)
Current Phase: Rising structure losing momentum near premium supply
Key Idea: Expect liquidity interaction at 4363–4365 (premium) or 4300–4298 (discount) before displacement
Structural Notes:
• Higher-timeframe bullish BOS remains valid but is pausing
• Multiple rejections near highs suggest distribution, not confirmed reversal
• Equal highs above 4360 and sell-side liquidity below 4300 are exposed
• Price is rotating inside a controlled liquidity channel
Liquidity Zones & Triggers:
• 🔴 SELL GOLD 4363 – 4365 | SL 4370
• 🟢 BUY GOLD 4300 – 4298 | SL 4290
Institutional Flow Expectation:
liquidity sweep → MSS / CHoCH → BOS → displacement → FVG / OB retest → expansion
🎯 Execution Rules (matching your exact zones)
🔴 SELL GOLD 4363 – 4365 | SL 4370
Rules:
✔ Sweep above recent equal highs into premium
✔ Bearish MSS / CHoCH on M5–M15
✔ Clear downside BOS with impulsive displacement
✔ Entry via bearish FVG refill or refined supply OB
Targets:
1. 4340
2. 4320
3. 4302 – extension if USD firms post-CPI reassessment
🟢 BUY GOLD 4300 – 4298 | SL 4290
Rules:
✔ Liquidity grab below sell-side lows / channel support
✔ Bullish MSS / CHoCH confirms demand control
✔ Upside BOS with strong bullish displacement
✔ Entry via bullish FVG fill or demand OB retest
Targets:
1. 4325
2. 4350
3. 4380 – extension if CPI skepticism weakens USD
⚠️ Risk Notes
• CPI-related uncertainty increases fake breaks — wait for structure
• No entry without MSS + BOS confirmation
• Expect volatility during U.S. session
• Reduce risk near unscheduled Fed or inflation commentary
📍 Summary
Today’s gold setup is driven by CPI-driven uncertainty and Fed caution, creating prime conditions for liquidity engineering:
• A sweep above 4365 may fade toward 4300–4320
or
• A liquidity grab near 4300 could reload bullish flow toward 4350+
Let structure confirm — Smart Money reacts, retail anticipates. ⚡️
📌 Follow @Ryan_TitanTrader for daily Smart Money gold breakdowns.

GOLD Is Going Down! Sell!
Here is our detailed technical review for GOLD.
Time Frame: 1D
Current Trend: Bearish
Sentiment: Overbought (based on 7-period RSI)
Forecast: Bearish
The market is trading around a solid horizontal structure 4,340.66.
The above observations make me that the market will inevitably achieve 4,164.19 level.
P.S
We determine oversold/overbought condition with RSI indicator.
When it drops below 30 - the market is considered to be oversold.
When it bounces above 70 - the market is considered to be overbought.
Like and subscribe and comment my ideas if you enjoy them!

FCPO Important LevelFCPO has been falling for 4 consecutive months. The important level is 3700. If the 3700 level is broken, FCPO is likely to fall again to 3250. My expectation is that FCPO will continue to close the bearish candle of December 2025. The January 2026 candle will determine whether the price will continue to fall or rise.
Let's all pay attention to the 3700 level!

Gold vs Real Estate: Which Is Safer?Gold vs Real Estate: Which One Truly Keeps Your Money Safe in Uncertain Times?
When markets turn unstable, the first question that always comes up is: “ How do I keep my money safe ?”
Almost immediately, two familiar names are put on the scale: gold and real estate .
One is a globally recognized defensive asset.
The other is a tangible asset tied to land and long-term growth cycles.
But safety does not lie in the name of the asset — it lies in how you use it .
Safety does not mean “never going down”
Many people mistakenly believe that a safe asset is one that never declines in price. In reality, every asset goes through corrections .
True safety means:
When you need cash, can you actually convert it?
When markets deteriorate, can you withstand the psychological and cash-flow pressure?
When the cycle shifts, does that asset help you survive?
And this is exactly where gold and real estate begin to diverge.
Gold — safety through liquidity and defense
Gold is considered safe because it does not depend on a single economy . When inflation rises, crises emerge, or confidence in fiat currencies weakens, gold is often chosen as a safe haven.
Gold’s greatest strength is liquidity . It can be converted into cash almost instantly, nearly anywhere in the world. This makes gold an effective defensive tool during periods of strong market volatility.
However, gold does not generate cash flow . Its price can also move sideways for long periods, requiring patience and a capital-preservation mindset rather than a get-rich-quick mentality.
Real estate — safety through tangibility and long-term value
Real estate feels safe because it is tangible and familiar . The land remains. The property remains. Over the long term, real estate tends to appreciate alongside economic growth and urbanization.
In addition, real estate can generate rental income , something gold cannot offer. For investors with stable capital and no pressure to rotate funds quickly, this is a major advantage.
The trade-off, however, is low liquidity . When markets weaken or credit conditions tighten, selling property can take a long time. If leverage is involved, this so-called “safe asset” can quickly become a financial burden.
The core difference: time horizon and flexibility
Gold suits investors who value flexibility and fast response .
Real estate suits those with long-term vision, substantial capital, and the ability to endure cycles .
Gold helps you defend in the short to medium term .
Real estate helps you build wealth over the long term .
No asset replaces the other.
They differ only in their role within your financial strategy .

After the Win: When Ego Takes OverAfter the Win: When Ego Takes Over
“Losses hurt the account.
Wins test the mind.”
A good trade works.
The plan was followed.
The market respected your level.
And then something subtle happens.
Confidence rises.
Rules soften.
The next trade feels easier to take.
That’s not growth.
That’s ego quietly stepping in.
Why Wins Are Dangerous
A win rewards behavior — but it also rewards emotion.
The brain links profit with personal ability.
You start trusting yourself more than your process.
Thoughts begin to shift:
• “I’m in sync with the market.”
• “I can see it clearly now.”
• “This one will work too.”
This is how discipline slowly erodes.
Confidence vs Ego
Confidence is calm.
Ego is loud.
Confidence respects rules.
Ego bends them.
Confidence accepts uncertainty.
Ego assumes control.
The moment a trader feels “special,”
the market prepares a lesson.
The Common Pattern
Many traders lose money not after losses,
but after a strong winning trade.
Why?
• Position size increases
• Entries become aggressive
• Confirmation is skipped
• Patience disappears
The account doesn’t collapse immediately.
It leaks slowly.
How to Stay Grounded After a Win
• Treat wins like losses — review them
• Take a short pause after big profits
• Reset size to default
• Ask: “Did I follow process, or did I get lucky?”
Your edge is consistency, not confidence.
The market doesn’t punish success.
It punishes arrogance.
📘 Shared by @ChartIsMirror
Do you feel more disciplined after a win…
or more confident than your rules allow?

ICP — 99.96% Down From ATH | Generational Bottom FormationAfter nearly 5 years of continuous distribution and capitulation, ICP appears to have completed a full macro bear cycle. Price is ~99.96% down from ATH and has formed what looks like a final all-time low around $1.16, followed by prolonged sideways consolidation — a classic sign of seller exhaustion.
Time-based structure is key here: major crypto bottoms historically form 4–5 years post-launch, once early investors, VCs, and emissions are fully absorbed. ICP is now exactly in that window. Instead of continuing lower, price is compressing and ranging, suggesting accumulation rather than distribution.
The current range ($1.16–$6) represents a massive absorption zone. Failed rallies are expected at this stage and do not invalidate the bottom — the first impulse usually fails. A reclaim of the $3.3–$3.6 region would signal momentum shift, while a break above ~$6 would confirm a macro trend reversal.
With sentiment washed out and volatility compressed, risk/reward at these levels is asymmetrically bullish**. If history rhymes, 2026 aligns with a potential expansion phase following this multi-year base.

BTC at Premium Zone | Smart Money Eyes Lower Levels📝 Description
Market structure on M15 remains bearish within the higher-timeframe context, despite the recent bullish retracement. Price is now retracing into a premium zone, aligning with the H1 OTE (0.618–0.786) of the last bearish displacement, without any confirmed CHOCH + BOS combination to validate a bullish reversal.
________________________________________
📈 Signal / Analysis
Primary Bias: Bearish below 88,500–88,800
Short Setup (Preferred Scenario):
• Entry (Sell): 88,120
• Stop Loss: Above 88,500 (above H1 swing high)
• Take Profit 1 (TP1): 87,500
• Take Profit 2 (TP2): 86,900
• Take Profit 3 (TP3): 86,600
________________________________________
🎯 ICT & SMC Notes
• Price currently reacting inside H1 OTE (0.618–0.786)
• Clear Bearish Order Block (H1) acting as supply
• H4 Order Block below price remains unmitigated
• No valid CHOCH + BOS sequence confirming trend reversal
• RSI structure aligns with corrective pullback, not momentum expansion
________________________________________
🧩 Summary
The current price action represents a corrective retracement within a dominant bearish market structure. As long as BTC remains capped below the 88,500–89,000 premium resistance, continuation toward lower HTF liquidity pools is favored. Rejection from the current OTE zone strengthens the probability of a bearish expansion toward unmitigated H4 demand and order blocks.
________________________________________
🌍 Fundamental Notes / Sentiment
Recent signals around a potential Bank of Japan rate hike have added pressure to global risk assets. A tighter Japanese monetary policy strengthens the yen and reduces carry-trade liquidity, which historically impacts crypto and equities negatively. As yen-funded positions unwind, capital flows shift toward safety, limiting upside momentum in Bitcoin. In this environment, crypto remains vulnerable to downside moves unless global liquidity conditions ease or major risk-on catalysts emerge.
________________________________________
⚠️ Risk Disclosure
Trading involves substantial risk and may result in capital loss. This analysis is for educational purposes only and does not constitute financial advice. Always apply proper risk management, predefined stop-loss levels, and disciplined position sizing aligned with your trading plan.

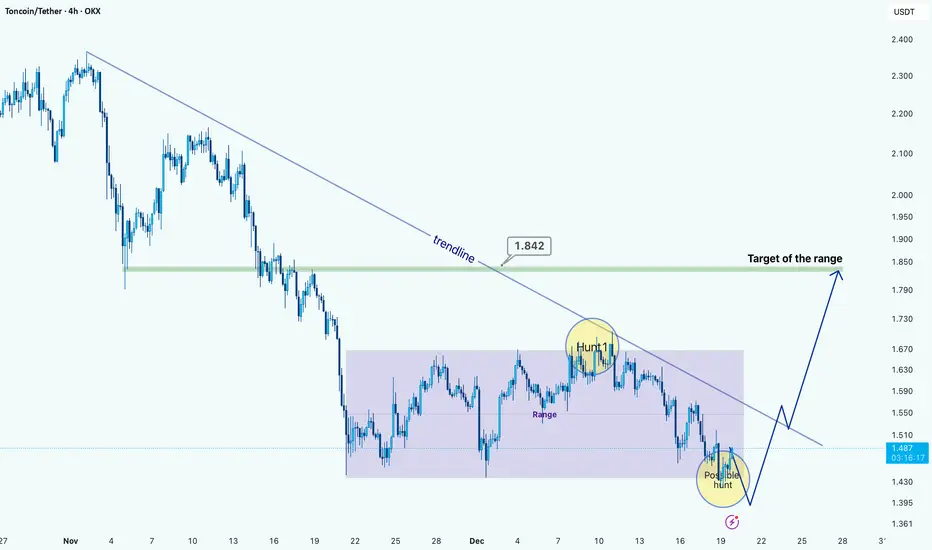
TON/USDT: Range Structure Within a Broader DowntrendHi!
TON is still trading under a well-defined descending trendline, confirming that the higher-timeframe structure remains bearish. After the impulsive sell-off, the price transitioned into a clear consolidation range, highlighted on the chart. This range shows multiple reactions at both extremes, validating it as an accumulation/distribution zone rather than random price action.
A notable liquidity hunt occurred near the upper boundary of the range, where price briefly swept highs and was immediately rejected, aligning with the descending trendline and reinforcing it as dynamic resistance. Currently, price is trading near the lower boundary of the range, where another potential liquidity sweep may occur before a directional move.
Bullish scenario: A downside sweep below the range lows, followed by strong acceptance back inside the range, could trigger a reversal toward the range high near 1.84, which also aligns with the descending trendline and acts as a logical target.
Bearish scenario: Failure to reclaim the range after a breakdown would confirm continuation of the downtrend, exposing lower supports.
DodgeCoin About to Hit Major Support Level - Whales Alert!Is this what they are waiting for? Whales expecting to buy Dodge at pennies? :) and pump it up again!
Main Reason is that, people are waiting and observe the market, This behaviour actuate the inactive behaviour of the Dodge and many other cryptos. Once there is none to minor trading activity / trading volume is present, then the market panic selling and crash happens. With selling market activity rises, but with the huge volumes are on short side, the value become more and more under the selling pressure. Then the long wait and no much gains, then the 2nd major selling wave, and loop happens until it hits a major support level.
Here we are waiting, just need to see some green light...
Then the waves of undervalued DodgeCoin, SOL to be more prominent and trending once again.
People are saying Dodge will hit below pennies, I think those are the people pump and dump news, once there is a dump, then the penni whales come-in and leave others in Jaw dropped state.....
Hold up people, buy when you can and be active on the network.
That's valid for any market...

Hey guys guess what !!! $BTC is strong !!!If we pump this we break out of a long down trend. If you look to the left we have a similar structure that broke out the same way.
Do you think we can see history repeat it self ?
Comment like and share for more charts.
(If you need me to draw something up for you comment bellow)
