You Don’t Lose by Being Wrong — You Lose by OveranalyzingYour problem isn’t that you don’t understand the market.
In fact, most losing traders understand the market fairly well. They know what a trend is, where key levels sit, and which side the structure is leaning toward. But when it’s time to make a decision, they sabotage that edge with something very familiar: just a little more analysis.
At first, everything is clear. The chart tells a simple story.
Then doubt creeps in. You zoom into another timeframe. Add another zone. Add another tool. Not because the market demands it, but because you’re not ready to accept the risk of a decision. And with every extra layer of analysis, you don’t gain more certainty — you create another narrative.
This is the key point many traders miss:
the market hasn’t changed — the story in your head has.
When you overanalyze, you’re no longer reading the market; you’re negotiating with yourself. One timeframe says buy, another says wait. One level looks valid, another suddenly looks dangerous. In the end, you’re no longer searching for a good opportunity — you’re searching for reasons to delay or reverse a decision. And by the time you enter, you’re either late or lacking conviction.
Overanalysis also destroys your sense of informational weight.
On a chart, not all data carries equal value. A price level in the right context is worth more than ten minor signals. But when everything is marked, everything looks “important,” and you lose sight of what’s actually worth risking money on. The market needs prioritization, not enumeration.
Here’s an uncomfortable truth:
Many traders overanalyze not because they’re curious, but because they’re afraid to commit. They fear being wrong, so they look for more confirmation. But the market doesn’t reward the trader with the most confirmations. It rewards the trader who accepts risk at the right location. Every time you delay a decision through analysis, you move yourself further away from that location.
I only started trading better when I realized this:
analysis is not meant to make decisions certain — it’s meant to make them reasonable.
Beyond that point, what matters is discipline and acceptance of outcomes. The market doesn’t require you to be right 100% of the time. It only requires that you don’t break your own structure.
If you often find yourself “right on direction but wrong on results,” try cutting back on analysis. Not to oversimplify the market, but to clarify what truly matters. When the picture is already clear, adding detail doesn’t make it better — it just makes you hesitate.
And in trading, hesitation is often more expensive than being wrong.
Community ideas

Market Panic: Gold or Crypto?When the market enters a state of panic, the question is no longer “How much profit can I make?” but rather “Which asset helps me survive and protect my capital?”
In moments like these, gold and crypto are often placed side by side. Both are seen as safe havens—but in very different ways, and that difference is the key to making the right decision.
1) Gold – Where Capital Flows When Confidence Breaks
Gold has existed for thousands of years with one core purpose: preserving value.
When inflation rises, geopolitical tensions escalate, or the financial system shows signs of stress, large capital tends to move into gold first.
Why gold performs well during crises:
High global liquidity, accepted across all markets
Relatively “orderly” volatility, suitable for defensive positioning
Often benefits when real interest rates fall and the USD weakens
In other words, gold won’t make you rich overnight, but it helps you avoid being washed away when the storm hits.
2) Crypto – An Asset Driven by Expectations and Emotion
Crypto represents a new generation of assets, where value is heavily influenced by future expectations, technology narratives, and speculative capital.
In normal or euphoric market conditions, crypto can rise very quickly.
But when panic sets in, the story changes.
Here’s the reality we need to face:
Crypto reacts extremely sensitively to “risk-off” sentiment
High leverage + thin liquidity during stress periods can trigger chain liquidations
In major shocks, crypto is often sold alongside growth stocks, rather than acting as a true safe haven
Therefore, crypto is not a defensive asset in the traditional sense—it is an asset of belief and market cycles.
3) When Should You Choose Gold? When Should You Hold Crypto?
The answer is not “which is better,” but what the market context is.
True panic (systemic risk, war, financial crisis):
➡ Gold is usually the preferred choice.
Capital seeks certainty, not stories.
Short-term crisis followed by monetary easing:
➡ Gold often leads the first wave,
➡ Crypto tends to recover more aggressively after a psychological bottom forms.
Stable markets with abundant liquidity:
➡ Crypto performs at its best.
4) My Perspective: Don’t Choose with Emotion
From my experience, the biggest mistake traders make during panic is choosing assets based on personal belief instead of capital flow and market behavior.
A professional trader asks:
Where is large capital taking refuge?
Is current volatility suitable for my trading style?
Is my goal capital preservation or outsized returns?
If your priority is safety and stability, gold is usually the more reasonable choice.
If you accept high risk in pursuit of high reward, crypto should only be approached after clear confirmation, not during extreme panic.

How to Stop Guessing and Start Trading with IntentThe Psychology Behind Trading Decisions
Estimates suggest that only about 5% of human brain activity is conscious . The remaining 95% operates at a subconscious level — outside our direct control and awareness. If this is true, then in trading, most decisions are also made unconsciously.
As Somerset Maugham once said:
“ Money is a sixth sense — without it, you cannot fully use the other five. ”
Money goes far beyond being a simple medium of exchange. It becomes an emotional and psychological factor that directly affects our sense of security, freedom, and control .
Investing and trading are among the few fields where participants work directly with money for the purpose of increasing it . And this is exactly where the trap lies — one that almost all beginners, and even experienced traders, fall into.
Why Trading Is Psychologically Different from Business
When the object of activity is not a product, not a service, and not a process, but money itself , the psyche begins to respond differently.
Consider a motherboard manufacturer. Their activity generates income only after the product is sold. There is always distance between the action and the money :
development
production
logistics
marketing
distribution
time
Profit in such a business is the result of a well-built system , not the outcome of each individual action.
In trading and investing, this distance disappears.
Money is no longer the result — it becomes the direct object of work.
Every decision is instantly reflected in the account balance
Every mistake becomes an immediate loss
Every winning trade delivers instant emotional reward
At this point, money ceases to be a neutral tool and turns into a psychological trigger .
How the Market Hijacks Decision-Making
Fear of loss intensifies.
Greed increases.
Decision-making accelerates.
Choices are no longer driven by logic, but by automatic reactions :
fear of loss
greed
the need to be right
the urge to quickly recover losses
The market constantly provokes these reactions. Without structure, a trader begins to act impulsively — even while believing that everything has been “ carefully thought through .”
The Illusion of Rationality
A sense of rational process emerges:
the chart is analyzed
arguments for entry are found
exit levels are reconsidered
Yet without pre-defined rules , these actions are not logic. They are attempts to justify a decision made under the influence of the moment.
Trading turns into a sequence of chaotic market decisions:
mental pressure builds
motivation fades
fatigue sets in
internal tension accumulates
Each new trade begins to feel like a way to “ fix ” the previous one.
In such an environment, the trader stops managing risk and starts being managed by emotions .
An illusion of control appears:
just a bit more analysis, one more argument — and the market has to respond correctly.
If this sounds familiar, you know the feeling.
Why Most Losses Actually Happen
Most losses occur not because of poor analysis, but because the plan was not fixed before entry .
When trade management is no longer handled by a strategy, it is taken over by the psyche.
And the psyche cannot work with probabilities — it can only:
avoid pain
seek pleasure
Where Logical Trading Begins
Logical trading begins where the subconscious has nothing left to decide .
All key questions are answered in advance:
What is a valid trigger and confirmation for entry?
When and how will I exit?
How do I interpret mistakes?
Under what conditions do I not trade?
How is risk managed?
At the moment of execution, the trader does not think — he executes .
And the fewer decisions that must be made while in a position, the lower the chance that those decisions will be driven by fear or hope .
The Role of a Trading Strategy
So how can this be achieved?
The answer is a trading strategy.
A trading strategy is not :
a set of indicators
a “favorite setup”
A trading strategy is a formalized logic of actions that exists before entering the market.
It answers all key questions in advance and leaves no room for improvisation at the moment when pressure is highest.
Crucially, the strategy must be documented — not only in your head, but on paper or in digital form — so the market has no chance to confuse you.
What a Solid Trading Strategy Defines
A complete strategy clearly specifies:
which method of analysis is used
under what market conditions trading makes sense
how a trade idea is formed
what time of day trading is conducted
which analytical tools are used and how they are interpreted
where the trade idea is proven wrong
specifics of trading different assets
how risk and position size are calculated
how the trade is managed after entry
how mistakes are reviewed and analyzed
A strategy is not something you “feel”
If it can be changed during the trade — it is not a strategy
Strategy vs. Losses
It is important to understand:
A strategy does not eliminate losses. It eliminates chaos.
A loss within a strategy is a planned expense , not a mistake.
A mistake is a rule violation driven by emotion .
When a strategy is clearly defined and tested, the trader’s role is reduced to execution .
At this point:
you stop “feeling the market”
you start working with probabilities
A single trade no longer matters.
What matters is the series , the statistics , the long run .
That is why professionals think not in terms of profit or loss, but in terms of process .
Final Thought
A trading strategy takes over the 95% of decisions that were previously made subconsciously.
The trader is left with only one task:
Follow the system..
Enjoy!

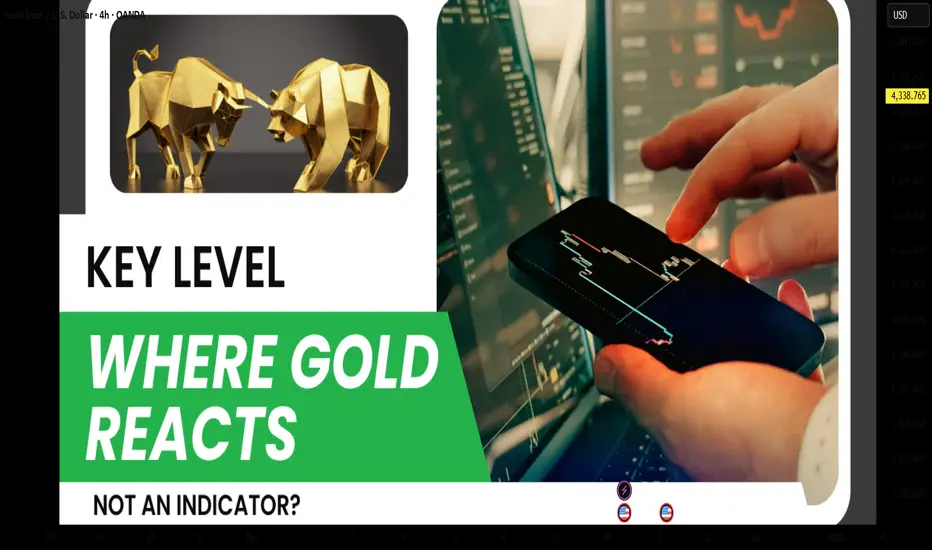
Key Levels – Where Gold Reacts, Not Indicators?Many traders start trading gold using indicators, and that’s something almost everyone goes through. However, the longer you stay in the market, the more clearly you realize one important truth: gold does not react to indicators; it reacts at key levels . Indicators only describe what price has already done, while key levels are where real money actually makes decisions.
Price does not move randomly. It reacts at important price zones.
Key levels are areas where the market has shown clear reactions in the past — strong reversals, repeated rejections, or consolidation before a breakout. In gold trading, these zones often align with major highs and lows, round numbers, or areas of concentrated liquidity.
This is where both retail traders and large capital are paying attention.
One major reason many traders consistently enter too late is over-reliance on indicators. Indicators are always based on past price data, so when a signal appears, the key reaction has often already happened. At that point, entries are less attractive, risk-to-reward deteriorates, and the probability of false breaks or stop hunts increases.
Indicators are not wrong, but they always lag behind price.
Professional traders don’t try to predict whether price will go up or down. They wait for price to reach a key level and then observe how the market reacts. Is price strongly rejected, or does it break through easily? Is real buying or selling pressure actually showing up?
Key levels are not places to predict — they are places to observe and react.
This doesn’t mean indicators are useless. Indicators still have value for momentum confirmation or for understanding market context. But they should not be the primary factor for making entry decisions.
Key levels tell you where to trade.
Indicators only help you understand how price is behaving.
Conclusion
If you are trading gold and still searching for the “best indicator for XAUUSD,” you may be asking the wrong question.
The better question is:
Which key level is the market respecting right now?
Because in the end, price reacts at levels — not at indicators.
Why Bitcoin Feels Stuck And What Options Have To Do With ItWhat are options? 🧾
- An option is a contract on Bitcoin.
-Calls = right to buy BTC later at a fixed price.
-Puts = right to sell BTC later at a fixed price.
Big traders and market‑makers hedge these contracts by buying or selling real BTC and futures. When there is a lot of options at a few key prices, their hedging can hold BTC in a tight range.
Why BTC feels stuck around 85k–93k 🧲
For December there is a lot of open interest around:
~85k (many puts).
~100k (many calls).
Because of this:
- When BTC moves up, dealers often sell to hedge → upside gets capped.
- When BTC moves down, they often buy → downside gets supported.
Result: price just chops sideways in a band, instead of trending strongly.
What changes after 26 December? 🎄➡️📈📉
On 26 December, a huge batch of Bitcoin options expires (tens of billions in notional value). When they expire:
- Those hedges are no longer needed.
- The “invisible wall” around 85k–100k weakens.
BTC is freer to move.
What that usually means:
Before 26 Dec: sideways range is likely to continue.
After 26 Dec: we can expect bigger, faster moves, either:
Up, if fresh spot buying / ETF inflows stay strong and macro is calm.
Or down, if sentiment turns risk‑off and new buyers don’t step in.

After the Win: When Ego Takes OverAfter the Win: When Ego Takes Over
“Losses hurt the account.
Wins test the mind.”
A good trade works.
The plan was followed.
The market respected your level.
And then something subtle happens.
Confidence rises.
Rules soften.
The next trade feels easier to take.
That’s not growth.
That’s ego quietly stepping in.
Why Wins Are Dangerous
A win rewards behavior — but it also rewards emotion.
The brain links profit with personal ability.
You start trusting yourself more than your process.
Thoughts begin to shift:
• “I’m in sync with the market.”
• “I can see it clearly now.”
• “This one will work too.”
This is how discipline slowly erodes.
Confidence vs Ego
Confidence is calm.
Ego is loud.
Confidence respects rules.
Ego bends them.
Confidence accepts uncertainty.
Ego assumes control.
The moment a trader feels “special,”
the market prepares a lesson.
The Common Pattern
Many traders lose money not after losses,
but after a strong winning trade.
Why?
• Position size increases
• Entries become aggressive
• Confirmation is skipped
• Patience disappears
The account doesn’t collapse immediately.
It leaks slowly.
How to Stay Grounded After a Win
• Treat wins like losses — review them
• Take a short pause after big profits
• Reset size to default
• Ask: “Did I follow process, or did I get lucky?”
Your edge is consistency, not confidence.
The market doesn’t punish success.
It punishes arrogance.
📘 Shared by @ChartIsMirror
Do you feel more disciplined after a win…
or more confident than your rules allow?

Gold vs Real Estate: Which Is Safer?Gold vs Real Estate: Which One Truly Keeps Your Money Safe in Uncertain Times?
When markets turn unstable, the first question that always comes up is: “ How do I keep my money safe ?”
Almost immediately, two familiar names are put on the scale: gold and real estate .
One is a globally recognized defensive asset.
The other is a tangible asset tied to land and long-term growth cycles.
But safety does not lie in the name of the asset — it lies in how you use it .
Safety does not mean “never going down”
Many people mistakenly believe that a safe asset is one that never declines in price. In reality, every asset goes through corrections .
True safety means:
When you need cash, can you actually convert it?
When markets deteriorate, can you withstand the psychological and cash-flow pressure?
When the cycle shifts, does that asset help you survive?
And this is exactly where gold and real estate begin to diverge.
Gold — safety through liquidity and defense
Gold is considered safe because it does not depend on a single economy . When inflation rises, crises emerge, or confidence in fiat currencies weakens, gold is often chosen as a safe haven.
Gold’s greatest strength is liquidity . It can be converted into cash almost instantly, nearly anywhere in the world. This makes gold an effective defensive tool during periods of strong market volatility.
However, gold does not generate cash flow . Its price can also move sideways for long periods, requiring patience and a capital-preservation mindset rather than a get-rich-quick mentality.
Real estate — safety through tangibility and long-term value
Real estate feels safe because it is tangible and familiar . The land remains. The property remains. Over the long term, real estate tends to appreciate alongside economic growth and urbanization.
In addition, real estate can generate rental income , something gold cannot offer. For investors with stable capital and no pressure to rotate funds quickly, this is a major advantage.
The trade-off, however, is low liquidity . When markets weaken or credit conditions tighten, selling property can take a long time. If leverage is involved, this so-called “safe asset” can quickly become a financial burden.
The core difference: time horizon and flexibility
Gold suits investors who value flexibility and fast response .
Real estate suits those with long-term vision, substantial capital, and the ability to endure cycles .
Gold helps you defend in the short to medium term .
Real estate helps you build wealth over the long term .
No asset replaces the other.
They differ only in their role within your financial strategy .

Unlock RSI Secrets: Spot Overbought & Oversold Trades Like a ProThe Relative Strength Index (RSI) is a momentum oscillator that measures the speed and change of price movements.
It ranges from 0 to 100:
Above 70 = Overbought (potential sell signal) 📈⚠️
Below 30 = Oversold (potential buy signal) 📉🛡️
RSI helps you avoid chasing highs or panic selling lows – perfect for Forex, Crypto, and Stocks.
How RSI Works (Quick Calc)
RSI = 100 - (100 / (1 + RS))
Where RS = Average Gain / Average Loss over 14 periods (default).
No math needed – TradingView does it for you! Just add the RSI indicator.
Key Strategies
1- Overbought/Oversold Entries
Enter sells above 70, buys below 30 – but wait for confirmation (e.g., price reversal).
2- Divergences
Bullish: Price makes lower lows, but RSI makes higher lows → Buy signal.
Bearish: Price higher highs, RSI lower highs → Sell signal.
3- Centerline Crossovers
RSI above 50 = Bullish trend
Real Examples Right Now
Bitcoin (BTC/USD): RSI(14)
*** In the chart you see, I have highlighted key areas including overbought and oversold areas, divergence, and also the center line which is colored yellow.***
Pro Tips
Use RSI with other tools (e.g., support/resistance or MACD) for better accuracy.
In volatile markets like Crypto, adjust periods (e.g., RSI(7) for shorter trades).
Avoid trading solely on RSI – always check volume and news.
Backtest on historical charts to see how it performs in your market.
Add RSI to your charts today and level up your edge!
What's your favorite RSI strategy? Share in the comments! 👇

How Emotions Destroy Profitable TradersHow Emotions Destroy Profitable Traders
🧠 How Emotions Destroy Profitable Traders | Trading Psychology Explained
Most traders don’t fail because of strategy.
They fail because they can’t control emotions.
Even a profitable system becomes useless when emotions take control of decision-making. Let’s break it down 👇
😨 Fear: The Profit Killer
Fear appears after losses or during volatility.
What fear causes:
Closing trades too early
Missing high-probability setups
Moving stop losses emotionally
📉 Result: Small wins, big regrets.
Fear stops traders from letting probabilities play out.
😤 Greed: The Account Destroyer
Greed appears after wins.
What greed causes:
Overleveraging
Ignoring risk management
Holding trades too long
📈 Traders want “more” and end up losing everything.
Greed turns discipline into gambling.
😡 Revenge Trading: The Fastest Way to Blow an Account
After a loss, many traders try to win it back quickly.
Revenge trading leads to:
Random entries
No confirmations
Breaking trading rules
🔥 One emotional trade often leads to many bad trades.
🤯 Overconfidence After Wins
Winning streaks create false confidence.
Overconfidence causes:
Larger position sizes
Ignoring market context
Believing losses “won’t happen”
Markets punish ego — always.
😴 Impatience: Silent Consistency Killer
Good trades require waiting.
Impatience leads to:
Forcing setups
Trading low-quality zones
Entering without confirmation
⏳ The market rewards patience, not speed.
🧘♂️ How Profitable Traders Control Emotions
Professional traders don’t eliminate emotions — they manage them.
Key habits:
Fixed risk per trade
Pre-planned entries & exits
Accepting losses as part of business
Waiting for confirmation
Trading less, not more
🧠 Discipline > Emotion
📊 Process > Outcome
📌 Final Thought
If emotions control your trades, the market will control your money.
Master your psychology, and your strategy will finally work.
Trade the plan.
Respect risk.
Stay patient.

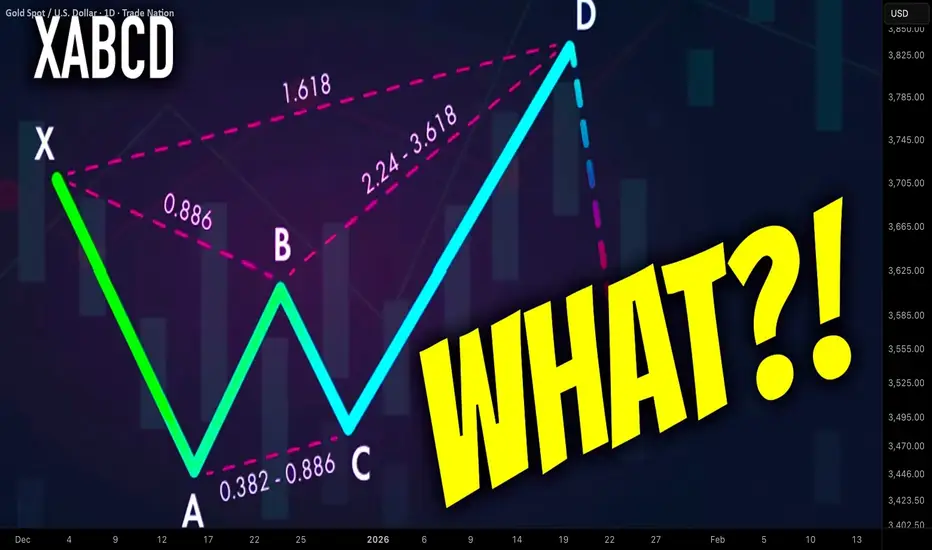
What is Harmonic XABCD Pattern and How to Identify It Easily
In the today's article, we will discuss the absolute basics of harmonic trading: I will explain to you what is harmonic ABCD pattern and how to recognize it, using fibonacci ratios.
The foundation of harmonic trading is impulse leg.
Impulse leg is a strong, directional bullish or bearish movement.
Harmonic traders perceive a price chart like a combination of impulse legs.
Here are the impulse legs on AUDUSD on a daily time frame. All these impulses are significant bullish or bearish movements.
In harmonic pattern trading, the impulse leg will also be called the XA leg.
XABCD pattern is based on 4 consequent price movements.
XA leg will be a fundamental component of each harmonic XABCD pattern and the first price movement within the pattern.
The direction of the XA leg will determine the bias of the pattern:
Bullish XA will be a foundation of a bullish harmonic pattern,
while, a bearish XA leg will be a foundation for a bearish harmonic pattern.
Above, the examples of a bullish and bearish impulse legs.
After identification of XA leg, a harmonic trader should analyse a consequent price action.
AB leg will be the next movement after a completion of XA leg.
BC leg will be the movement after a completion of AB leg.
CD leg will be the movement after a completion of BC leg.
CD leg will be a completion point of a harmonic pattern.
In a bullish harmonic pattern, a bullish movement will be anticipated from D point.
Above is a structure of a bearish harmonic XABCD pattern.
There are a lot of different types of harmonic XABCD patterns: bullish/bearish Gartley, Bat, Cypher, etc...
The type of the pattern will depend on the fibonacci ratios of B, C, D points of the pattern.
B, C, D points should have very specific ratios to make a pattern harmonic.
First, a harmonic trader should measure the fibonacci retracement level of B point in XA leg.
In the example below, B point is lying between 618 and 786 retracements of XA leg.
Then, if a C point is lying beyond the range of the XA impulse, one should measure its fibonacci extension level.
If a C is lying within XA, its retracement level should be measured.
Below, we can see that C point of the pattern is lying between 618 and 786 retracements of AB.
Depending on the type of the pattern, a D point will either be based on a certain fibonacci retracement of XA leg or extension of AB leg.
In our example, the criteria for a bullish harmonic Gartley pattern are met.
The completion point of the pattern - D point will be based on 786 retracement of XA leg.
From that retracement level, a bullish movement will be anticipated.
Your task as a harmonic trader is to learn the specific rations of each harmonic pattern. With experience, you will learn to identify impulse legs and trade them profitable.
❤️Please, support my work with like, thank you!❤️
I am part of Trade Nation's Influencer program and receive a monthly fee for using their TradingView charts in my analysis.
Examples of How to Determine When to Trade
Hello, fellow traders!
Follow us to get the latest information quickly.
Have a great day!
-------------------------------------
How can you profit from trading with charts that show the above movements?
To trade, you need a basic trading strategy.
This basic trading strategy varies from person to person, so it's important to create a basic trading strategy that suits you.
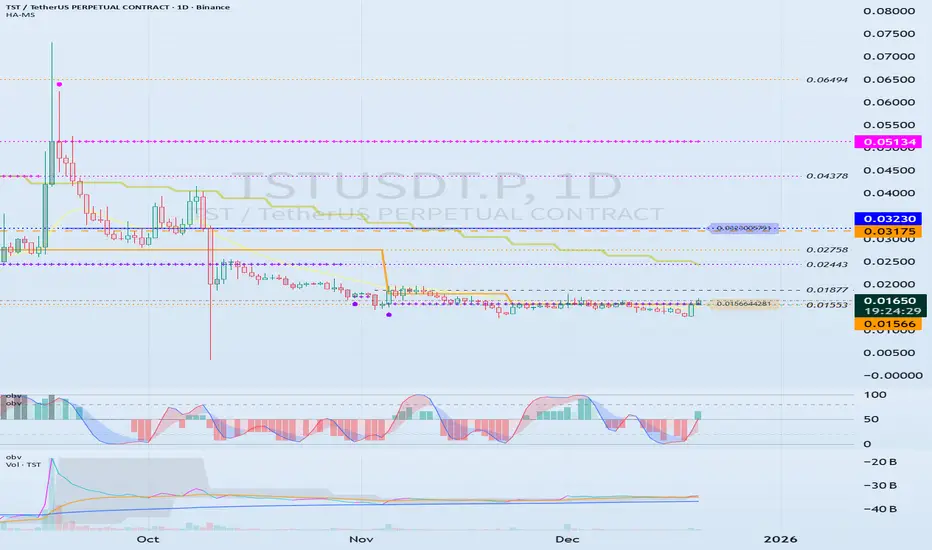
The basic trading strategy I'm suggesting is to buy in the DOM(-60) ~ HA-Low range and sell in the HA-High ~ DOM(60) range.
However, if the HA-High ~ DOM(60) range rises, a step-up trend is likely, while if the DOM(-60) ~ HA-Low range falls, a step-down trend is likely.
Therefore, you should trade using a segmented trading method.
Looking at the chart, you can see that a step-down trend is occurring, and the HA-High indicator has been created for the first time.
Therefore, if the current HA-Low indicator level of 0.01566 is supported and the price rises, the wave will end around 0.03230.
If you zoom in on the chart, you can see that the M-Signal indicator on the 1D chart has risen above the HA-Low indicator and has broken above it.
Therefore, we can see that short-term trading is possible.
The following evidence supports this:
1. The TC indicator has risen above the 0 level.
2. The StochRSI indicator is showing an upward trend.
3. The OBV indicator is showing signs of rising above the High Line.
Therefore, we can initiate a trade around the HA-Low indicator level of 0.01566, depending on whether there is support.
However, since the price is in a stepwise downtrend, if it falls below 0.01566, we should cut our losses or sell in installments to secure funds for future purchases.
A full-scale uptrend is likely to begin when the M-Signal indicator on the 1W chart rises above it.
-
Unlike the TST chart, the CHZ chart has the M-Signal indicator from the 1M chart.
Therefore, to sustain a long-term uptrend, the price must rise above the M-Signal indicator on the 1M chart.
Currently, the price is in a stepwise downtrend, but it has risen above the M-Signal indicator on the 1W chart.
Therefore, if the price remains above the M-Signal indicator on the 1W chart, an uptrend is expected.
As mentioned earlier, the basic trading strategy considers the HA-High ~ DOM (60) range as a sell zone.
Therefore, we should respond based on the presence of support around the 0.04363-0.04631 range.
If the HA-High ~ DOM (60) range supports the price and rises, a stepwise uptrend is likely.
At this point, the key is whether the price can sustain itself by breaking above the M-Siganl indicator on the 1M chart.
-
To continue the uptrend by breaking above a key point or range, the following conditions must be met:
1. The TC indicator must be trending upward. If possible, it should remain above the zero level.
2. The StochRSI indicator must be trending upward. If possible, it should not enter the overbought zone.
3. The OBV indicator must be trending upward. If possible, it should remain above the High Line.
Based on the above conditions, the current price movement appears highly likely to continue upward.
However, if the price breaks above the next important level, the 0.04363-0.04631 range, we must reassess whether the above conditions are met.
------------------------------------------------------------
To trade, we strive to gather as much information as possible.
This information includes issues beyond the chart itself.
However, if you identify issues outside of the chart before the chart analysis is complete, you may end up analyzing the chart subjectively. Therefore, it's best to explore other issues after the chart analysis is complete.
The most important thing when looking at a chart is the flow of funds.
However, it can be difficult for individual investors to understand this flow.
Analyzing trading volume can also be difficult, so to simplify this process, we created the TC indicator, which utilizes the OBV and PVT indicators.
Furthermore, the DOM indicator, which comprehensively evaluates the DMI, OBV, and MONENTUM indicators, also includes trading volume and displays support and resistance points.
Additionally, you can activate the StochRSI 20, 50, and 80 indicators, as well as the OBV High and Low indicators.
You can utilize these indicators to further refine your trading strategy.
However, you should first check the movement and alignment of the M-Signal indicator on the 1M, 1W, and 1D charts.
Next, you should check the location of the DOM(-60) ~ HA-Low or HA-High ~ DOM(-60) range and determine whether there is support near those areas.
Using other people's indicators or chart analysis requires significant time and observation.
Otherwise, you are more likely to misinterpret the data and fail to trade.
To utilize my charts, it's recommended to activate the indicators as follows:
1. Activate only the M-Signal and HA-Low/HA-High indicators on the 1M, 1W, and 1D charts to check and observe the basic chart movements.
You can trade with these indicators alone.
However, if volatility occurs, the high and low points are not clearly defined, which can delay response times.
2. To prevent this, activate the DOM(60) and DOM(-60) indicators. The DOM(60) indicator represents a high, while the DOM(-60) indicator represents a low.
Therefore, you can buy around the DOM(-60) ~ HA-Low range depending on whether there's support, and sell around the HA-High ~ DOM(60) range depending on whether there's support.
3. If you're comfortable interpreting steps 1 and 2, you can use the movements of the auxiliary indicators TC, StochRSI, and OBV.
Steps 1 and 2 can be thought of as indicating support and resistance points. When determining support near these points, refer to the movements of the auxiliary indicators TC, StochRSI, and OBV to help you determine whether there's support.
Becoming proficient at interpreting steps 1 through 3 will greatly aid you in identifying trading opportunities.
-
Thank you for reading to the end.
I wish you successful trading.
--------------------------------------------------
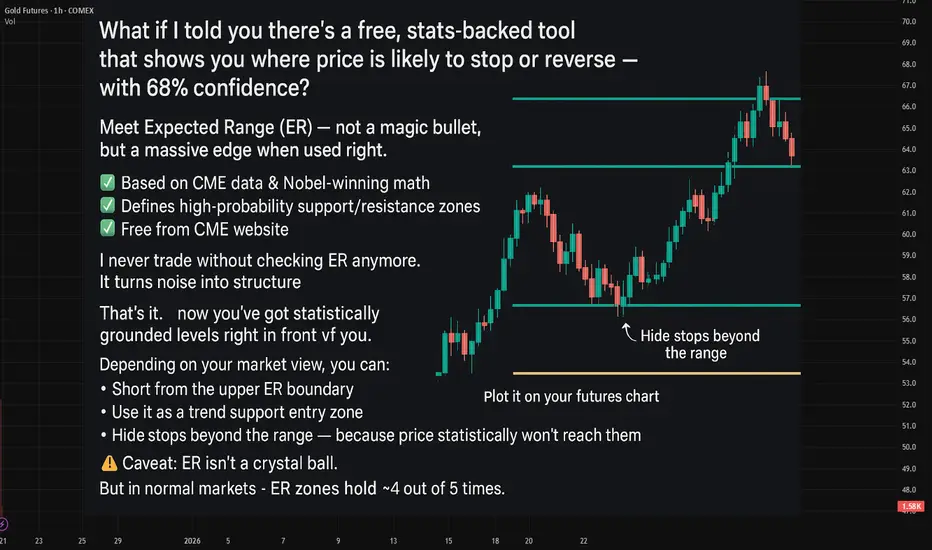
Last week Expected Ranges levels in actionQuick Recap: Last week Expected Ranges levels in action
What is Expected Range Volatility (ER)?
The Expected Range (ER) is a framework that helps traders understand how much an asset is likely to move within a specific timeframe. Based on CME market data and Nobel Prize-winning calculations, price movements within the expected volatility corridor have a 68%-95% probability of staying within those boundaries.
Crude Oil - 6 reactions to levels🔥
EUR - 4 reactions to levels
BTC - 3 reactions
GOLD - 1 reaction to levels
It's really an amazing tool to enhance your market entry💲
!!! - It doesn't guarantee trades every day.
!! it's better to combine it when working with the trend and when there's a clear sideways movement.
Cybersecurity Risks in the Global Trading SystemThreats, Vulnerabilities, and Strategic Defenses
In today’s highly interconnected world, the global trading system relies heavily on digital infrastructure. From stock exchanges and commodity markets to forex platforms and cross-border payment systems, technology is the backbone of modern trade. While digitization has improved speed, efficiency, and accessibility, it has also exposed global markets to significant cybersecurity risks. Cyber threats now pose one of the most critical non-financial risks to the stability, trust, and integrity of global trading systems.
Understanding the Global Trading System’s Digital Dependency
The global trading system includes stock exchanges, clearing corporations, depositories, brokerage firms, banks, commodity exchanges, logistics networks, and regulatory systems. These entities are interconnected through real-time data feeds, cloud services, APIs, and payment networks such as SWIFT. Even a minor cyber incident in one node can trigger a cascading effect across global markets.
High-frequency trading (HFT), algorithmic trading, and automated settlement systems depend on uninterrupted data flow and low latency. This dependency makes the system extremely sensitive to cyber disruptions, where milliseconds of delay or data manipulation can result in massive financial losses.
Major Cybersecurity Risks in Global Trading Systems
1. Data Breaches and Information Theft
One of the most common cybersecurity risks is data breaches. Trading platforms store sensitive information such as client identities, bank details, trade positions, proprietary algorithms, and market strategies. A successful breach can lead to insider trading, front-running, identity theft, and financial fraud.
State-sponsored hackers and cybercriminal groups often target financial institutions to steal market-sensitive data, which can be exploited for unfair trading advantages or sold on the dark web.
2. Market Manipulation Through Cyber Attacks
Cyber attackers can manipulate markets by altering data feeds, hacking trading algorithms, or spreading false information. For example, compromising a price feed can trigger automated buy or sell orders, leading to artificial volatility or flash crashes.
In algorithm-driven markets, even small distortions in data can cause massive ripple effects. Attackers may exploit vulnerabilities to manipulate liquidity, inflate volumes, or disrupt price discovery mechanisms.
3. Distributed Denial of Service (DDoS) Attacks
DDoS attacks flood trading platforms or exchanges with traffic, making systems unavailable to legitimate users. During critical market hours, such attacks can halt trading, delay order execution, or prevent access to risk management systems.
DDoS attacks are often used strategically during geopolitical tensions, economic announcements, or high-volatility events to destabilize markets or undermine confidence in financial institutions.
4. Ransomware Attacks on Financial Infrastructure
Ransomware attacks have become increasingly sophisticated. Hackers encrypt critical trading and settlement systems and demand ransom payments to restore access. If clearing and settlement systems are compromised, it can delay trade confirmations, margin calculations, and fund transfers.
Such attacks not only cause financial losses but also damage reputations and erode investor trust in the reliability of global trading systems.
Systemic Risk and Cascading Failures
Cybersecurity risks in global trading systems are not isolated threats—they represent systemic risk. A successful cyberattack on a major exchange, clearing house, or payment network can disrupt multiple markets simultaneously.
For example:
A compromised clearing corporation can delay settlements across thousands of trades.
A hacked forex trading platform can affect currency stability.
A cyberattack on a major bank can freeze liquidity across regions.
These cascading failures can amplify market panic, trigger margin calls, and even lead to broader financial instability.
Geopolitical and State-Sponsored Cyber Threats
Cybersecurity has become a tool of geopolitical conflict. Nation-states increasingly use cyber warfare to target financial infrastructure of rival economies. Global trading systems are prime targets because disrupting financial markets can weaken economic stability without direct military confrontation.
State-sponsored cyberattacks may aim to:
Undermine confidence in a country’s financial markets
Steal economic intelligence
Disrupt trade during sanctions or conflicts
Manipulate commodity or currency markets
This elevates cybersecurity from an IT issue to a matter of national and global economic security.
Third-Party and Supply Chain Vulnerabilities
Global trading systems rely on third-party vendors for cloud services, data analytics, trading software, and connectivity. A vulnerability in any third-party provider can expose multiple institutions simultaneously.
Supply chain attacks—where hackers infiltrate a trusted vendor to access clients—are particularly dangerous. Since vendors often have privileged system access, attackers can bypass traditional security controls and remain undetected for long periods.
Human Error and Insider Threats
Despite advanced security technologies, human error remains a major risk factor. Weak passwords, phishing emails, poor access controls, and lack of cybersecurity awareness can open doors to attackers.
Insider threats—whether malicious or accidental—are equally dangerous. Disgruntled employees or compromised insiders can leak sensitive data, sabotage systems, or provide access credentials to attackers.
Regulatory and Compliance Challenges
Global trading systems operate across multiple jurisdictions, each with different cybersecurity regulations and standards. Inconsistent regulatory frameworks create gaps that attackers can exploit.
Additionally, rapid technological innovation often outpaces regulation. New trading technologies such as decentralized finance (DeFi), blockchain-based trading, and AI-driven systems introduce fresh cybersecurity risks that regulators may not fully address yet.
Impact on Market Confidence and Trust
Trust is the foundation of global trading. Cyber incidents erode investor confidence, reduce participation, and increase risk premiums. Repeated cybersecurity failures can push investors away from affected markets and lead to long-term reputational damage for exchanges and financial institutions.
In extreme cases, loss of trust can cause liquidity shortages, capital flight, and prolonged market instability.
Strengthening Cybersecurity in Global Trading Systems
To mitigate cybersecurity risks, a multi-layered and proactive approach is essential:
Advanced Threat Detection: Use AI and machine learning to identify abnormal trading behavior and cyber intrusions in real time.
Zero-Trust Architecture: Assume no system or user is automatically trusted; verify every access request.
Regular Stress Testing: Conduct cyber stress tests and simulations to assess resilience against large-scale attacks.
Encryption and Data Protection: Secure data at rest and in transit using strong cryptographic standards.
Employee Training: Build cybersecurity awareness to reduce phishing and social engineering risks.
Global Coordination: Regulators, exchanges, and financial institutions must share threat intelligence and coordinate responses to cyber incidents.
Conclusion
Cybersecurity risks in the global trading system represent one of the most significant challenges to modern financial markets. As trading becomes faster, more automated, and more interconnected, the potential impact of cyber threats grows exponentially. These risks go beyond financial losses, threatening market integrity, systemic stability, and global economic trust.
Addressing cybersecurity is no longer optional—it is a strategic imperative. Only through continuous investment in technology, strong governance, international cooperation, and a culture of cyber resilience can the global trading system remain secure, stable, and trustworthy in an increasingly digital world.

One Gold Trade Can Destroy a Week of Profits
💥 One Gold Trade Can Destroy a Week of Profits – Education
One Gold Trade Can Destroy a Week of Profits
Gold (XAUUSD) is one of the most exciting yet dangerous instruments in trading. Its high volatility offers massive profit potential—but one wrong move can erase all your hard-earned gains. Let’s break this down in detail.
1️⃣ Understanding Gold Market Volatility 🔥
Gold reacts sharply to geopolitical events, economic news, and central bank decisions.
Price swings of 50–200 pips in a day are common.
High volatility means both high reward and high risk—making risk management essential.
Example:
If you earned $500 in small, careful trades, one unexpected spike or wrong trade in XAUUSD could cost $600+, wiping out a week’s profits in minutes. 😱
2️⃣ Risk Management is Your Lifesaver 🛡️
Trading without protecting your capital is like walking on a tightrope without a safety net.
✅ Rules to Follow:
Risk 1–2% of your account per trade.
Always set a stop-loss and take-profit.
Use a risk-to-reward ratio of at least 1:2 or 1:3.
Avoid over-leveraging—even small mistakes become huge losses with high leverage.
Tip: A single trade should never threaten your entire weekly profit.
3️⃣ Emotions Can Kill Your Profits 😵🧠
Trading isn’t just about charts; it’s about psychology. One impulsive decision can erase a week of careful work.
Avoid revenge trading after losses.
Don’t chase trades that don’t meet your plan.
Practice discipline and patience—stick to your strategy and setups.
Reality Check: Emotional trades often ignore risk management, which is why one trade can wipe out a week of profits.
4️⃣ Timing is Everything ⏱️
Gold has major moves during:
US session open 🌎
Fed announcements 🏦
High-impact economic news 📊
Avoid trading blindly during these times unless you are highly experienced.
Pro Tip: Sometimes the best trade is no trade—waiting for clear setups can save your profits.
5️⃣ Technical Analysis Must Be Precise 📈🔍
Before entering a trade, confirm setups using:
Order Blocks & Fair Value Gaps
Momentum Shifts
Volume & Price Action Confirmation
Avoid: Entering on impulse or guessing the trend. Even a small error can result in losses bigger than weekly profits.
6️⃣ Practical Example: The “Profit Destroyer” Trade 💣
Imagine your trading week:
Monday to Friday: 5 small, calculated trades → $500 profit 💰
Friday afternoon: Impulsive Gold trade without stop-loss → $600 loss 😱
Result? You’re down $100 for the week despite a strong start.
Lesson: Protect your capital first. Profits come from consistent, disciplined trading—not luck.
7️⃣ Key Takeaways ✅
Gold = High Risk, High Reward ⚖️
Risk Management is Non-Negotiable 🛡️
Discipline Beats Emotions Every Time 🧘♂️
Wait for Clear Setups 🕵️♂️
One Wrong Trade Can Erase a Week of Profits ⚠️
Follow for More Gold & Forex Trading Insights! 🚀📈
Stay updated with XAUUSD tips, risk management strategies, and profitable trading setups. Don’t miss out—follow now and trade smarter every day! 💎🔥

Why Every Trend Begins and Ends With LiquidityEvery trend in crypto begins and ends with liquidity. Before a trend can move with force, the market must collect the stop orders that provide the fuel for expansion. These orders sit above equal highs, below equal lows, inside inefficiencies, and around obvious retail breakout levels. Price does not trend because sentiment magically aligns.
It trends because the market clears liquidity at one side of the structure and then expands toward the next pool. The earliest phase of any trend usually starts with a sweep: price reaches beyond a key high or low, triggers stops, absorbs the resting orders, and immediately snaps back. This wick is the first sign that the breakout attempt failed and that larger participants have used the liquidity to take positions.
Once liquidity is taken, the market shifts into structural progression. Higher highs and higher lows form not because traders collectively decide to buy, but because the market now has trapped sellers below the sweep, providing momentum as price moves toward the next logical liquidity target.
Structure becomes the visible footprint of this process. Impulse legs show aggression after liquidity collection, and pullbacks tend to remain orderly because the directional objective has not yet been completed.
Every trend is essentially a journey from one liquidity pool to the next, with structure simply describing how that journey unfolds.
The end of a trend is equally tied to liquidity. A trend rarely dies from weakening momentum alone. Instead, it typically completes when price reaches a major pool of opposing liquidity, often equal highs in an uptrend or equal lows in a downtrend.
The final move into that level is usually fast and dramatic, designed to trigger breakout traders while simultaneously running the stops of those holding late in the trend. Once the liquidity is collected, the market loses incentive to continue and snaps back inside the level, exposing the sweep as a terminal event rather than a continuation. This reversal wick marks the end of one trend and the beginning of the liquidity cycle in the opposite direction.
From there, the process repeats. Liquidity is taken. Structure shifts. Displacement confirms intention. A retest provides the entry. And the new trend begins by targeting the next liquidity pool in line.
When traders understand this cycle, trends become far easier to read. Direction is no longer based on hope, indicators, or isolated candles. It is built on recognising how liquidity motivates movement and how structure validates that movement.
Liquidity shows where the market wants to travel, structure shows how it gets there, and together they form a practical framework for identifying when trends are forming, when they are maturing, and when they are preparing to reverse.

Why This Support Held | Market Pressure Explained #2🧠 WHY THIS SUPPORT HELD | MARKET PRESSURE EXPLAINED #2 (EURNZD)
This chart illustrates how price stability and continuation can emerge from collective market participation , rather than from candlesticks or indicators in isolation.
📌 In this historical example, s upport held due to sustained buy-side interest becoming visible across multiple timeframes , particularly as price approached previously established support areas.
Key observations include:
• Increased market participation near higher-timeframe support
• Price compression followed by renewed directional activity
• Alignment of structural price zones across timeframes
• Gradual absorption of selling pressure
• Continuation supported by overlapping participation behaviors
📊 Candlesticks do not cause price movement.
They reflect past interactions between buyers and sellers.
🧠 Understanding market behavior is clearer when focusing on
how different participants may interact at specific price areas , rather than treating indicators as standalone decision tools.
📘 This content is provided solely for educational and explanatory purposes , aiming to improve understanding of market structure and price behavior based on historical data.
⚠️ DISCLAIMER
This material is strictly educational and informational.
It does not constitute financial advice, trading instructions, or a recommendation to engage in any financial activity.
The author does not offer personalized guidance.
Any decisions made based on this content are entirely the responsibility of the individual.

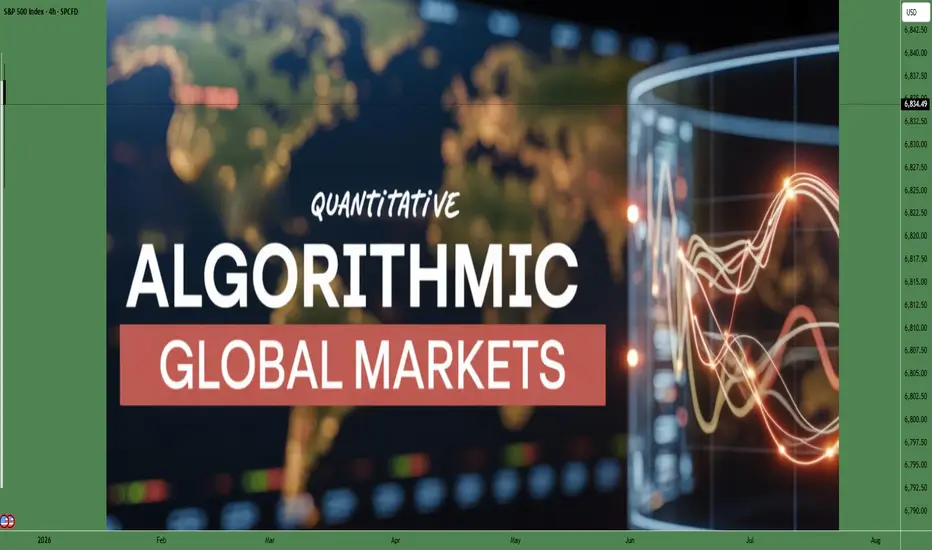
Quantitative Algorithmic Trading in the Global MarketData-Driven Strategies for Modern Finance
Quantitative algorithmic trading, often called quant trading, represents the convergence of finance, mathematics, statistics, and computer science. In the global market—spanning equities, commodities, forex, fixed income, and derivatives—quantitative trading has transformed how capital is deployed, risks are managed, and opportunities are identified. Instead of relying on intuition or discretionary decision-making, quant trading uses data-driven models and automated algorithms to execute trades with speed, precision, and discipline across international markets.
Understanding Quantitative Algorithmic Trading
At its core, quantitative algorithmic trading involves creating mathematical models that identify trading opportunities based on historical and real-time data. These models are translated into algorithms that automatically place buy or sell orders when predefined conditions are met. The trader’s role shifts from manual execution to designing, testing, and refining strategies.
In global markets, quant trading operates across multiple exchanges, time zones, and asset classes. This global reach allows algorithms to exploit inefficiencies arising from market fragmentation, differing regulations, currency fluctuations, and regional economic cycles.
Evolution of Quant Trading in Global Markets
Quantitative trading began with simple statistical arbitrage strategies in developed markets such as the United States and Europe. Over time, advances in computing power, access to large datasets, and the growth of electronic exchanges expanded its scope. Today, quant trading dominates volumes in major global markets, particularly in equities and foreign exchange.
Emerging markets have also seen rapid adoption as infrastructure improves and liquidity deepens. Global hedge funds, proprietary trading firms, and institutional investors deploy algorithms that operate 24 hours a day, adapting to market conditions in Asia, Europe, and the Americas.
Key Components of a Quant Trading System
A successful quantitative trading system typically consists of several interconnected components. First is data acquisition, which includes price data, volume, order book information, macroeconomic indicators, corporate fundamentals, and alternative data such as news sentiment or satellite data. In global markets, handling data from multiple sources and ensuring consistency across regions is a major challenge.
Second is model development, where statistical techniques, machine learning, or econometric models are used to identify patterns and predict price movements. These models are backtested using historical data to evaluate performance under different market conditions.
Third is execution logic, which determines how trades are placed to minimize costs such as slippage and market impact. In global markets, execution algorithms must account for varying liquidity, trading hours, and regulatory constraints.
Finally, risk management is embedded into the system to control exposure, limit drawdowns, and ensure capital preservation across volatile global environments.
Types of Quantitative Trading Strategies
Quantitative strategies in global markets can be broadly classified into several categories. Statistical arbitrage strategies exploit pricing inefficiencies between related instruments, such as pairs trading across international exchanges or ADRs versus local shares.
Trend-following strategies identify and ride sustained price movements across global asset classes. These strategies are popular in futures and forex markets, where macroeconomic trends often play out over long periods.
Mean-reversion strategies assume that prices revert to historical averages. These are commonly used in equity markets and volatility trading.
High-frequency trading (HFT) focuses on extremely short time frames, using speed and micro-price movements to generate profits. While controversial, HFT plays a significant role in global market liquidity.
Machine learning-based strategies use advanced algorithms to detect complex, nonlinear relationships in data. These approaches are increasingly popular as data availability and computing power expand.
Advantages of Quant Trading in Global Markets
One of the biggest advantages of quantitative algorithmic trading is objectivity. Decisions are based on data and rules, reducing emotional bias. This is particularly important in global markets, where geopolitical events, policy decisions, and sudden shocks can trigger extreme volatility.
Another key benefit is scalability. Algorithms can simultaneously monitor and trade hundreds of instruments across multiple countries, something impossible for manual traders. This allows firms to diversify strategies and reduce dependence on a single market.
Speed and efficiency are also critical advantages. Automated systems can react to market changes in milliseconds, capturing opportunities before they disappear. In global markets with overlapping trading sessions, this speed is a competitive edge.
Challenges and Risks
Despite its advantages, quantitative trading faces significant challenges. Model risk is a major concern—strategies that perform well in historical tests may fail in live markets due to changing conditions. Global markets add complexity due to differing regulations, political risks, and currency exposure.
Data quality and availability can also be problematic, especially in emerging markets where historical data may be limited or unreliable. Poor data can lead to flawed models and unexpected losses.
Technology and infrastructure risk is another factor. System failures, latency issues, or cyber threats can disrupt trading operations, potentially leading to large losses.
Regulation and Ethical Considerations
Global regulators closely monitor algorithmic trading due to its impact on market stability. Different countries impose varying rules on order types, position limits, and reporting requirements. Quant traders operating globally must ensure compliance with multiple regulatory frameworks.
Ethical considerations also arise, particularly around market fairness and transparency. Responsible quant trading emphasizes liquidity provision and risk control rather than exploitative practices.
The Future of Quantitative Algorithmic Trading
The future of quant trading in global markets is closely tied to technological innovation. Artificial intelligence, alternative data, and cloud computing are reshaping how strategies are developed and deployed. As markets become more interconnected, cross-asset and cross-border strategies will gain importance.
At the same time, competition is intensifying. Alpha is becoming harder to find, pushing quants to focus on better risk management, execution efficiency, and innovation rather than pure prediction.
Conclusion
Quantitative algorithmic trading has become a cornerstone of modern global financial markets. By leveraging data, technology, and systematic processes, it enables traders and institutions to operate efficiently across borders and asset classes. While challenges such as model risk, regulation, and market complexity remain, the disciplined and scalable nature of quant trading ensures its continued dominance in the global market landscape.
Understanding Candlesticks Within Market Structure | Tutorial #1Candlesticks + Support & Resistance in an Uptrend (Contextual Analysis)
In this tutorial, we developing an understanding of market context by observing how candlesticks behave within a bullish market environment.
Rather than viewing candlesticks as independent signals, this lesson focuses on how price behavior interacts with Support & Resistance levels during an uptrend , from a purely analytical and educational perspective.
The goal is to explain market behavior and structure , not to instruct or encourage any form of trading activity.
⚠️ Important Note
If anything on the chart is unclear, feel free to ask questions in the comments, and I will clarify the conceptual logic behind the price behavior shown.
If the material feels complex at first, that is completely normal.
This series is focused on building foundational understanding step by step , not on decision-making or execution.
📌 Chart Explanation (EURJPY Example)
On the chart, the following elements are highlighted:
1️⃣ Candlesticks
→ Illustrate how price reacts after pullbacks and pauses within a broader upward structure.
2️⃣ Support & Resistance Zones
→ Areas where price has historically shown repeated reactions.
3️⃣ Market Structure
→ Higher highs and higher lows, which define an upward structural environment.
4️⃣ Directional Arrows
→ Visual references to help distinguish between impulsive movements and corrective phases within the trend.
These elements are shown solely to explain market structure and price interaction , not to imply or suggest any action.
🧠 Why Context Matters in an Uptrend
👉 Support & Resistance as contextual reference points
Candlesticks, on their own, do not carry inherent meaning.
They become informative only when analyzed within market structure and key price areas.
In an uptrend, price often displays different behavior during pullbacks compared to trend reversals.
Understanding this distinction is essential for accurate market interpretation , not for execution.
📊 Step-by-Step Market Interpretation
1️⃣ Recognizing an upward market structure
→ Higher highs and higher lows
2️⃣ Identifying relevant Support & Resistance areas
→ Zones where price previously reacted
3️⃣ Observing candlestick behavior near these areas
→ Sequences, momentum shifts, and pressure buildup
These steps are presented to organize analytical thinking , not to guide participation in the market.
🔍 Additional Observational Elements
When certain candlestick formations appear after a pullback—such as stronger momentum candles or engulfing structures—they are often discussed in technical analysis literature as signs of renewed buying pressure.
It is important to understand that:
No single candle has predictive power on its own
Observations are probabilistic, not deterministic
Market behavior is interpreted, not guaranteed
🛡 General Risk Awareness (Educational Context)
No market pattern guarantees any outcome.
Financial markets involve uncertainty by nature.
Anyone studying these concepts should understand that:
Analysis does not equal results
Knowledge does not remove risk
Learning should always precede real-world application
This content does not encourage participation , but rather explains analytical frameworks used in market study.
👀 What’s Next?
In the next tutorial, we will introduce the concept of areas of confluence in an uptrend.
We’ll focus on how different forms of analysis can align in the same region on the chart , increasing its structural relevance from a technical perspective.
The goal is to improve contextual understanding of price behavior , not to provide trading instructions.
Follow to continue learning about market structure and price behavior
⚠️ DISCLAIMER
This content is provided strictly for educational and informational purposes only.
It does not constitute financial advice, trading instruction, or a recommendation to engage in any financial activity.
The author does not provide personalized advice.
Any actions taken based on this content are solely the responsibility of the individual.

THE 16 BIGGEST TRADING MISTAKES: WHY MOST TRADERS FAILBefore you take the plunge into the live markets, consider these common mistakes you should avoid. Whether you are trading Crypto, Forex, or Stocks, these are the main reasons new traders fail to become profitable.
1. TRADING WITHOUT A STOP LOSS
You should have a stop-loss order for every trade you take. If you start taking losses on a trade, the stop-loss prevents you from losing more than you can handle.
2. ADDING TO A LOSING DAY TRADE
Averaging down is adding to your position (the price you purchased the trade at) as the price moves against you, in the mistaken belief that the trend will reverse.
3. RISKING MORE THAN YOU CAN AFFORD TO LOSE
You should set a percentage for the amount you are willing to lose in a day. If you can afford a 3% loss in a day, you should discipline yourself to stop at that point.
4. GOING ALL IN
Traders might have had several losing trades in a row, which creates a revenge seeking streak. If you risk too much you are making a mistake, and mistakes tend to compound.
5. TRYING TO ANTICIPATE THE NEWS
Instead of anticipating the direction that news will take the market, have a strategy that gets you into a trade after the news release. You can profit from the volatility without all the unknown risks.
6. CHOOSE THE WRONG BROKER
Depositing money with a broker is the biggest trade you will make. If it is poorly managed, in financial trouble, or an outright trading scam, you could lose all your money.
7. TAKE MULTIPLE TRADES THAT ARE CORRELATED
If you see a similar trade setup in multiple pairs, there is a good chance those pairs are correlated. If you take multiple day trades at the same time, make sure they move independently of each other.
8. TRADING WITHOUT A PLAN
If a trader doesn't have a trading plan, it results in unnecessary gambles. Create a trading plan and test it on a demo account before trying it with real money.
9. OVER-LEVERAGING
While this feature requires less personal capital per trade, the possibility of enhanced loss is real. The use of leverage magnifies gains and losses, so managing the amount of leverage is key.
10. LACK OF TIME HORIZON
Each trading approach aligns itself to varying time horizons, therefore understanding the strategy will lead to gauging the estimated time frame used per trade.
11. MINIMAL RESEARCH
Studying the market as it should be, will bring light to market trends, timing of entry/exit points and fundamental influences as well. The more time dedicated to the market, the greater the understanding of the product itself.
12. POOR RISK-TO-REWARD RATIOS
A minimum risk:reward a trader should aim is 1:3, any trade setups below this shouldn't be taken.
13. EMOTION BASED TRADING
Traders frequently open additional positions after losing trades to compensate for the previous loss. These trades usually have no educational backing either technically or fundamentally.
14. INCONSISTENT TRADING SIZE
Trading size is crucial to every trading strategy. Many traders trade inconsistent lot sizes. Risk then increases and could potentially erase account balances.
15. TRADING ON NUMEROUS MARKETS
Many novice traders look to trade on multiple markets without success due to lack of understanding. Unfortunately, many traders entered at the "FOMO or Euphoria" stage which resulted in significant losses.
16. NOT REVIEWING TRADES
Frequent use of a trading journal will allow traders to identify possible strategic flaws along with successful facets.
SUMMARY
Trading is not a get-rich-quick scheme; it is a business of managing risk. If you can eliminate these 16 errors from your daily routine, you are already ahead of 90% of market participants.
Which of these mistakes is the hardest for you to avoid? Let me know in the comments below!
Disclaimer: This content is for educational purposes only. Trading involves significant risk.

Axis Bank | Gann Square of 9 Intraday Case Study | 6 Apr 2023This idea presents a historical intraday case study on Axis Bank, analysed using the WD Gann Square of 9 to observe price behavior near degree-based levels.
On 6 April 2023, Axis Bank began the session with downward momentum, and the day’s high at ₹863 was considered the 0-degree (0°) reference point.
Using Square of 9 calculations, the next important level was:
45° → ₹848
According to Gann’s price–degree relationship, when price approaches the 45° level within a small tolerance, it often acts as a temporary support or reversal zone.
By around 2:15 PM, Axis Bank reached ₹849, which was within 1 point of the calculated 45° level (₹848). This aligned with the commonly observed tolerance range in Gann-based studies.
From this area, price showed a modest upward reaction, moving toward the ₹854 zone before the session ended.
This example highlights how mathematical price mapping using Square of 9 can help traders identify logical intraday reaction zones, even when the move is limited in size.
📌 Key Square of 9 Levels
0° → ₹863
45° → ₹848
📘 Educational Observations
Square of 9 defines measured price capacity
Small tolerance near degree levels is common
Not every reaction becomes a large trend
Structure and consistency matter more than outcome size
Disclaimer:
This idea is shared strictly for educational and chart-study purposes only. It is not trading advice.

Axis Bank | Gann Square of 9 Intraday Case Study | 16 Sep 2022This idea documents a historical intraday case study on Axis Bank, analysed using the WD Gann Square of 9 to understand price behavior and logical reversal zones.
On 16 September 2022, Axis Bank opened with upward momentum, and the day’s low at ₹776 was taken as the 0-degree (0°) reference point.
Using Square of 9 calculations, the following degree-based price levels were identified:
0° → ₹776
45° → ₹790
90° → ₹804
As per Gann’s price–time relationship, when price approaches or completes the 45° level before the 2:30 PM time threshold, it often signals temporary exhaustion and a potential reversal zone.
At around 12:30 PM, Axis Bank reached the 45° level near ₹790 and faced clear rejection within the expected tolerance range. Following this, price reversed sharply toward the downside, reacting down to the ₹778 region.
This case highlights how degree-based price mapping, combined with time awareness, helps define structured intraday resistance zones, allowing traders to assess opportunities logically instead of reacting emotionally.
📌 Key Square of 9 Levels
0° → ₹776
45° → ₹790
90° → ₹804
📘 Educational Takeaways
Square of 9 helps quantify normal price capacity
45° often acts as a decision or reversal zone
Time confirmation improves probability
Structured levels reduce emotional trading
Disclaimer:
This idea is shared strictly for educational and chart-study purposes only. It does not constitute trading advice.

Axis Bank | Gann Square of 9 Intraday Case Study | 20 Sep 2022This idea presents a historical intraday case study on Axis Bank, analysed using the WD Gann Square of 9 to understand price behavior and reversal zones.
On 20 September 2022, Axis Bank initiated an upward move from the 0-degree (0°) reference level at ₹802.
Using Square of 9 calculations, the 45-degree (45°) level was identified at ₹816, representing the stock’s normal intraday price capacity.
By around 12:30 PM, Axis Bank reached the 45° level well before the 2:30 PM time threshold.
At this level, price faced clear rejection and reversed, validating the importance of the 45° degree as a resistance and potential reversal zone.
As per WD Gann’s price–time geometry, early completion of a degree-based move often signals exhaustion, increasing the probability of a counter-move.
This case demonstrates how degree-based price mapping, when combined with time awareness, can help traders identify logical intraday resistance zones instead of relying on guesswork or lagging indicators.
📌 Key Square of 9 Levels
0° → ₹802
45° → ₹816
📘 Educational Insights
Square of 9 defines price symmetry
Time confirms strength or exhaustion
Early 45° completion increases reversal probability
Structured levels reduce emotional decision-making
Disclaimer:
This idea is shared strictly for educational and chart-study purposes only. It is not trading advice.

Axis Bank | Gann Square of 9 Intraday Case Study | 29 Sep 2022This idea demonstrates a historical intraday case study using the WD Gann Square of 9 to identify price capacity and reversal zones.
On 29 September 2022, Axis Bank started the session near ₹730, which was used as the 0-degree (0°) reference on the Square of 9.
Using Square of 9 calculations, the next important degree levels were identified as:
45° → ₹717
90° → ₹703
During the mid-session decline, price reached the 45-degree level (₹717) well before the 2:30 PM time threshold, completing its normal intraday price capacity.
As per Gann’s price–time geometry, early completion of a degree move often leads to a temporary reaction or reversal.
Axis Bank respected this level and reacted from the ₹717 zone, confirming the validity of the Square of 9 projection.
This case highlights how degree-based price mapping, when combined with time awareness, can help traders define logical intraday reaction zones instead of relying on lagging indicators.
📌 Key Square of 9 Levels
0° → 730
45° → 717
90° → 703
📘 Educational Takeaways
Square of 9 defines price symmetry
Time confirms strength or exhaustion
Early degree completion increases reaction probability
Structure replaces emotional trading decisions
Disclaimer:
This idea is shared for educational and chart-study purposes only. It does not constitute trading advice.
