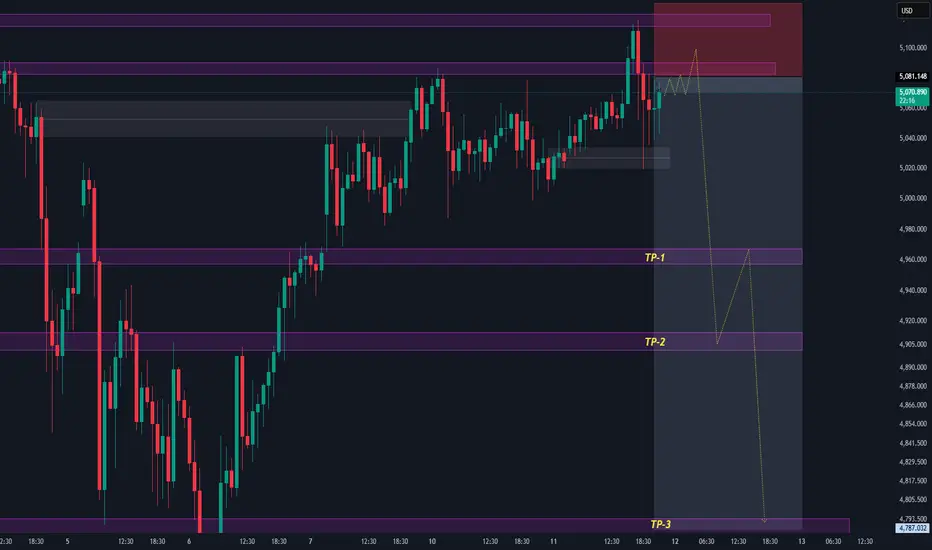
Gold next move (selling continued)(13-02-2026)Plz Go through the analysis carefully and do trade accordingly.
Anup 'BIAS for the day (13-02-2026)
Current price- 4970
"if Price stays below 5040 then next target is 4920, 4860, 4760 and 4580 and above that 5170 and 5270".
-POSSIBILITY-1
Wait (as geopolitical situation are worsening )
-POSSIBILITY-2
Wait (as geopolitical situation are worsening)
Best of luck
Never risk more than 1% of principal to follow any position.
Support us by liking and sharing the post.
Community ideas

Gold next move (huge selling is on the cards)(11-02-2026)Plz Go through the analysis carefully and do trade accordingly.
Anup 'BIAS for the day (11-02-2026)
Current price- 5080
"if Price stays below 5130 then next target is 5000, 4950, 4900 and 4800 and above that 5200 and 5300".
-POSSIBILITY-1
Wait (as geopolitical situation are worsening )
-POSSIBILITY-2
Wait (as geopolitical situation are worsening)
Best of luck
Never risk more than 1% of principal to follow any position.
Support us by liking and sharing the post.
Gold 30Min Engaged ( Bearish & Bullish Entry Detected )⚡Base : Hanzo Trading Alpha Algorithm
The algorithm calculates volatility displacement vs liquidity recovery, identifying where probability meets imbalance.
It trades only where precision, volume, and manipulation intersect —only logic.
✈️ Technical Reasons
/ Direction — LONG / Reversal 4908 Area
☄️Bullish momentum confirmed through strong candle body.
☄️Structure shifted with higher-low near key demand base.
☄️Volume expanding confirms order-flow alignment upward.
☄️Buyers reclaimed imbalance with sustained clean break.
☄️Algorithm detects rising momentum under low liquidity.
✈️ Technical Reasons
/ Direction — SHORT / Reversal 5021 Area
☄️Bearish rejection confirmed through sharp candle body.
☄️Lower-high forming beneath resistance supply region.
☄️Volume decreasing confirms exhaustion in price rally.
☄️Sellers regained imbalance with heavy top rejection.
☄️Algorithm detects fading demand and shift to control.
⚙️ Hanzo Alpha Trading Protocol
The Alpha Candle defines the day’s real control zone — the first battle of momentum.
From this origin, the Volume Window reveals where the next precision strike begins.
⚙️ Hanzo Volume Window / Map
Window tracked from 10:30 — mapping true market behavior.
POC alignment exposes institutional bias and breakout potential zones.
⚙️ Hanzo Delta Window / Pulse
Delta window monitors real buying vs. selling power behind each move.
Tracks volume aggression to expose who controls the candle — buyers or sellers.
When Delta aligns with Volume Map, momentum becomes undeniable.

EUR/USD at Key Zone – Support Test Incoming! (13.02.2026)📊 Description✅ Setup OANDA:EURUSD
EUR/USD is reacting from a higher-timeframe resistance zone after a strong bullish move.
Price is now respecting a rising trendline support, showing a slowing momentum and possible distribution.
We can see:
👉Multiple rejections from resistance
👉Trendline acting as dynamic support
👉Lower highs forming intraday
This creates a decision zone for the next move.
🧱 Support & Resistance
🔻 1st Support: 1.1807
🔻 2nd Support: 1.1782
🔺 Resistance Zone: 1.1910 – 1.1930 area
These levels may act as reaction zones.
#EURUSD #ForexTrading #PriceAction #SupportAndResistance #TrendlineTrading #FXAnalysis #DayTrading #SmartMoneyConcept
⚠️ Disclaimer
This analysis is for educational purposes only.
Not financial advice. Always manage risk and use proper lot sizing.
If this analysis helps you:
👉 Like ❤️ 👉 Comment your view 💬
👉 Follow for more setups 📈

GOLD - Consolidation ahead of the news? Will the trend continue?FX:XAUUSD is attempting to recover to $5,000 after a sharp 3.5% drop on Thursday. There are no clear reasons for this. All market attention is focused on today's US inflation report - CPI.
Yesterday's gold sell-off was caused not only by technical factors, but also by capital flight to the dollar amid renewed fears surrounding AI. There was no news driver, the market was overstretched, and the sharp momentum of the dollar triggered sell-offs (liquidations) in the markets.
Despite strong NFP, the market is still pricing in at least two rate cuts this year.
Ahead is CPI — the main trigger: Forecast — Core CPI slowdown to 2.5% y/y. If inflation turns out to be higher than expected, the market will reassess the Fed's plans, which will strengthen the dollar and hit gold.
High volatility is inevitable today.
Resistance levels: 4990, 5100
Support levels: 4944, 4902
Technically, local and global trends are bullish, and any correction could quickly end in growth, especially from strong levels. A breakout of 4990 and maintaining the price above this level could confirm the bullish nature of the market. On news amid high volatility, the market may test the support of the trend and the range of 4878 - 4812.
Negative scenario: a breakout and close below 4800 could trigger a fall to 4700 - 4600.
Best regards, R. Linda!

How to turn $100 into $1,000,000 through trading?
The answer — You can’t..
Yes, theoretically you can imagine a chain of unbelievable coincidences, aggressive risk-taking, and pure luck. But in reality, that path almost always ends with a blown account long before any meaningful growth happens.
However, most people who enter this field genuinely believe they’ll be the exception. They’re convinced it will work out for them. Social media plays a big role in this — the way trading is presented: a glamorous lifestyle, freedom, expensive cars, travel, and supposedly all you have to do is press “buy” or “sell.”
✨ It creates the illusion of simplicity.
But the market isn’t a button. It’s competition.
Chasing massive returns, people start trading low-liquidity, questionable assets. They increase leverage, go all-in on their account, ignore stop losses. Risk management turns into a myth told by some crazy guy on the street, and their mental state starts resembling that same person preaching about discipline. Every trade becomes a casino bet.
🎢 First comes excitement.
😎 Then euphoria from a random win.
😤 Then aggression after a loss.
🎰 And finally — the urge to “win it back.”
And that’s exactly when the account starts melting the fastest.
💡 The truth is, a successful trader isn’t someone who makes 100x in a month.
A successful trader is someone who earns consistently.
Generating 10–14% per month with proper risk management is an extremely strong result. Most professional fund managers don’t even come close to delivering that consistently over time.
💰 With a $300,000 account — that’s a solid income you can live on.
🍦 With $100 — that’s ice cream money. And that’s okay.
📌 Now the important part.
If you want to start trading and you have $300 — great. Set it aside. But treat it not as a “life-changing opportunity,” but as tuition.
A small account should not be a gambling tool.
It should be a discipline-building tool.
It should be a system-testing tool.
It should be a habit-forming tool.
With a deposit like that, you learn to:
• respect risk per trade;
• accept losses calmly;
• avoid increasing size after a loss;
• stay out of the market when bored;
• follow rules even when emotions scream otherwise.
📈 If you can’t trade $300 consistently and with discipline, you won’t trade $30,000 successfully either. Not only profits scale — mistakes scale too.
❗ And if you quit your job with a $300 account to “fully dedicate yourself to trading,” you should probably go back.
Trading doesn’t like pressure.
When you need to pay rent, cover loans, and buy food, you start making decisions out of fear instead of following your system.
⚖️ And fear and the market are a bad combination.
First — stable income outside the market.
Then — stability on a small account.
Then — capital growth.
Enjoy!

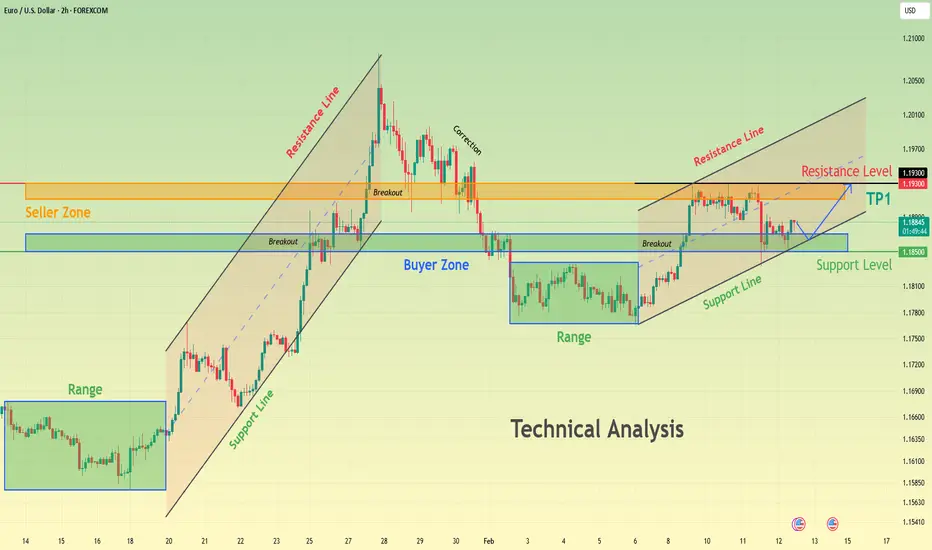
EURUSD Compressing Above Demand - Next Move IncomingHello traders! Here’s my technical outlook on EURUSD (2H) based on the current chart structure. The pair is trading within a broader bullish environment, supported by a clearly defined rising support line that has guided price higher over time. Earlier in the move, EURUSD entered a consolidation phase, forming a clean range where buyers and sellers were temporarily balanced. This range acted as an accumulation zone before a strong impulsive breakout to the upside, confirming buyer dominance and continuation of the bullish trend. Following the breakout, price accelerated aggressively and pushed into the Seller Zone / Resistance area around 1.1930, where selling pressure increased significantly. This led to a corrective pullback, as sellers defended the resistance and price retraced lower. However, the decline found support at the Buyer Zone near 1.1850, which also aligns with the broader support level and rising structure. This reaction signaled that buyers were still active and willing to defend demand, preventing a deeper breakdown and maintaining the overall bullish structure. Currently, EURUSD is consolidating above the Buyer Zone and holding above the key support level, while respecting the rising channel structure. Price action shows compression just above support, suggesting absorption of selling pressure rather than distribution. Multiple breakout attempts from this area indicate that buyers are gradually regaining control, while sellers are struggling to push price decisively below demand. This type of consolidation after a corrective move often precedes another impulsive leg higher. My primary scenario favors bullish continuation, as long as EURUSD holds above the 1.1850 Buyer Zone and continues to respect the ascending support line. A confirmed breakout and acceptance above the current consolidation would open the path toward the 1.1930 Resistance / Seller Zone (TP1), where sellers may attempt to react again. A clean breakout above this resistance would further strengthen the bullish case and signal continuation of the broader uptrend. On the other hand, a decisive breakdown below the Buyer Zone and loss of structural support would invalidate the bullish setup and shift focus toward a deeper corrective phase. For now, structure, trend, and price behavior continue to favor buyers. Please share this idea with your friends and click Boost 🚀
EURUSD - Will it break the resistance?EURUSD is currently trading within a well-defined 4-hour structure, where both support and resistance are clearly mapped by fair value gaps. After a strong recovery from the lows, price has entered a consolidation phase just below a key resistance zone. The market is now reacting precisely to higher-timeframe imbalances, making the 4-hour FVG levels critical in determining the next directional move. The coming sessions will likely revolve around whether resistance gives way or whether another temporary pullback occurs before continuation.
Bullish 4H Support Bounces
EURUSD has consistently found support within the 4-hour bullish FVG zones below current price. Each time the pair retraced into these imbalances, buyers stepped in decisively, producing strong bounces. This repeated reaction confirms that demand remains active at these levels and that market participants are defending this support structure. As long as price continues to respect the 4-hour bullish FVG and closes above it, the short-term structure remains constructive. These bounces suggest accumulation rather than distribution, reinforcing the idea that the market may be preparing for another leg higher.
Bearish 4H FVG Resistance
The key resistance level currently capping price is the 4-hour bearish FVG above. This zone has limited upside attempts and acts as the main barrier for further continuation. It represents an area where selling pressure previously entered the market, and it is now functioning as supply. If EURUSD manages to break through this bearish 4-hour FVG with strength and conviction, it would signal that buyers have absorbed the remaining supply. Such a breakout would likely open the path for price to revisit the previous highs and potentially extend beyond them.
The Highs
Above the current structure lie the relative highs, which represent a clear liquidity target. These highs contain resting stop orders and buy-side liquidity that the market is naturally drawn toward. Given the consistent support from the bullish 4-hour FVG and the compression beneath resistance, the probability increases that EURUSD will attempt to take out these highs. A sweep of this liquidity would complete the current structure and could trigger momentum continuation if buyers remain in control.
Conclusion
EURUSD remains technically supported by strong 4-hour bullish FVG reactions while facing clear resistance at the bearish 4-hour FVG overhead. As long as support continues to hold, the bias leans toward an eventual breakout above resistance and a move to take out the highs. The market is approaching a decision point, and a clean break above the bearish FVG would likely confirm the next bullish expansion phase.
-------------------------
Thanks for your support. If you enjoyed this analysis, make sure to follow me so you don't miss the next one. And if you found it helpful, feel free to drop a like 👍 and leave a comment 💬, I’d love to hear your thoughts!

Elise | BTCUSD · 30M – Liquidity Reaction StructureBITSTAMP:BTCUSD
After taking external liquidity above 71,000 earlier, BTC shifted bearish and compressed into HTF demand. The recent sweep below 66,000 triggered a strong reaction, suggesting short-term upside toward internal resistance. Upside remains corrective unless structure breaks above 69,000–70,000.
Key Scenarios
✅ Bullish Case 🚀 →
🎯 68,500
🎯 69,200
🎯 70,600
❌ Bearish Case 📉 →
Lose 65,800 support
🎯 64,800
🎯 63,900
Current Levels to Watch
Resistance 🔴: 68,500 & 70,600
Support 🟢: 65,800 – 66,100
⚠️ Disclaimer: For educational purposes only. Not financial advice.

XAU/USD | Gold Facing Key $5000 Decision Level! (READ)By analyzing the #Gold chart on the 1-hour timeframe, we can see that last night price suddenly dropped more than $180 and entered the $4870 area. After that, Gold made a strong rebound and rallied back to $4999, where it reacted to the psychological $5000 resistance.
Today, after another pullback to $4935, CPI data pushed Gold higher again. Once more, price reached $4999 but faced a strong rejection from this key level and dropped to $4971. After several sharp moves in this zone, Gold is now trading around $4990.
Right now, the break or rejection of the psychological $5000 level will decide the next major move. Keep a close eye on price reaction around $5000. This analysis will be updated as soon as we see a clear move.
Please support me with your likes and comments to motivate me to share more analysis with you and share your opinion about the possible trend of this chart with me !
Best Regards , Arman Shaban

Gold Price Analysis – Resistance and Support LevelsThis chart highlights crucial price levels for gold, including Key Resistance Level at 5,440.457, where a breakout or price rejection may occur. The Minor Resistance at 5,112.237 could lead to a potential reversal. The Support Zone around 5,062.548 is being tested, with the expectation for price stabilization or a potential bounce. Critical Support at 4,980.486 is a key level for a possible bullish reversal, while Major Support at 4,704.862 could provide strong reversal potential. Extreme Support at 4,500.854 is identified as a significant reversal zone, where price is likely to find strong support and could trigger a sharp bullish recovery.

XAUUSD: Range Holding Strong - Upside Expansion PossibleHello everyone, here is my breakdown of the current XAUUSD setup.
Market Analysis
XAUUSD previously experienced a strong bearish impulse, breaking decisively below a key support area and triggering an acceleration to the downside. This sell-off marked a clear loss of bullish control and led to a deep corrective phase. After forming a local bottom, price began to recover and transitioned into a consolidation phase, signaling a slowdown in selling pressure. During this recovery, Gold started forming higher lows while respecting a rising triangle support line, indicating that buyers were gradually stepping back into the market. As price continued to stabilize, XAUUSD broke above the descending triangle resistance line, confirming a short-term structural shift in favor of buyers. Following this breakout, price entered a well-defined range above the support zone, showing acceptance above demand rather than an immediate rejection. Multiple breakout and retest behaviors around the support area suggest that buyers are actively defending this level. The market is now compressing within this range, reflecting absorption of supply and preparation for a potential directional move.
Currently, XAUUSD is trading above the key support zone around 5,040–5,060, while holding structure above the rising triangle support line. Price action remains constructive, with recent pullbacks appearing corrective rather than impulsive. This behavior suggests that bearish attempts are being absorbed, and buyers maintain short-term control as long as price stays above support.
My Scenario & Strategy
My primary scenario favors a bullish continuation, provided XAUUSD continues to hold above the 5,040 support zone and respects the ascending triangle support line. Consolidation above demand indicates accumulation rather than distribution. A confirmed breakout and acceptance above the current range would open the path toward the 5,180 resistance zone (TP1), which aligns with a major resistance and previous supply area. This level is expected to attract selling pressure, making it a key upside objective.
However, a decisive breakdown and acceptance below the support zone and triangle support line would invalidate the bullish scenario and signal a return of bearish pressure, potentially leading to a deeper corrective move. Until that happens, market structure and price behavior continue to favor buyers.
That’s the setup I’m tracking. Thank you for your attention, and always manage your risk.

EUR/USD - Triangle Breakout | Sellers in Control📊 Technical Overview TICKMILL:EURUSD
EUR/USD formed a clear symmetrical triangle pattern on the M30 timeframe, showing consolidation after a strong impulsive move.
✅Price rejected precisely from a higher-timeframe bearish order block, confirming strong supply in that zone.
✅The recent break below the triangle structure signals a potential continuation to the downside. Momentum is now favoring sellers as price trades below the structure.
✅If bearish pressure continues, the next target sits around the 1.1800 psychological level, followed by the lower marked key demand zone.
🎯 Key Levels to Watch
• Bearish Order Block (major resistance)
• 1.1800 Psychological Level
• Lower Key Support Zone
A sustained move below 1.1800 could accelerate downside momentum.
✅ Support this analysis with a
LIKE 👍 | COMMENT 💬 | FOLLOW 🔔
It helps a lot & keeps the ideas coming!
⚠️ Disclaimer: This analysis is for educational purposes only.

Bitcoin 10X Long with 689% profits potentialIt's been several days since Bitcoin hit bottom, six days now.
The drop that started 14-January 2026 was composed of strong bearish momentum; it was lower, followed by lower and then more lower. The longest stop was one or two days, never more than that. There was nothing weak about the drop.
Bitcoin isn't dropping anymore. The RSI oversold, the highest volume ever, etc. All those signals that I showed you multiple times are better now, stronger now—this is a great entry. The classic retrace is over, etc. There is so much supporting a bullish advance... You cannot miss this.
Ok. Bitcoin is bullish because it isn't bearish.
Bitcoin is set to rise because the altcoins are already rising.
›› The altcoins crashed first in 2025 then came Bitcoin.
›› The altcoins recover first in 2026 then comes Bitcoin.
Here you have the full trade-numbers with 10X.
___
LONG BTCUSDT
Leverage: 10X
Potential: 689%
Allocation: 3%
Entry zone: $60,000 - $67,000
Targets:
1) $69,800
2) $75,625
3) $85,300
4) $93,100
5) $100,911
6) $112,033
Stop: Close weekly below $57,000
____
Remember, it is possible that not only "the first leg down is over," but, the entire bear market. It is possible that the bear market is already over and we are set to experience long-term growth.
The bear market is over you say? Possible, I said.
Over or not over, we are going up.
Namaste.

ETHUSD 2H ANALYSIS ( MUST READ IT )Hello traders
Here's my first idea about ETHEREUM ETHUSD and what do think about it ? Kindly share your idea about ETHEREUM ETHUSD with me in comment section
Key Points 😊
Resistance zone : 2.030/2.040
First Target 1,855
Second Target 1,780
Don't forget to share this with your friends and family and stay with us for more updates on ETHEREUM ETHUSD

GOLD Consolidation may test support levelsGold showed weakness yesterday, creating bearish momentum and extending its decline.
However, on Friday, gold rebounded from a nearly one-week low in the previous session. Investors are now waiting for key U.S. inflation data for fresh clues on the direction of interest rate cuts, especially after stronger-than-expected U.S. jobs data reduced expectations for aggressive rate cuts from the Federal Reserve.
Gold is currently showing price weakness if selling pressure continues, price may test support levels at 4902 to 4805 a break below 4902 could accelerate further downside momentum If price maintains bullish momentum and breaks above the upper resistance zone Gold may rebound toward 5010 / 5040 However, upside potential may be limited due to underlying weakness.
You may find more details in the chart,
Trade wisely best of luck buddies.
Ps; Support with like and comments for better analysis Thanks for Supporting.

XAU/USD | Going back to 5000? (READ THE CAPTION)Just like the other forex pairs, gold experienced a massive drop in price yesterday, over 1000 pips in a few seconds! This drop made up several Volume Imbalances and Liquidity Voids and Gold went as low as 4878! But after today's NDOG, Gold made an upwards move, going as high as 4997, but failed to go back above $5000.
Currently Gold is being traded at 4975 and it is inside the Feb 9th NWOG zone.
If Gold holds itself above the NWOG Midpoint (Consequent Encroachment), the targets for it will be: 4980, 4990, 5000, 5010 and 5020.
But if it fails: 4965, 4955, 4945 and 4935.

BTCUSDTHello Traders! 👋
What are your thoughts on BITCOIN?
After the recent sharp decline, Bitcoin has entered a clear consolidation range. The upper and lower boundaries of this range are marked on the chart.
As long as price remains inside this range, we should not expect a strong directional move. Instead, price action is likely to remain choppy with back-and-forth movements
At this stage, patience is key. The next meaningful move will likely come only after a confirmed breakout from one of the range boundaries.
Bullish Scenario:
A breakout and 4H close above the resistance zone could trigger upside continuation toward the highlighted target levels.
Bearish Scenario:
A breakdown and close below the support zone could lead to further downside toward the previous low.
Until one of these levels is decisively broken, the market remains range-bound.
Don’t forget to like and share your thoughts in the comments! ❤️

GOLD (XAU/USD): May Drop, Here is WHY📉Gold is currently showing a bullish recovery trend on a daily chart.
Following the formation of two equal highs, the price started to consolidate on a significant horizontal resistance level.
Subsequent to this consolidation, the pair is now displaying clear bearish signals.
I have observed the formation of a bearish imbalance candle, and there appears to be persistent bearish pressure after yesterday's US news.
It is highly probable that the pair will decline to at least 4820.

ETH/USD Decision Points for Next MoveEthereum is currently exhibiting a textbook bullish reversal structure as it stabilizes within a high-confluence demand zone between $1,800 and $1,900. After a period of bearish dominance, the price action is shifting from a sequence of lower lows to a potential Market Structure Shift (MSS), evidenced by the aggressive absorption of sell orders in the current green accumulation block. The projected red path suggests a "liquidity sweep" or stop-hunt is likely—a move designed to flush out late retail shorts and hunt sell-side liquidity before the real impulsive move begins. If ETH holds this structural support, the technical setup points toward a powerful rally to retest the $2,250 resistance, with a successful breakout there confirming a medium-term trend reversal toward the $2,500 psychological level.

Selena | XAUUSD · 30M – Bullish Structure Inside Rising ChannelFOREXCOM:XAUUSD PEPPERSTONE:XAUUSD
After the aggressive sell-side sweep, buyers regained control and pushed price back into a structured bullish channel. The current strong consolidation under 5,100 suggests accumulation before a potential expansion move. As long as price holds above the internal demand at 4,960–4,980, upside liquidity remains the primary objective.
Key Scenarios
✅ Bullish Case 🚀
• Hold above 5060
• 🎯 Target 1: 5,120
• 🎯 Target 2: 5,180
• 🎯 Target 3: 5,240+
❌ Bearish Case 📉
• Breakdown below 4,960
Current Levels to Watch
Resistance 🔴: 5,100–5,120
Support 🟢: 4,960–4,980
⚠️ Disclaimer: This analysis is for educational purposes only. Not financial advice.

EURUSD is Nearing a Decent Support!Hey Traders, in today's trading session we are monitoring EURUSD for a buying opportunity around 1.18200 zone, EURUSD is trading in an uptrend and currently is in a correction phase in which it is approaching the trend a 1.18200 support and resistance area.
Trade safe, Joe.

XAUUSD Builds Strength Above Demand - Next Target $5,190Hello traders! Here’s my technical outlook on XAUUSD (3H) based on the current chart structure. Gold is trading within a broader bullish market structure, supported by a well-defined rising trend line that has guided price higher over time. Earlier in the move, price entered a consolidation phase, forming a clear range where buyers and sellers were in temporary balance. This range acted as an accumulation zone before a strong impulsive breakout to the upside, confirming buyer dominance and continuation of the bullish trend. After the breakout, XAUUSD accelerated sharply and reached a major pivot high, where strong selling pressure entered the market. This led to a deep corrective drop, erasing a large portion of the prior rally. However, the decline stalled at a key support area near the trend line, where price sharply reversed — a clear sign that buyers were still defending the broader bullish structure. This reaction marked a structural “turnaround” rather than a full trend reversal. Currently, gold is consolidating again above the Buyer Zone and holding above the rising trend line. Price has formed another tight range just above support, indicating compression and absorption of supply. Multiple breakout attempts from this range suggest growing bullish pressure, while the market continues to respect the demand area below. This type of consolidation after a strong recovery often signals preparation for the next impulsive move. My primary scenario favors bullish continuation as long as price holds above the Buyer Zone and the ascending trend line. A confirmed breakout and acceptance above the current range would open the path toward the Resistance / Seller Zone around 5,190, which serves as TP1 and a key area where sellers may react. A clean break above this level would further strengthen the bullish case and signal continuation of the broader uptrend. On the other hand, a decisive breakdown below support and loss of the trend line would invalidate the bullish setup and shift focus toward a deeper corrective phase. For now, structure, trend, and price behavior continue to favor buyers. Please share this idea with your friends and click Boost 🚀
