EURGBP - Doing It Again!EURGBP is once again sitting around the resistance zone.
This resistance has been respected multiple times, making it a key decision area where sellers tend to step in with confidence.
As long as EURGBP holds below this red resistance, the focus remains on short setups, looking for continuation back toward lower levels.
A clean break and acceptance above the zone would be needed to invalidate this bearish idea.
Will this resistance cap price once again… or is this the time it finally gives way? 👀
⚠️ Disclaimer: This is not financial advice. Always do your own research and manage risk properly.
📚 Stick to your trading plan regarding entries, risk, and management.
Good luck! 🍀
All Strategies Are Good; If Managed Properly!
~Richard Nasr
EUR

EURUSD: The Rejection That Changes EverythingWe're at $1.18996 in premium territory, and the market just showed its hand. A brutal 58.6% upper wick rejection at $1.19005 printed a textbook shooting star—bears defended this level with conviction. The technical structure? Messy. Higher lows meet lower highs in choppy consolidation, but the rejection signal tips the scale.
1. THE TECHNICAL REALITY 📉
• Price compressed in tight 15-pip range over 24 hours—classic pre-breakout behavior
• Trading in PREMIUM zone closer to resistance than support
• Conflicting structure: higher lows (bullish) vs. lower highs (bearish) = consolidation
• Bearish OB supply zone at $1.18210-$1.18240 acting as concrete ceiling
2. THE INDICATORS ⚖️
Bearish Signals:
• MACD bearish divergence (histogram 0.0010 vs signal 0.0013)—momentum fading
• Shooting star candle with massive 58.6% upper wick at $1.19005
• Distribution pattern from premium zone rejection
Bullish Signals:
• ADX at 71.2 confirms strong trend in play
• Ascending support trendline at $1.18000 (29 touches) still active
• BOS bullish structure technically intact
The Conflict:
RSI dead neutral at 52.5 offers zero directional conviction. We're in no-man's land—strong trend strength but fading momentum creates decision paralysis.
3. THE TRADE SETUP 🎯
🔴 Scenario A: Distribution Breakdown
• Trigger: Confirmed breakdown below $1.18900 with momentum
• Entry: $1.18880 on retest
• Target 1: $1.18550 (40 pips)
• Target 2: $1.18240 (70 pips—bearish OB fill)
• Final Target: $1.18100 (support confluence)
• Stop: $1.18950 (50 pips)
🟢 Scenario B: Structure Flip
• Trigger: Bulls reclaim $1.18110 discount zone + CHoCH bullish
• Entry: 4H close above $1.18240
• Target: $1.18260 (weak high retest)
• Invalidation: Failure to hold above bearish OB at $1.18240
MY VERDICT
This is a 58% confidence setup—not high-conviction. The rejection wick and premium positioning favor shorts, but choppy structure demands smaller position sizing. Patience is the play. Don't force trades in consolidation. Wait for the market to show its hand: either a clean breakdown with momentum or a structural flip above $1.18240. React with precision, don't predict with hope.

Bearish reversal off key resistance?Cable (GBP/USD) is rising towards the pivot and could reverse to the 38.2% Fibonacci support.
Pivot: 1.3710
1st Support: 1.3627
1st Resistance: 1.3782
Disclaimer:
The opinions given above constitute general market commentary and do not constitute the opinion or advice of IC Markets or any form of personal or investment advice.
Any opinions, news, research, analyses, prices, other information, or links to third-party sites contained on this website are provided on an "as-is" basis, are intended to be informative only, and are not advice, a recommendation, research, a record of our trading prices, an offer of, or solicitation for, a transaction in any financial instrument and thus should not be treated as such. The information provided does not involve any specific investment objectives, financial situation, or needs of any specific person who may receive it. Please be aware that past performance is not a reliable indicator of future performance and/or results. Past performance or forward-looking scenarios based upon the reasonable beliefs of the third-party provider are not a guarantee of future performance. Actual results may differ materially from those anticipated in forward-looking or past performance statements. IC Markets makes no representation or warranty and assumes no liability as to the accuracy or completeness of the information provided, nor any loss arising from any investment based on a recommendation, forecast, or any information supplied by any third party

EURGBP | FRGNT DAILY FORECAST | Q1 | W6 | D10 | Y26📅 Q1 | W6 | D10 | Y26
📊 EURGBP | FRGNT DAILY FORECAST |
🔍 Analysis Approach
I’m applying a developed version of Smart Money Concepts, with a structured focus on:
• Identifying Key Points of Interest (POIs) on Higher Time Frames (HTFs) 🕰️
• Using those POIs to define a clear and controlled trading range 📐
• Refining those zones on Lower Time Frames (LTFs) 🔎
• Waiting for a Break of Structure (BoS) as confirmation ✅
This process keeps me precise, disciplined, and aligned with market narrative, rather than reacting emotionally or chasing price.
💡 My Motto
“Capital management, discipline, and consistency in your trading edge.”
A positive risk-to-reward ratio, combined with a high-probability execution model, is the backbone of any sustainable trading plan 📈🔐
⚠️ On Losses
Losses are part of the mathematical reality of trading 🎲
They don’t define you — they are necessary, expected, and managed.
We acknowledge them, learn, and move forward 📊➡️
🙏 I appreciate you taking the time to review my Daily Forecast.
Further context and supporting material can be found in the Links section.
Stay sharp 🧠
Stay consistent 🎯
Protect your capital 🔐
— FRGNT 🚀📈
FX:EURGBP

Could we see a bounce from here?EUR/NZD is falling towards the support level, which is a pullback support that aligns with the 78.6% Fibonacci retracement and could bounce from this level to our take profit.
Entry: 1.96379
Why we like it:
There is a pullback support level that aligns with the 78.6% Fibonacci retracement.
Stop loss: 1.95616
Why we like it:
There is an overlap support that lines up with the 78.6% Fibonacci projection.
Take profit: 1.97775
Why we like it:
There is a pullback resistance level.
Enjoying your TradingView experience? Review us!
Please be advised that the information presented on TradingView is provided to Vantage (‘Vantage Global Limited’, ‘we’) by a third-party provider (‘Everest Fortune Group’). Please be reminded that you are solely responsible for the trading decisions on your account. There is a very high degree of risk involved in trading. Any information and/or content is intended entirely for research, educational and informational purposes only and does not constitute investment or consultation advice or investment strategy. The information is not tailored to the investment needs of any specific person and therefore does not involve a consideration of any of the investment objectives, financial situation or needs of any viewer that may receive it. Kindly also note that past performance is not a reliable indicator of future results. Actual results may differ materially from those anticipated in forward-looking or past performance statements. We assume no liability as to the accuracy or completeness of any of the information and/or content provided herein and the Company cannot be held responsible for any omission, mistake nor for any loss or damage including without limitation to any loss of profit which may arise from reliance on any information supplied by Everest Fortune Group.

Bearish reversal off 50% Fib resistance?Fiber (EUR/USD) has rejected off the pivot, which has been identified as a pullback resistance that aligns with the 50% Fibonacci retracement and could drop to the 1st support.
Pivot: 1.1931
1st Suport: 1.1842
1st Resistance: 1.1991
Disclaimer:
The opinions given above constitute general market commentary and do not constitute the opinion or advice of IC Markets or any form of personal or investment advice.
Any opinions, news, research, analyses, prices, other information, or links to third-party sites contained on this website are provided on an "as-is" basis, are intended to be informative only, and are not advice, a recommendation, research, a record of our trading prices, an offer of, or solicitation for, a transaction in any financial instrument and thus should not be treated as such. The information provided does not involve any specific investment objectives, financial situation, or needs of any specific person who may receive it. Please be aware that past performance is not a reliable indicator of future performance and/or results. Past performance or forward-looking scenarios based upon the reasonable beliefs of the third-party provider are not a guarantee of future performance. Actual results may differ materially from those anticipated in forward-looking or past performance statements. IC Markets makes no representation or warranty and assumes no liability as to the accuracy or completeness of the information provided, nor any loss arising from any investment based on a recommendation, forecast, or any information supplied by any third party

EURUSD H1 | Bullish ReversalThe price is falling towards our buy entry level at 1.1798, which is a pullback support that aligns with the 50% Fibonacci retracement.
Our stop loss is set at 1.1775, which is a multi-swing low support.
Our take profit is set at 1.1860, which is a pullback resistance.
High Risk Investment Warning
Stratos Markets Limited fxcm.com Stratos Europe Ltd fxcm.com
CFDs are complex instruments and come with a high risk of losing money rapidly due to leverage. 69% of retail investor accounts lose money when trading CFDs with this provider. You should consider whether you understand how CFDs work and whether you can afford to take the high risk of losing your money.
Stratos Global LLC fxcm.com Losses can exceed deposits.
Please be advised that the information presented on TradingView is provided to FXCM (‘Company’, ‘we’) by a third-party provider (‘TFA Global Pte Ltd’). Please be reminded that you are solely responsible for the trading decisions on your account. Any information and/or content is intended entirely for research, educational and informational purposes only and does not constitute investment or consultation advice or investment strategy. The information is not tailored to the investment needs of any specific person and therefore does not involve a consideration of any of the investment objectives, financial situation or needs of any viewer that may receive it. Past performance is not a reliable indicator of future results. Actual results may differ materially from those anticipated in forward-looking or past performance statements. We assume no liability as to the accuracy or completeness of any of the information and/or content provided herein and the Company cannot be held responsible for any omission, mistake nor for any loss or damage including without limitation to any loss of profit which may arise from reliance on any information supplied by TFA Global Pte Ltd.
Stratos Trading Pty. Limited fxcm.com
Trading FX/CFDs carries significant risks. FXCM AU (AFSL 309763), please read the Financial Services Guide, Product Disclosure Statement, Target Market Determination and Terms of Business at fxcm.com

Bullish bounce off?Fiber (EUR/USD) has bounced off the pivot, which acts as a pullback support that aligns with the 61.8% Fibonacci retracement and could potentially rise to the 1st resistance, which has been identified as a swing high resistance.
Pivot: 1.1791
1st Support: 1.1550
1st Resistance: 1.2080
Disclaimer:
The opinions given above constitute general market commentary and do not constitute the opinion or advice of IC Markets or any form of personal or investment advice.
Any opinions, news, research, analyses, prices, other information, or links to third-party sites contained on this website are provided on an "as-is" basis, are intended to be informative only, and are not advice, a recommendation, research, a record of our trading prices, an offer of, or solicitation for, a transaction in any financial instrument and thus should not be treated as such. The information provided does not involve any specific investment objectives, financial situation, or needs of any specific person who may receive it. Please be aware that past performance is not a reliable indicator of future performance and/or results. Past performance or forward-looking scenarios based upon the reasonable beliefs of the third-party provider are not a guarantee of future performance. Actual results may differ materially from those anticipated in forward-looking or past performance statements. IC Markets makes no representation or warranty and assumes no liability as to the accuracy or completeness of the information provided, nor any loss arising from any investment based on a recommendation, forecast, or any information supplied by any third party

Could we se a bounce from here?EUR/USD is falling towards the support, which is a pullback support, and could bounce from this level to our take profit.
Entry: 1.1799
Why we like it:
There is a pullback support level.
Stop loss: 1.1756
Why we like it:
There is a pullback support level.
Take profit: 1.1860
Why we like it:
There is a pullback resistance level.
Enjoying your TradingView experience? Review us!
Please be advised that the information presented on TradingView is provided to Vantage (‘Vantage Global Limited’, ‘we’) by a third-party provider (‘Everest Fortune Group’). Please be reminded that you are solely responsible for the trading decisions on your account. There is a very high degree of risk involved in trading. Any information and/or content is intended entirely for research, educational and informational purposes only and does not constitute investment or consultation advice or investment strategy. The information is not tailored to the investment needs of any specific person and therefore does not involve a consideration of any of the investment objectives, financial situation or needs of any viewer that may receive it. Kindly also note that past performance is not a reliable indicator of future results. Actual results may differ materially from those anticipated in forward-looking or past performance statements. We assume no liability as to the accuracy or completeness of any of the information and/or content provided herein and the Company cannot be held responsible for any omission, mistake nor for any loss or damage including without limitation to any loss of profit which may arise from reliance on any information supplied by Everest Fortune Group.

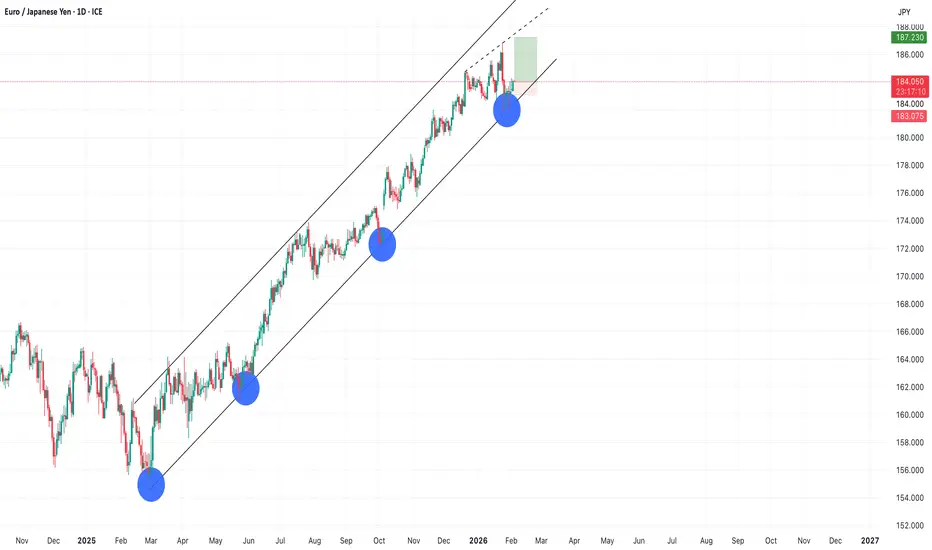
EURJPY LongWe are currently observing a strong uptrend in the EUR/JPY pair. Price action remains well supported within the ascending channel, showing no signs of a breakdown. I expect the pair to print a new high. In the event of a reversal, risk can be managed by placing a stop loss below the previous day’s low.
EURCAD BuyEURCAD is holding strong above its uptrendline, signaling continued bullish momentum. The pair has formed a clear flag pattern, reflecting a brief consolidation after recent gains, while support near the trendline remains intact. This suggests buyers are still in control, and selling pressure is limited.

EURUSD | FRGNT WEEKLY FORECAST | Q1 | W6 | Y26📅 Q1 | W6 | Y26
📊 EURUSD | FRGNT WEEKLY FORECAST |
🔍 Analysis Approach
I’m applying a developed version of Smart Money Concepts, with a structured focus on:
• Identifying Key Points of Interest (POIs) on Higher Time Frames (HTFs) 🕰️
• Using those POIs to define a clear and controlled trading range 📐
• Refining those zones on Lower Time Frames (LTFs) 🔎
• Waiting for a Break of Structure (BoS) as confirmation ✅
This process keeps me precise, disciplined, and aligned with market narrative, rather than reacting emotionally or chasing price.
💡 My Motto
“Capital management, discipline, and consistency in your trading edge.”
A positive risk-to-reward ratio, combined with a high-probability execution model, is the backbone of any sustainable trading plan 📈🔐
⚠️ On Losses
Losses are part of the mathematical reality of trading 🎲
They don’t define you — they are necessary, expected, and managed.
We acknowledge them, learn, and move forward 📊➡️
🙏 I appreciate you taking the time to review my Daily Forecast.
Further context and supporting material can be found in the Links section.
Stay sharp 🧠
Stay consistent 🎯
Protect your capital 🔐
— FRGNT 🚀📈
FX:EURUSD

EURGBP Channel Down topped. Sell Signal.The EURGBP pair has been trading within a Channel Down since the November 14 2025 High. Yesterday the price hit the pattern's Top (Lower Highs trend-line) and got rejected exactly on the 1D MA50 (blue trend-line), similar to the previous Lower High.
That High initiated a -1.52% Bearish Leg and we expect the market to drop at least by the same % as it's the minimum Bearish Leg drop it had within this Channel Down. As a result, our Target s 0.85900, which would also make a perfect test of the 1W MA200 (red trend-line), the market's natural long-term Support.
---
** Please LIKE 👍, FOLLOW ✅, SHARE 🙌 and COMMENT ✍ if you enjoy this idea! Also share your ideas and charts in the comments section below! This is best way to keep it relevant, support us, keep the content here free and allow the idea to reach as many people as possible. **
---
💸💸💸💸💸💸
👇 👇 👇 👇 👇 👇

EURUSD Breakout and Potential Retrace!Hey Traders, in today's trading session we are monitoring EURUSD for a buying opportunity around 1.18000 zone, EURUSD was trading in a downtrend and successfully managed to break it out. Currently is in a correction phase in which it is approaching the retrace area at 1.18000 support and resistance area.
Trade safe, Joe.

EURUSD H4 | Bullish Bounce Off 61.8% Fib SupportBased on the H4 chart analysis, we can see that the price is reacting off our buy entry levle at 1.1777, which is a pullback support that aligns with the 61.8% Fibonacci retracement.
Our stop loss is set at 1.1730, which is an overlap support that aligns with the78.6% Fibonacci retracement.
Our take profit is set at 1.1939, which is a pullback resistance that aligns with the 50% Fibonacci retracement.
High Risk Investment Warning
Stratos Markets Limited fxcm.com Stratos Europe Ltd fxcm.com
CFDs are complex instruments and come with a high risk of losing money rapidly due to leverage. 69% of retail investor accounts lose money when trading CFDs with this provider. You should consider whether you understand how CFDs work and whether you can afford to take the high risk of losing your money.
Stratos Global LLC fxcm.com Losses can exceed deposits.
Please be advised that the information presented on TradingView is provided to FXCM (‘Company’, ‘we’) by a third-party provider (‘TFA Global Pte Ltd’). Please be reminded that you are solely responsible for the trading decisions on your account. Any information and/or content is intended entirely for research, educational and informational purposes only and does not constitute investment or consultation advice or investment strategy. The information is not tailored to the investment needs of any specific person and therefore does not involve a consideration of any of the investment objectives, financial situation or needs of any viewer that may receive it. Past performance is not a reliable indicator of future results. Actual results may differ materially from those anticipated in forward-looking or past performance statements. We assume no liability as to the accuracy or completeness of any of the information and/or content provided herein and the Company cannot be held responsible for any omission, mistake nor for any loss or damage including without limitation to any loss of profit which may arise from reliance on any information supplied by TFA Global Pte Ltd.
Stratos Trading Pty. Limited fxcm.com
Trading FX/CFDs carries significant risks. FXCM AU (AFSL 309763), please read the Financial Services Guide, Product Disclosure Statement, Target Market Determination and Terms of Business at fxcm.com

Q1 | D6 | W5 | Y26 EURGBP — FRGNT FUN COUPON FRIDAY📅 Q1 | D6 | W5 | Y26
📊 EURGBP — FRGNT FUN COUPON FRIDAY
🔍 Analysis Approach
I’m applying a developed version of Smart Money Concepts, with a structured focus on:
• Identifying Key Points of Interest (POIs) on Higher Time Frames (HTFs) 🕰️
• Using those POIs to define a clear and controlled trading range 📐
• Refining those zones on Lower Time Frames (LTFs) 🔎
• Waiting for a Break of Structure (BoS) as confirmation ✅
This process keeps me precise, disciplined, and aligned with market narrative, rather than reacting emotionally or chasing price.
💡 My Motto
“Capital management, discipline, and consistency in your trading edge.”
A positive risk-to-reward ratio, combined with a high-probability execution model, is the backbone of any sustainable trading plan 📈🔐
⚠️ On Losses
Losses are part of the mathematical reality of trading 🎲
They don’t define you — they are necessary, expected, and managed.
We acknowledge them, learn, and move forward 📊➡️
🙏 I appreciate you taking the time to review my Daily Forecast.
Further context and supporting material can be found in the Links section.
Stay sharp 🧠
Stay consistent 🎯
Protect your capital 🔐
— FRGNT 🚀📈
FX:EURGBP

Bulllish continuation?EUR/GBP is falling towards the pivot, which is an overlap support and could bounce to the 1st resistance.
Pivot: 0.8695
1st Support: 0.8670
1st Resistance: 0.8735
Disclaimer:
The opinions given above constitute general market commentary and do not constitute the opinion or advice of IC Markets or any form of personal or investment advice.
Any opinions, news, research, analyses, prices, other information, or links to third-party sites contained on this website are provided on an "as-is" basis, are intended to be informative only, and are not advice, a recommendation, research, a record of our trading prices, an offer of, or solicitation for, a transaction in any financial instrument and thus should not be treated as such. The information provided does not involve any specific investment objectives, financial situation, or needs of any specific person who may receive it. Please be aware that past performance is not a reliable indicator of future performance and/or results. Past performance or forward-looking scenarios based upon the reasonable beliefs of the third-party provider are not a guarantee of future performance. Actual results may differ materially from those anticipated in forward-looking or past performance statements. IC Markets makes no representation or warranty and assumes no liability as to the accuracy or completeness of the information provided, nor any loss arising from any investment based on a recommendation, forecast, or any information supplied by any third party

EURUSD Market StructureEURUSD is trading mid-range.
London is set to push price into a key area: 1.1798–1.1803.
This suggests potential delivery into premium as we head into NY.
HTF bias remains bearish.
I’m only interested in shorts after premium is tapped and structure confirms.
No confirmation, no trade.
If it shows up, I execute.
If not, I stay flat.

EURGBP — FRGNT DAILY FORECAST Q1 | D5 | W5 | Y26📅 Q1 | D5 | W5 | Y26
📊 EURGBP — FRGNT DAILY FORECAST
🔍 Analysis Approach
I’m applying a developed version of Smart Money Concepts, with a structured focus on:
• Identifying Key Points of Interest (POIs) on Higher Time Frames (HTFs) 🕰️
• Using those POIs to define a clear and controlled trading range 📐
• Refining those zones on Lower Time Frames (LTFs) 🔎
• Waiting for a Break of Structure (BoS) as confirmation ✅
This process keeps me precise, disciplined, and aligned with market narrative, rather than reacting emotionally or chasing price.
💡 My Motto
“Capital management, discipline, and consistency in your trading edge.”
A positive risk-to-reward ratio, combined with a high-probability execution model, is the backbone of any sustainable trading plan 📈🔐
⚠️ On Losses
Losses are part of the mathematical reality of trading 🎲
They don’t define you — they are necessary, expected, and managed.
We acknowledge them, learn, and move forward 📊➡️
🙏 I appreciate you taking the time to review my Daily Forecast.
Further context and supporting material can be found in the Links section.
Stay sharp 🧠
Stay consistent 🎯
Protect your capital 🔐
— FRGNT 🚀📈
FX:EURGBP


EURUSD — FRGNT DAILY FORECAST Q1 | D5 | W5 | Y26📅 Q1 | D5 | W5 | Y26
📊 EURUSD — FRGNT DAILY FORECAST
🔍 Analysis Approach
I’m applying a developed version of Smart Money Concepts, with a structured focus on:
• Identifying Key Points of Interest (POIs) on Higher Time Frames (HTFs) 🕰️
• Using those POIs to define a clear and controlled trading range 📐
• Refining those zones on Lower Time Frames (LTFs) 🔎
• Waiting for a Break of Structure (BoS) as confirmation ✅
This process keeps me precise, disciplined, and aligned with market narrative, rather than reacting emotionally or chasing price.
💡 My Motto
“Capital management, discipline, and consistency in your trading edge.”
A positive risk-to-reward ratio, combined with a high-probability execution model, is the backbone of any sustainable trading plan 📈🔐
⚠️ On Losses
Losses are part of the mathematical reality of trading 🎲
They don’t define you — they are necessary, expected, and managed.
We acknowledge them, learn, and move forward 📊➡️
🙏 I appreciate you taking the time to review my Daily Forecast.
Further context and supporting material can be found in the Links section.
Stay sharp 🧠
Stay consistent 🎯
Protect your capital 🔐
— FRGNT 🚀📈
FX:EURUSD

Falling towards key support?Fiber (EUR/USD) is falling towards the pivot and could bounce to the 1st resistance.
Pivot: 1.1749
1st Support: 1.1691
1st Resistance: 1.1855
Disclaimer:
The opinions given above constitute general market commentary and do not constitute the opinion or advice of IC Markets or any form of personal or investment advice.
Any opinions, news, research, analyses, prices, other information, or links to third-party sites contained on this website are provided on an "as-is" basis, are intended to be informative only, and are not advice, a recommendation, research, a record of our trading prices, an offer of, or solicitation for, a transaction in any financial instrument and thus should not be treated as such. The information provided does not involve any specific investment objectives, financial situation, or needs of any specific person who may receive it. Please be aware that past performance is not a reliable indicator of future performance and/or results. Past performance or forward-looking scenarios based upon the reasonable beliefs of the third-party provider are not a guarantee of future performance. Actual results may differ materially from those anticipated in forward-looking or past performance statements. IC Markets makes no representation or warranty and assumes no liability as to the accuracy or completeness of the information provided, nor any loss arising from any investment based on a recommendation, forecast, or any information supplied by any third party

Potential bullish reversal?EUR/AUD is falling towards the support level, which is a pullback support, and could bounce from this level to our take profit.
Entry: 1.6870
Why we like it:
There is a pullback support level.
Stop loss: 1.6774
Why we like it:
There is a swing low support level.
Take profit: 1.7020
Why we like it:
There is a pullback resistance level that is slightly above the 61.8% Fibonacci retracement.
Enjoying your TradingView experience? Review us!
Please be advised that the information presented on TradingView is provided to Vantage (‘Vantage Global Limited’, ‘we’) by a third-party provider (‘Everest Fortune Group’). Please be reminded that you are solely responsible for the trading decisions on your account. There is a very high degree of risk involved in trading. Any information and/or content is intended entirely for research, educational and informational purposes only and does not constitute investment or consultation advice or investment strategy. The information is not tailored to the investment needs of any specific person and therefore does not involve a consideration of any of the investment objectives, financial situation or needs of any viewer that may receive it. Kindly also note that past performance is not a reliable indicator of future results. Actual results may differ materially from those anticipated in forward-looking or past performance statements. We assume no liability as to the accuracy or completeness of any of the information and/or content provided herein and the Company cannot be held responsible for any omission, mistake nor for any loss or damage including without limitation to any loss of profit which may arise from reliance on any information supplied by Everest Fortune Group.
