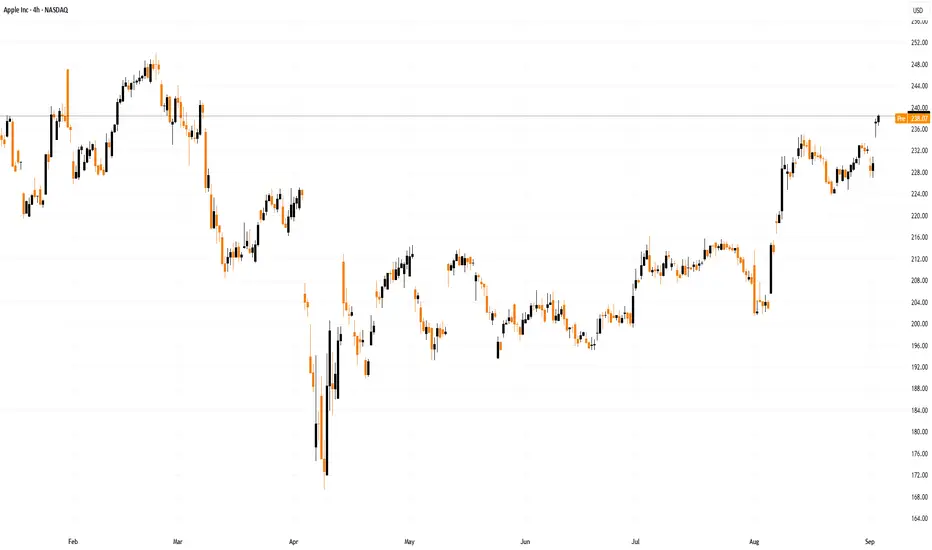
Apple (AAPL) Shares Hit an All-Time HighApple (AAPL) Shares Hit an All-Time High
On 26 September, we noted that Apple (AAPL) shares were nearing a record peak. Less than a month later, that forecast has materialised: according to the chart, AAPL surged more than 4% yesterday, surpassing its December 2024 high. This marks:
→ a new all-time record;
→ a return to second place by market capitalisation (Apple has overtaken Microsoft, while Nvidia remains in first position).
Why Are Apple Shares Rising?
→ Strong sales figures. Counterpoint Research reported that sales of the new iPhone 17 series in the US and China during the first ten days were 14% higher than those of the iPhone 16 last year. Analysts note that the base model offers significant improvements at the same price, encouraging consumers to upgrade.
→ Analyst forecasts. Loop Capital not only raised its rating to Buy (with a target price of $315) but also declared the start of a “long-awaited upgrade cycle”. In their view, this is not a short-term surge but the beginning of sustained growth in shipments expected to continue until 2027.
Optimism is also fuelled by anticipation of Apple’s upcoming earnings report and the festive shopping season, which could further accelerate iPhone 17 sales.
Technical Analysis of Apple (AAPL) Shares
Price movements in 2025 have formed a broad upward channel (shown in blue). Within this structure:
→ the channel’s median line acted as support in mid-October;
→ yesterday’s rally lifted the price into the upper quarter of the channel.
From a demand perspective:
→ Trading opened with a bullish gap (see arrow), and the price jumped rapidly in the first minutes — evidence of strong buying interest.
→ The psychological level of $250 is losing its role as resistance and may become future support.
→ The price remains within a steep rising channel (marked in orange).
From a supply perspective:
→ The RSI indicator shows overbought conditions;
→ Some investors may take profits at the new record high.
Taking these factors into account, once the current bullish momentum cools, AAPL could see a short-term pullback — potentially towards the area of the bullish gap or one of the orange trendlines (solid or dotted).
This article represents the opinion of the Companies operating under the FXOpen brand only. It is not to be construed as an offer, solicitation, or recommendation with respect to products and services provided by the Companies operating under the FXOpen brand, nor is it to be considered financial advice.
Aaplanalysis

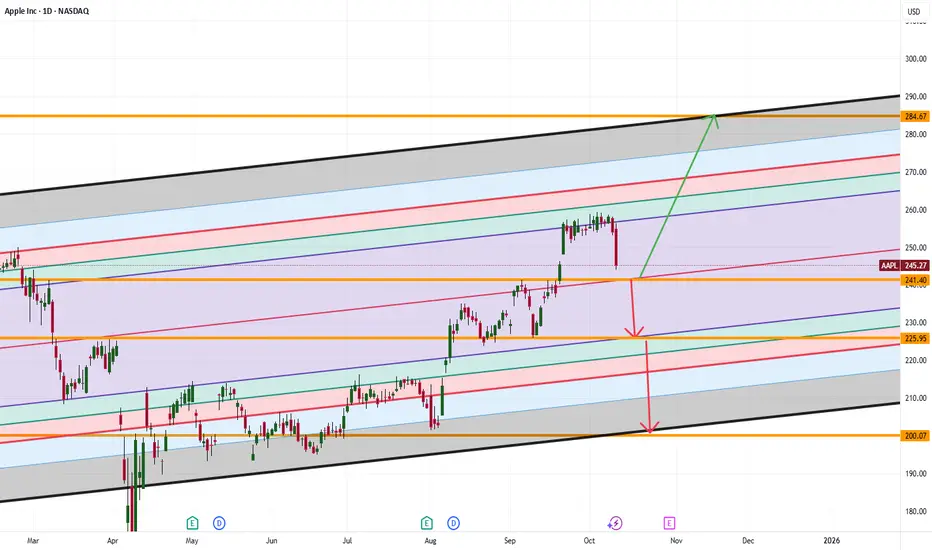
Apple’s $241 Bounce or Breakdown: Is This the Next Big Move?Apple’s stock price is moving down toward $241. This is an important zone. If Apple can stay above $241, it could jump up to $284. But if it falls below $241, the price might drop even more; maybe to $225 or even $200.
What do you think will happen next? Would you buy Apple if it drops to $241, or would you wait for a bigger move?
If you’re not sure what to do or have questions, ask me! Sometimes asking the right question gives you the answer you need to trade smarter. What’s your question about Apple right now?
Mindbloome Exchange
Trade Smarter Live Better
APPLE (AAPL) – BUY SETUP ANALYSIS | TARGET $280 | OCT 2025Current Price: $258.01
Trend: Uptrend channel (bullish)
The chart shows a rising parallel channel, and the price is currently trading near the upper region of the channel — suggesting possible short-term correction before resuming the uptrend.
🧭 Key Levels
Buy Entry Point: $223.34 – $223.68
This zone is highlighted as a strong demand/support area. Price may retrace to this zone before resuming upward.
Stop Loss: $211.44
Below this level, bullish structure would be invalidated.
Target Point: $280.74 – $280.80
This is the projected take-profit zone, aligning with the top of the channel extension.
🔍 Projection
Expected move:
Price might break below the current trend channel, retest the support zone around $223, and then bounce upward toward the $280 target.
This setup represents a buy-the-dip strategy inside a long-term uptrend.
⚠️ Risk Management
Risk-to-Reward Ratio ≈ 1:4, favorable setup.
Entry should only be considered if price confirms reversal signals (e.g., bullish candlestick patterns) near $223 support.

Apple Shares (AAPL) Close to Reaching Record HighApple Shares (AAPL) Close to Reaching Record High
On 10 September, we noted that following the launch of new products — including the iPhone 17 — AAPL shares had fallen by approximately 1.5%, as analysts considered the model lacked the breakthrough appeal necessary to drive further growth.
However, two weeks on, media reports point to strong demand for the new product range, highlighting that:
→ orders for the new devices exceed those for last year’s iPhone 16 series;
→ Apple has asked suppliers to increase production;
→ the base model, featuring the long‑awaited 120Hz display and the powerful A19 chip, is in especially high demand.
Positive reports of long queues at Apple Stores worldwide, along with extended delivery times — which Bank of America estimates at an average of 18 days compared to 10 days for last year’s model — have only bolstered bullish sentiment. AAPL shares are rising this week, even as broader market indices are falling.
Technical Analysis of Apple (AAPL) Shares
AAPL stock price movements in 2025 form a broad ascending channel (shown in blue). In this context:
→ Until early August, the price remained in a consolidation phase (shown by black lines) below the channel’s median;
→ Since then, the balance has shifted in favour of buyers — the price has demonstrated bullish momentum, forming a steep growth channel (shown in orange), with the median providing support (indicated by an arrow).
The strength of demand is confirmed by AAPL’s price action rising from $240 to $250:
→ bullish candlesticks were wide;
→ closing prices were close to the highs;
→ a bullish gap is visible on the chart.
This points to a buyers’ imbalance, giving grounds to regard this area as support in terms of a Fair Value Gap pattern.
From a bearish perspective:
→ the RSI indicator is in overbought territory;
→ shareholders may wish to take some profits.
Nevertheless, it cannot be ruled out that AAPL’s price growth will continue, driven by expectations that strong demand for the iPhone 17, as well as the updated Apple Watch Series 11 and AirPods Pro 3 with new AI features, will deliver record quarterly revenue for the company, covering the upcoming holiday season. In this scenario, bulls may target the upper boundary of the blue channel.
This article represents the opinion of the Companies operating under the FXOpen brand only. It is not to be construed as an offer, solicitation, or recommendation with respect to products and services provided by the Companies operating under the FXOpen brand, nor is it to be considered financial advice.
AAPL Bullish Swing Setup – Buy the Dip for $289 Target1. Chart Type & Timeframe
Symbol: Apple Inc. (AAPL)
Timeframe: 4H (4-hour candles)
Platform: TradingView
This is a short- to medium-term analysis, not a long-term forecast.
2. Trend Analysis
The price is in a rising channel (marked in red), meaning the overall trend is bullish.
Currently, the price is near the upper boundary of the channel, showing a possible short-term pullback before resuming upward momentum.
3. Entry & Stop-Loss
Entry Point: Around $244.32 – $244.54
This is near the lower boundary of the channel, a support zone.
Suggests waiting for a pullback before entering.
Stop Loss: Around $233.72 – $234.37
Positioned below the channel, so if price breaks this, it may signal a trend reversal (protects capital).
4. Target
Target Price: Around $288.91 – $289.13
This is significantly higher than the entry, showing a risk/reward ratio of ~4:1, which is favorable.
It aligns with projecting the channel’s trend upward.
5. Price Action Expectation
The black zig-zag line shows a pullback first, then a bounce back up from the support area (entry zone).
If price respects support, a bullish rally toward $289 can follow.
6. Key Observations
✅ Bullish Setup: Good reward potential if the price bounces at support.
✅ Clear Risk Management: Stop loss is properly placed below structure.
⚠ Caution: If price breaks below $234, trend could reverse — no trade should be held below stop loss.
Summary
This is a bullish swing trade plan for Apple:
Wait for pullback near $244 before buying.
Stop-loss below $234 to manage risk.
Target $289, giving a strong risk/reward ratio.
This plan assumes that the uptrend channel will hold and price will respect support before moving higher.

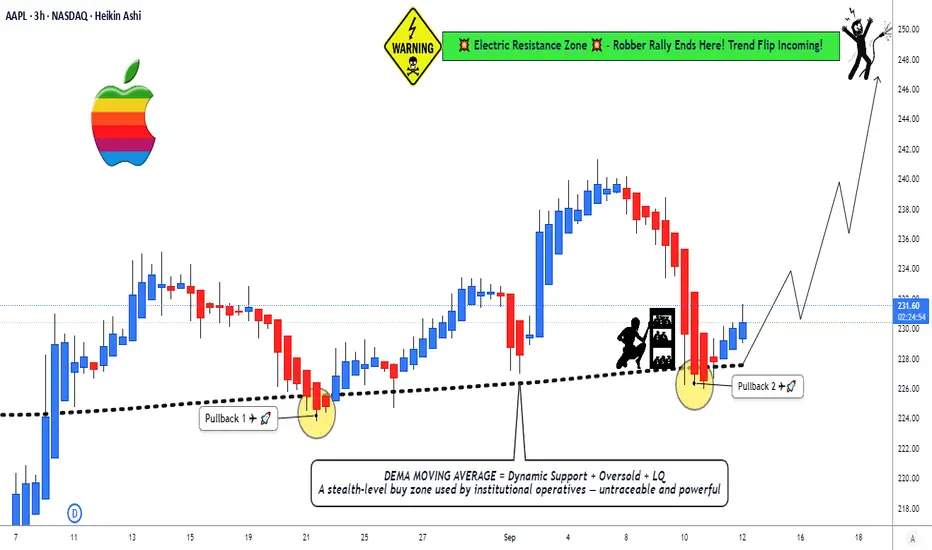
AAPL at Dynamic Support: Trade the Bounce!🍎 AAPL Swing/Day Trade: The Great Apple Heist Plan 🚨
Asset: AAPL (Apple Inc. Stock)
Market: US Stock
MarketVibe: Bullish, sneaky, and ready to loot some profits! 💰
📜 The Master Plan: Bullish EMA Pullback Heist
🎯 Strategy: We're pulling off a slick Double Exponential Moving Average (DEMA) pullback plan, targeting a breakout at dynamic support levels. Think of it as a high-stakes caper where we sneak in, grab the profits, and escape before the market knows what hit it! 😎
🔑 Key Setup Details:
Chart Setup: AAPL is showing a bullish setup with a DEMA pullback, signaling a potential swing or day trade opportunity.
Dynamic Line: We’re eyeing the DEMA as our guiding star 🌟 for entries and exits.
🚪 Entry: The Sneaky Thief Layering Strategy
🔍 How to Enter: Deploy the Thief Layering Strategy with multiple buy limit orders to maximize your entry precision:
🤑 Buy Limit Layers: Place orders at $227, $228, $229, $230 (or add more layers based on your risk appetite — you’re the mastermind here!).
💡 Pro Tip: Feel free to adjust entry levels to suit your style. The market’s your playground, so pick your spot!
🛑 Stop Loss: Protect Your Loot!
⚠️ Thief SL: Set your stop loss at $224 post-breakout to guard your stash.
Note: Dear Ladies & Gentlemen (Thief OGs 🕵️♂️), this SL is a suggestion. Adjust it based on your strategy and risk tolerance. You’re in charge of your heist, so protect your loot your way!
🎯 Target: Hit the Jackpot & Escape!
💥 Profit Target: Aim for $248, where a high-voltage resistance wall ⚡️ awaits, potentially paired with overbought conditions and a sneaky trap. Grab your profits and vanish before the market catches on!
Note: Dear Thief OGs, this target is a suggestion. Set your TP based on your goals and risk management. Take the money and run at your own discretion! 😏
👀 Related Pairs to Watch (Correlations & Opportunities)
To boost your heist, keep an eye on these correlated assets:
NASDAQ:MSFT (Microsoft): Tech giant with similar market moves to AAPL. If AAPL’s bullish, MSFT might follow suit. Watch for parallel DEMA pullbacks.
NASDAQ:QQQ (Invesco QQQ ETF): Tracks the Nasdaq-100, where AAPL is a heavy hitter. QQQ’s trend can confirm AAPL’s bullish momentum.
AMEX:SPY (SPDR S&P 500 ETF): Broad market index. If SPY’s trending up, it supports AAPL’s bullish case.
Key Correlation Insight: AAPL often moves in tandem with tech-heavy indices like QQQ. A bullish QQQ or MSFT can reinforce confidence in this trade setup.
⚡ Why This Setup Rock
Bullish Momentum: DEMA pullback signals a strong continuation pattern.
Layered Entries: Multiple limit orders reduce risk and increase flexibility.
Clear Risk Management: Defined SL and TP keep your heist disciplined.
Market Context: Tech sector strength (check QQQ/MSFT) supports AAPL’s upward move.
⚠️ Risk Disclaimer
Dear Thief OGs, this is not financial advice. The market’s a wild place, and you’re the master of your trades. Set your SL and TP based on your own risk tolerance and strategy. Steal profits wisely! 😎
✨ “If you find value in my analysis, a 👍 and 🚀 boost is much appreciated — it helps me share more setups with the community!”
#Hashtags: #AAPL #SwingTrading #DayTrading #StockMarket #ThiefStrategy #TechnicalAnalysis #Bullish #TradingView
Apple Shares (AAPL) Fall After iPhone 17 LaunchApple Shares (AAPL) Fall After iPhone 17 Launch
Yesterday, Apple unveiled its new products, including the iPhone 17. The new model features a sleeker form factor, an improved display and battery, and a new processor. However, analysts believe the model lacks the breakthrough impact needed to drive the stock higher.
The charts confirm this: while the main stock indices rose yesterday, AAPL shares fell by around 1.5%.
Technical Analysis of Apple Shares (AAPL)
When analysing the chart six days ago, we:
→ confirmed the upward channel (shown in blue);
→ highlighted the $235 support level;
→ suggested that while AAPL stock could maintain upward momentum, disappointment over the new product launch might trigger a correction.
In addition to the AAPL price action we noted earlier, several bearish signals on the hourly chart support the correction scenario:
→ a long upper shadow (marked with an arrow);
→ aggressive price action when breaking the $235 support;
→ bearish divergences on the RSI indicator.
Bulls might find support at line S, which is part of a fan drawn from the starting point of the bullish impulse on 6 August.
However, if bearish sentiment persists, price action could unfold within the structure shown in red (potentially a bull flag pattern inside the prevailing bullish trend). Bearish pressure could aim to push AAPL shares down towards the median of the red channel.
In that case, bulls may find support in the area where several lines converge:
→ the lower rays of the fan (shown in orange);
→ the psychological $230 level (which has repeatedly switched roles between resistance and support since August);
→ the median of the blue channel;
→ the lower boundary of the bullish gap from 2 September.
This article represents the opinion of the Companies operating under the FXOpen brand only. It is not to be construed as an offer, solicitation, or recommendation with respect to products and services provided by the Companies operating under the FXOpen brand, nor is it to be considered financial advice.
Apple (AAPL) Shares Jump to a Six-Month HighApple (AAPL) Shares Jump to a Six-Month High
As the AAPL chart shows, yesterday the price rose above $238 – its highest level since early March.
The optimistic sentiment was fuelled by:
→ A court ruling concerning Google, which we reported on yesterday. Apple shares advanced after the court allowed Alphabet to continue paying Apple for preloading Google Search on the iPhone. Bank of America analysts even raised their AAPL price target to $260.
→ The upcoming Apple presentation scheduled for 9 September. Expectations are that the event could unveil the iPhone 17 and new Apple Watch models, which may provide a bullish catalyst.
Technical Analysis of Apple (AAPL) Stocks
Analysing the chart in early August, we:
→ identified an ascending channel (shown in blue);
→ noted that, given the aggressive rally (accompanied by bullish gaps) and a strong fundamental backdrop, any corrections were likely to be limited.
Since then:
→ AAPL has moved higher, justifying the expansion of the blue channel;
→ the pullback (marked by an arrow) was minor, as expected, confirming the median line of the expanded channel as support;
→ in the short term, we could identify grounds for a new upward trajectory (shown in orange).
Yesterday’s price action in AAPL:
→ produced a wide bullish gap at the open (which may act as support);
→ broke through the long-term descending trendline (R), which had been acting as resistance;
→ indicated that the $235 level (around the August high) now functions as support.
Within this context, we could assume that:
→ in the short term, AAPL may maintain its upward trajectory within the orange channel;
→ in the longer term, bulls may target the upper boundary of the blue channel – located near the psychological $250 mark. Reaching this level could trigger stronger selling pressure.
In the event of a significant correction (for example, due to disappointment with new product launches), potential support levels could include:
→ the median of the blue channel;
→ the trendline R.
This article represents the opinion of the Companies operating under the FXOpen brand only. It is not to be construed as an offer, solicitation, or recommendation with respect to products and services provided by the Companies operating under the FXOpen brand, nor is it to be considered financial advice.
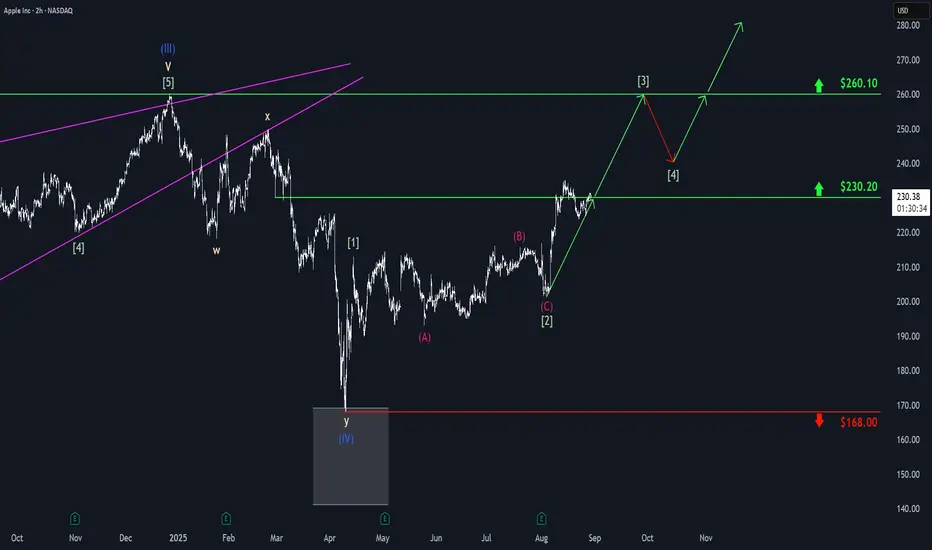
Apple: Another Run at Key ResistanceApple shortly dipped back below the $230.20 mark but has since begun another push higher. We expect the stock to soon break through the $230.20 level sustainably and – as part of the green wave – move up toward the next major resistance at $260.10. The following wave pullback should remain above $230.20, allowing the broader green upward trend to continue gaining momentum.
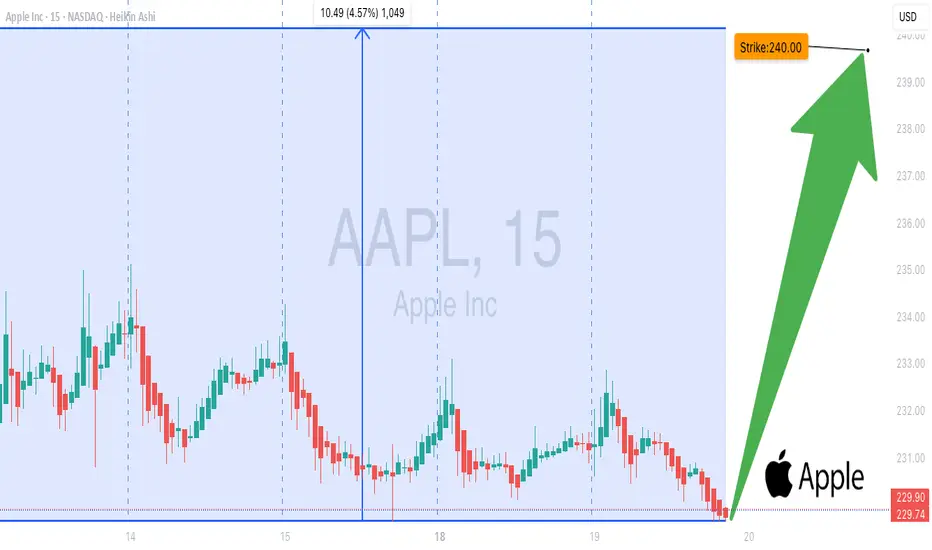
AAPL Weekly Options: $240 Call in Play!
# 🍏💥 AAPL \$240 Call Weekly Trade Setup (Aug 18, 2025) 🚀🔥
### **Market Snapshot**
📊 **Daily RSI / Weekly RSI:** Falling → Neutral ⚖️
📉 **Volume:** Weak (0.6x vs last week) 🚨
🔥 **Options Flow:** Strong bullish calls (1.84 C/P ratio) 💎
✅ **Volatility:** VIX \~15 → Favorable conditions 🌈
💡 **Overall Bias:** Moderate Bullish (but cautious on volume & momentum)
---
### **Model Highlights**
* **Agreement:**
* Weak institutional volume 📉
* Strong call buying sentiment 🔥
* Falling RSI → caution ⚠️
* **Disagreement:**
* Some lean **moderate bullish** 📈
* Others advise **no trade** due to weak confirmations ❌
---
### **💥 Trade Recommendation**
🎯 **Strategy:** Naked Call
* 🍏 **Instrument:** AAPL
* 💵 **Strike:** \$240 Call
* 🗓️ **Expiry:** Aug 22, 2025
* 💰 **Entry Price:** \$0.63
* 🎯 **Profit Target:** \$1.22 (up to 100%)
* 🛑 **Stop Loss:** \$0.37
* ⏰ **Entry Timing:** Market Open
* 📈 **Confidence:** 65%
⚠️ **Risks:**
* Momentum exhaustion 💤
* Weak volume = fragile bullish setup 🚨
* Gamma risk moderate ⚖️
---
### **Trade JSON**
```json
{
"instrument": "AAPL",
"direction": "call",
"strike": 240.00,
"expiry": "2025-08-22",
"confidence": 0.65,
"profit_target": 1.22,
"stop_loss": 0.37,
"size": 1,
"entry_price": 0.63,
"entry_timing": "open",
"signal_publish_time": "2025-08-18 14:38:09 UTC-04:00"
}
```
📊 **Quick Trade Recap:**
🎯 CALL \$240 | 💵 \$0.63 → 🎯 \$1.22 | 🛑 \$0.37 | 📅 Aug 22 | 📈 65%
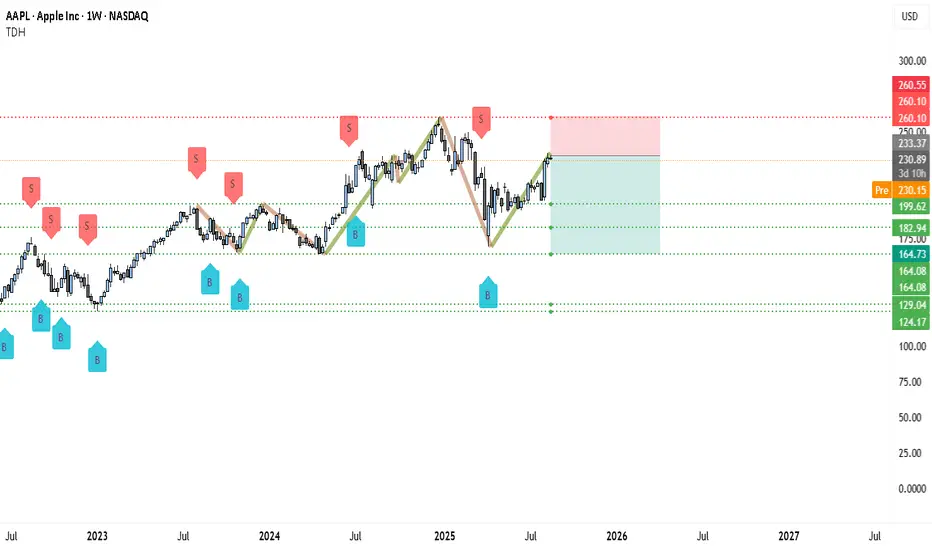
AAPL Headed for Breakdown? Bears Eye $182 Support🍎 AAPL Weekly Chart Analysis — Bearish Outlook
Apple (AAPL) is trading near $230–233 on the weekly chart after staging a rebound from early 2025 lows. The chart, however, shows a clear double-top pattern around the $260.10–260.55 resistance zone (red dashed line), which has repeatedly acted as a ceiling. Each test of this zone has been followed by sharp corrections, and the most recent “S” (sell) marker confirms this rejection area as a strong supply zone.
The latest rally has brought price back toward resistance, but structure-wise AAPL is printing lower highs and lower lows since mid-2024. The bounce into $230–233 looks more like a relief rally within a larger corrective phase rather than a fresh bullish trend.
________________________________________
🔎 Bearish Justifications
• Double/Triple Resistance Layer: $260 has capped price multiple times. Without a clear weekly close above it, bears remain in control.
• Trend Structure: From July 2024 peak to early 2025 lows, price made a decisive lower low. The current rally has failed to reclaim that structure.
• Volume Trap: Weekly candles show waning momentum on rallies—less aggressive buying versus prior uptrends.
• Clean Downside Ladder: The chart highlights green dotted support zones at $199 → $182 → $164 → $129 → $124. If $230–233 fails to hold, price could unwind quickly toward these levels.
________________________________________
🔴 AAPL Short Setup (Weekly Chart)
• Entry Zone: $230–233 rejection area (current price)
• Stop-Loss: Above $260.55 (strong invalidation level, beyond supply zone) ❌
• Target 1: $199 (psychological + technical support, book partial profits ✅)
• Target 2: $182.94 (major mid-term support, lock more gains 🔒)
• Target 3: $164.73 (deeper corrective target if selling accelerates 📉)
• Stretch Target: $129–124 if broader market weakness hits tech
________________________________________
⚠️ Risk & Trade Management
Given that this is a weekly timeframe setup, swings will be larg6e and volatile. Position sizing should be smaller than usual because stops and targets are wide. Booking partial profits at $199 and $182 is essential — this way, you reduce risk exposure and can let the remainder run. If AAPL surprisingly pushes above $260 and closes strong, the bearish thesis is invalid and shorts should exit rather than hold against trend.
✅ In summary, AAPL looks heavy under $260, with the current bounce likely a retracement rally rather than fresh bullish strength. Unless bulls can flip $260 into support, the chart favors a short bias with targets at $199 → $182 → $164.
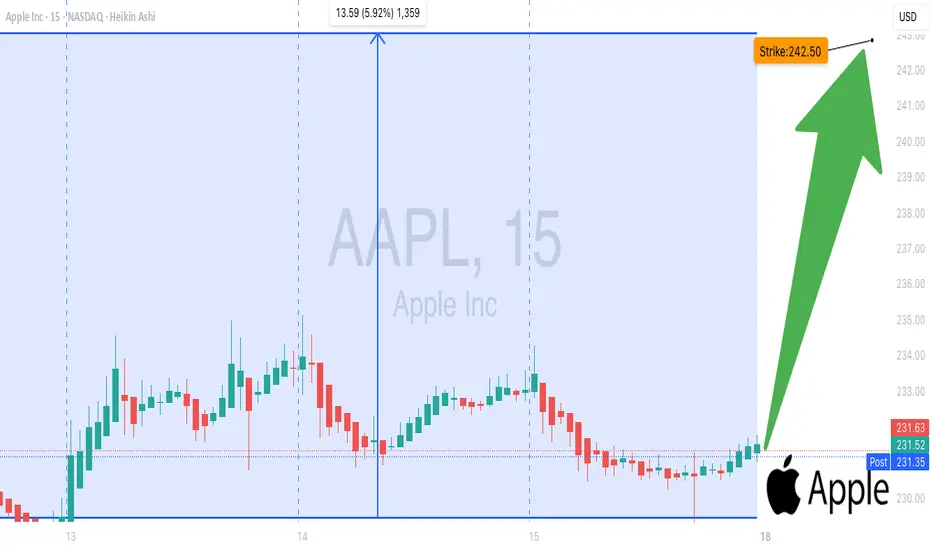
AAPL Bull Call $242.5-- Don’t Miss Out
# 🚀 AAPL Swing Alert – 2025-08-15 🚀
**Sentiment:** Moderate Bullish
**Setup:** Call Option Trade
---
## 📈 Market Snapshot
* **Daily RSI:** Strong bullish momentum
* **Multi-Timeframe Trend:** Positive
* **Call/Put Ratio:** 1.00 → Neutral flow
* **Volume:** Weak → Watch for institutional hesitation
* **VIX:** Low → Favorable for controlled swing trades
* **Resistance:** \$235.12 → Potential consolidation or pullback
---
## ⚖️ Consensus & Conflicts
**Agreement:**
* Technical indicators support bullish outlook
* Low VIX creates favorable conditions for swing trades
**Disagreement:**
* Volume metrics: some models prefer waiting for confirmation
* Psychological & fundamental resistance levels may stall momentum
---
## 🎯 Trade Setup – AAPL CALL
**Entry Condition:** Market open
**Strike:** \$242.50
**Expiration:** 2025-08-29
**Entry Price:** \$0.90
**Confidence:** 72%
**Profit Target:** \$2.65
**Stop Loss:** \$0.85
**Key Risks:**
* Weak volume may limit momentum sustainability
* Price near \$235.12 resistance → potential pullback
* Overbought RSI → watch for corrections
---
## 📝 TRADE DETAILS (JSON)
```json
{
"instrument": "AAPL",
"direction": "call",
"strike": 242.50,
"expiry": "2025-08-29",
"confidence": 0.72,
"profit_target": 2.65,
"stop_loss": 0.85,
"size": 1,
"entry_price": 0.90,
"entry_timing": "open",
"signal_publish_time": "2025-08-15 13:34:40 UTC-04:00"
}
```
---
## 📊 Quick Reference – TradingView Ready
🎯 **Instrument:** AAPL
🔀 **Direction:** CALL (Long)
💵 **Entry Price:** \$0.90
📈 **Profit Target:** \$2.65
🛑 **Stop Loss:** \$0.85
📅 **Expiry:** 2025-08-29
📏 **Size:** 1 contract
⏰ **Entry Timing:** Market Open
🕒 **Signal Time:** 2025-08-15 13:34 EDT
---
### Suggested Viral Title & Tags
**🔥 AAPL Swing Alert: Call Strike \$242.50 Ready 🚀**
\#AAPL #SwingTrade #OptionsTrading #Bullish #CallOption #Momentum #TradeSetup #TechnicalAnalysis #StockAlerts #Finance #TradingSignals #MarketWatch #LongTrade
Apple (AAPL) Shares Surge to Four-Month HighApple (AAPL) Shares Surge to Four-Month High
According to the AAPL price chart, the stock rose to the $220 level yesterday – marking its highest point since early April.
The rally was fuelled by several bullish factors:
→ Trade developments: President Trump announced an additional 25% tariff on goods from India, but notably excluded smartphones – a key point, as a significant portion of iPhones are manufactured there.
→ Seasonal momentum: Apple is approaching its historically strong period. A new iPhone model is traditionally unveiled in September, followed by the start of the holiday shopping season and strong retail demand.
Technical Analysis of Apple (AAPL) Shares
In our previous analysis, we identified an ascending channel (marked in blue) formed by price fluctuations following the April 2025 correction. A bullish reversal (highlighted with an arrow) has provided a basis to update the channel’s slope. In this configuration, the price is now in the upper half of the channel, moving towards its upper boundary.
From a price action standpoint, AAPL's rally is characterised by aggressive upward movement, accompanied by bullish gaps. This is a notable observation, suggesting that while sellers attempted to regain control during a consolidation phase in late July, they lacked conviction – with momentum now favouring the bulls.
This resembles a failed Rounding Top bearish pattern – bulls were able to push the price higher, signalling strong demand.
Potential resistance levels:
→ Near-term: The upper boundary of the channel, reinforced by the $225 level – a price point that has previously acted as a reversal zone.
→ Longer-term: A descending trendline (marked in red), drawn across key highs from recent months.
Bulls might find support at the channel median, which is further reinforced by the former resistance level of $214.
Having risen more than 8% since the start of the week, AAPL now appears overbought in the short term. However, given the strong fundamental backdrop, any potential pullbacks might prove to be shallow.
This article represents the opinion of the Companies operating under the FXOpen brand only. It is not to be construed as an offer, solicitation, or recommendation with respect to products and services provided by the Companies operating under the FXOpen brand, nor is it to be considered financial advice.
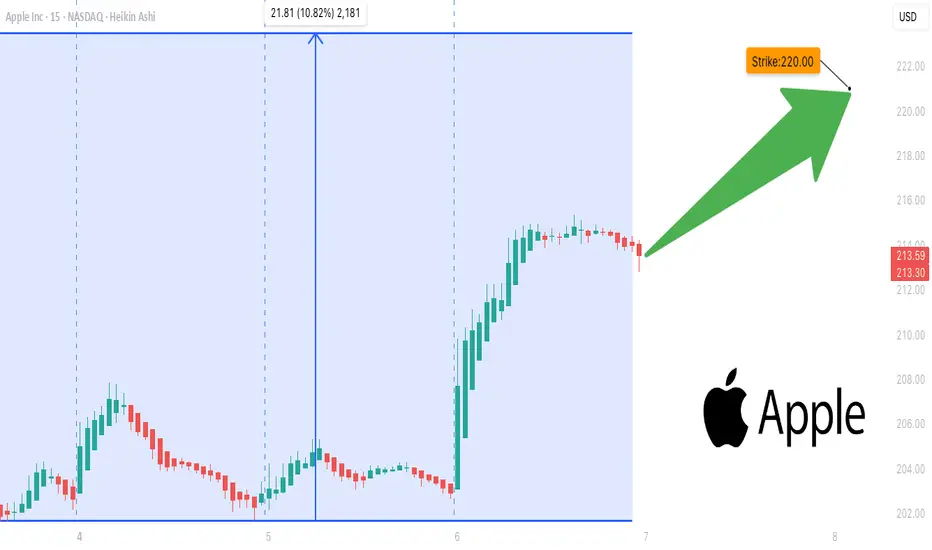
AAPL Bulls Ready to Strike## 🍎 AAPL Bulls Ready to Strike? 🚨 Weekly Options Loading...
**Call at \$220 → Entry \$0.66 → Target \$1.32 💰💰**
---
**🧠 AI Consensus Highlights:**
✔️ Strong Options Flow 📈
✔️ Institutional Volume Spike
⚠️ Caution: Bearish Daily RSI
🔀 Mixed Sentiment = Selective Entries Only
---
**🔥 Featured Trade Setup:**
* 📍 **Strike:** \$220 Call
* 💵 **Entry:** \$0.66
* 🎯 **Target:** \$1.32
* 🛑 **Stop:** \$0.33
* 📅 **Expiry:** Aug 8
* 📈 **Confidence:** 65%
* ⏰ **Entry Timing:** Open
---
**⚔️ Model Breakdown (AI Models):**
* **Grok & Claude:** Bullish → Call Recommended
* **DeepSeek & Gemini:** Cautious → No Entry
* **Meta:** Mixed → Watch RSI & Gamma Sensitivity
---
**🧠 Strategy:**
Scalp the weekly upside using a tight stop-loss + profit lock. Timing is key with high gamma volatility expected post-earnings.
---
**📛 Tags for TradingView Post:**
\#AAPL #OptionsAlert #AppleStock #EarningsPlay #CallOptions #WeeklySetup #TradingStrategy #OptionsFlow #BullishSetup #TechStocks #AITrading #InstitutionalFlow #MarketAnalysis
Apple (AAPL) Shares Jump Following Earnings ReportApple (AAPL) Shares Jump Following Earnings Report
Yesterday, after the close of the regular trading session, Apple released its earnings report, which surpassed analysts’ expectations:
→ Earnings per share: actual = $1.57, forecast = $1.43;
→ Revenue: actual = $94.04 billion, forecast = $89.35 billion.
As a result, AAPL shares surged in the post-market, rising from $207.57 to $212.51.
Media Commentary:
→ The company reported a 13% year-on-year increase in iPhone sales.
→ However, according to Tim Cook, tariffs have already cost the company $800 million and this figure could exceed $1 billion in the next quarter.
Technical Analysis of the Apple (AAPL) Stock Chart
Following the volatility in April 2025, price action has justified the construction of an ascending channel (marked in blue). The $216 level, which has acted as a key reference point since March, remains a significant resistance area, because:
→ It has consistently prevented AAPL from reaching the upper boundary of the channel;
→ Even in the wake of a strong earnings report, the price failed to break through this level in post-market trading.
If the $216 level continues to cap gains in the coming days – despite the positive report – the stock might pull back towards the median line of the blue channel (following the post-market rally). This zone often reflects a balance between supply and demand. While such a retracement would appear technically justified, it may raise concerns among shareholders, particularly when compared to the more aggressive price rallies seen in the shares of other tech giants, such as Microsoft (MSFT), as we discussed yesterday.
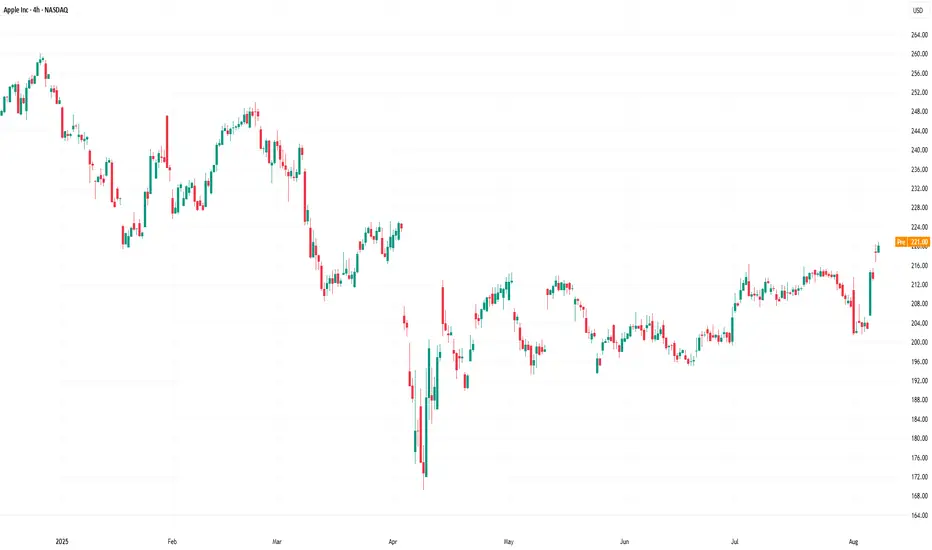
From a more pessimistic perspective, peak A may turn out to be yet another lower high within a broader bearish structure that has been forming on the AAPL chart since December 2024, when the stock reached its all-time high around the $260 level.
This article represents the opinion of the Companies operating under the FXOpen brand only. It is not to be construed as an offer, solicitation, or recommendation with respect to products and services provided by the Companies operating under the FXOpen brand, nor is it to be considered financial advice.

AAPL EARNINGS TRADE SIGNAL (JULY 31)
### 🍏 AAPL EARNINGS TRADE SIGNAL (JULY 31) 🚀
📊 **AAPL Call Play** — Earnings Strategy
🧠 Multi-model conviction: **75% Bullish Bias**
---
### 🔍 Fundamental Drivers
✅ TTM Revenue: +5.1%
✅ Gross Margin: 46.6%
✅ 8 straight earnings beats
⚠️ Sector shift: growth → value = caution
📉 TTM EPS Est: \$8.31 (+29.4% growth est.)
🧮 **Score**: 8/10
---
### 💰 Options Flow Breakdown
🔥 IV Rank: 0.70
🔵 Bullish OI @ \$220C = 25,950 contracts
🔻 Skew: Heavy puts @ \$197.5 / \$200
⚠️ Gamma squeeze possible near \$220
📈 **Score**: 8/10
---
### 📉 Technicals
📍 RSI: 39.3 (Oversold)
📉 Trading below 20DMA (\$211.64)
🟥 Low volume pre-earnings = low conviction
📌 Support: \$207.5 | Resistance: \$220
📉 **Score**: 6/10
---
### 🌐 Macro Setup
⚠️ Supply chain pressures
⚠️ Regulatory risk ongoing
🔄 Growth → Value rotation still underway
🌐 **Score**: 5/10
---
### 🧠 Trade Setup (Call Option)
* 🎯 **Strike**: \$220
* 💵 **Entry**: \$0.87
* 📅 **Expiry**: 08/01 (2DTE)
* 📈 **Target**: \$2.61
* 🛑 **Stop**: \$0.43
* ⚖️ **Risk**: 2% of portfolio
* ⏰ **Timing**: Enter before close, report after market
🧮 Expected Move: ±5.0%
🔒 Confidence Level: 75%
---
### ⚙️ Exit Plan
✅ Profit: Exit @ \$2.61
❌ Stop: Exit @ \$0.43
🕒 Time Exit: Force close within 2 hours post-earnings
---
📣 **EARNINGS SCALP PLAY**
— AAPL is oversold w/ strong EPS beat history
— Bullish OI stacking at \$220
— High gamma setup, low IV risk = 💥
\#AAPL #EarningsTrade #CallOption #TradingView #0DTE #OptionsFlow #GammaSqueeze #UnusualOptions #AppleEarnings #SwingTrade #TechStocks
AAPL can we hit 260?
Appears we are making a correction down to the levels of 208 then if that does not hold 205 with a possible drive up to the 260.
Question is are we going drive deeper with the correction ?
Be Careful folks this is a wild one
Trade Smarter Live Better
Kris/Mindbloome Exchange

Apple May Dip to $203 FVG Before Resuming UptrendFenzoFx—AAPL (Apple) is bullish, testing the $210.0 resistance while Stochastic warns of an overbought market.
A dip to the bullish FVG at $203.0 is likely before the uptrend resumes.

Apple (AAPL) Shares Consolidate Ahead of WWDCApple (AAPL) Shares Consolidate Ahead of WWDC
Today, 9 June, marks the start of Apple’s Worldwide Developers Conference (WWDC) — an event that traditionally attracts significant attention from investors and traders.
It is fair to say that WWDC 2025 begins against a rather negative backdrop:
→ Since the start of 2025, AAPL stock price has fallen by 19%, and Apple has lost its title as the world’s most valuable company, now trailing behind Microsoft and Nvidia.
→ Expectations raised by last year’s conference — particularly regarding new AI features in the iPhone — were not fully realised. As Barron’s noted, in March, an Apple spokesperson admitted that the new Siri “will take longer than we thought to implement these features. We expect to roll them out next year.”
Technical Analysis of the AAPL Chart
AAPL price movements are forming a narrowing triangle pattern:
→ The red trendline highlights sustained downward pressure on AAPL shares in 2025 — partly driven by concerns over the impact of the ongoing trade war;
→ On the other hand, the area below the psychological $200 level may attract buyers willing to take on risk.
WWDC 2025 could well provide fresh hope for the bulls and prompt an attempt to break out upwards from the triangle pattern.
This article represents the opinion of the Companies operating under the FXOpen brand only. It is not to be construed as an offer, solicitation, or recommendation with respect to products and services provided by the Companies operating under the FXOpen brand, nor is it to be considered financial advice.

Apple (AAPL) share price slips towards psychological $200 levelApple (AAPL) share price slips towards psychological $200 level
Yesterday, Apple shares (AAPL) fell by 2.5%, edging closer to the key psychological threshold of $200. Moreover, the stock is underperforming the broader market, which reached new highs earlier this week — a move AAPL has yet to replicate.
Why is AAPL’s stock price declining?
According to media reports, investors may have grown concerned after OpenAI acquired a startup founded by Jony Ive, Apple’s former chief designer, for $6.5 billion.
The move is being interpreted as OpenAI’s first step toward launching a physical AI-powered device — one that could, eventually, pose a challenge to Apple’s hardware, even if not in the near term.
Technical analysis of the AAPL chart
Bulls may be hoping the AAPL price finds support at the confluence of two key levels:
→ the psychological $200 mark;
→ support from the second half of May (the lower blue trendline).
However, the broader technical context raises some bearish concerns:
→ the $215–222 zone, which previously acted as support, is now capping price advances (as highlighted by the arrows);
→ the red descending channel appears to define the current trend trajectory — and its relevance may be reinforced if the price drops and consolidates near its median line, signalling a balance between buying and selling pressure.
This article represents the opinion of the Companies operating under the FXOpen brand only. It is not to be construed as an offer, solicitation, or recommendation with respect to products and services provided by the Companies operating under the FXOpen brand, nor is it to be considered financial advice.

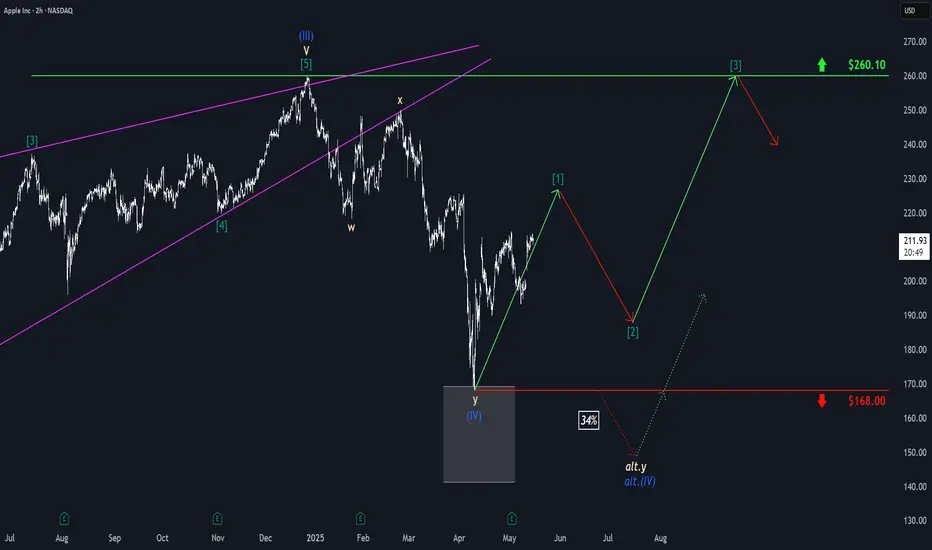
Apple: Wave [1] IntactDespite a significant setback, Apple managed to gather new momentum on the upside and continue its work on the green wave . The impulse structure remains intact, and we expect a new high imminently before the next countermovement with wave follows. The stock should not breach the support at $168 to enable wave to initiate the next upward phase. If the price does fall below the $168 mark, our 34% likely alternative scenario will allow for a new low of wave alt.(IV) in blue, though the rise would also continue after this lower low.
Apple Shares (AAPL) Drop Below $200Apple Shares (AAPL) Drop Below $200
Late last week, Apple released a quarterly report that beat analysts’ expectations:
→ Earnings per share: actual = $1.65, forecast = $1.63
→ Revenue: actual = $95.36bn, forecast = $94.5bn
However, today AAPL stock price is below the psychological $200 mark, over 7% lower than last week’s high (point E).
Why did AAPL shares fall?
According to media reports, investors were concerned about weaker-than-expected services revenue and disappointing sales in China. These factors have renewed fears that the ongoing US–China trade tensions could have a deeper impact on Apple going forward.
Bearish sentiment may also have been amplified by Warren Buffett’s decision to step down as head of Berkshire Hathaway — as we noted yesterday — since his company is one of Apple’s major shareholders.
Technical Analysis of Apple Shares (AAPL)
Key AAPL price action patterns (marked) show a sequence of lower highs and lows, forming the basis for a downward channel. Fibonacci ratios reinforce bearish characteristics in price movements:
→ The rise from B to C is approximately 50% of the decline from A to B
→ The rise from D to E is around 50% of the decline from A to D
This technical picture suggests a potential bear market, where rallies may be corrective rebounds following impulsive drops. This strengthens the scenario in which AAPL shares could continue falling within the established descending channel.
This article represents the opinion of the Companies operating under the FXOpen brand only. It is not to be construed as an offer, solicitation, or recommendation with respect to products and services provided by the Companies operating under the FXOpen brand, nor is it to be considered financial advice.

Apple (AAPL) Shares Plummet Over 9% Following Trump's TariffApple (AAPL) Shares Plummet Over 9% Following Trump's Tariff Announcement
Many stock indices declined after the US President announced the introduction of tariffs for multiple countries, as we reported yesterday morning. During yesterday’s trading session, the sell-off in equities intensified.
According to media reports, market participants had hoped that the tariff threats were mere rhetoric and a negotiation tactic. However, many were shocked by both the number of countries affected and the scale of the imposed tariffs. Several well-known technology companies led the market downturn.
How Do Trump's Tariffs Impact Big Tech Companies?
Significant tariffs were imposed on Chinese imports, yet Apple manufactures around 90% of its iPhones in China. Many affordable products sold on Amazon are also set to become more expensive, as they are sourced from China.
Meta Platforms' advertising business could suffer considerable losses as companies worldwide cut advertising budgets. Nvidia and Broadcom may also struggle, given that the tariffs apply to many electronic devices incorporating their chips.
As a result, shares of Apple (AAPL), Amazon (AMZN), Meta Platforms (META), Broadcom (AVGO), and Nvidia (NVDA) fell by approximately 9% by the close of trading yesterday.
Microsoft (MSFT) shares, however, proved more resilient, dropping just 2.3%, as software products are not easily subject to tariffs. Moreover, software developers do not rely on international supply chains.
Technical Analysis of AAPL Chart
Apple’s stock price fluctuations have formed a trend channel (shown in blue), with:
→ The upper boundary acting as resistance since last autumn, although bulls managed to push the price above it during the Christmas rally. We previously highlighted Apple’s overbought condition and the possibility of a correction on 27 December 2024.
→ New data indicates that resistance has now shifted to the median at around $225.
This puts the lower boundary of the trend channel at risk of a bearish breakout. In the coming days, AAPL’s chart may see a bearish assault on the psychological $200 level, which proved significant in August 2024.
This article represents the opinion of the Companies operating under the FXOpen brand only. It is not to be construed as an offer, solicitation, or recommendation with respect to products and services provided by the Companies operating under the FXOpen brand, nor is it to be considered financial advice.
