$AAPL on its way to $200's by end of 2022!Apple on it's way to 200's by end of 2022. My studies show that they will continue the uprise well into 2022.
Aaplelong

$AAPL bounce in a bullish move$AAPL bounce off in a bullish move. $AAPl has been floating above $170 in the past few days even when the market is pulling back. seems like there's a lot of bullish flow on AAPL. this could possible break to 190 to 200 by the end of this month. if the momentum continues.
buy calls above 182.22
buy puts below 175.45
always follow take profits and follow your risk management.
Hello everyone,
welcome to this free technical analysis . ( mostly momentum play )
I am going to explain where I think this stock is going to go over the next day or week play and where I would look for trading opportunities.
If you have any questions or suggestions which stock I should analyze, please leave a comment below.
If you enjoyed this analysis, I would definitely appreciate it, if you smash that LIKE button and maybe consider following my channel.
Thank you for stopping by and stay tune for more.
My technical analysis is not to be regarded as investment advice. but for general informational proposes only.

AAPL Support and ResistanceCan't post the 5m chart but this will do. If you follow me on Twitter I'll have the 5m chart posted.
This morning you're looking at support in the 163.18 area and resistance at 164.22. Stock is currently trading at 163.64. Look for a clear path before you take a position. Likely going to continue to be volatile with everything going on.

AAPLAAPL BUY AT 180.50 and will reach 200
AAPL BUY AT 180.50 and will reach 200
AAPL BUY AT 180.50 and will reach 200
AAPL BUY AT 180.50 and will reach 200
AAPL BUY AT 180.50 and will reach 200
AAPL BUY AT 180.50 and will reach 200

AAPL: Nice Move!AAPL has been re-building for months now. Great breakout of former ATH now targeting 163. The short on this will be epic as well when it decides it wants to retest 157.27

AAPL Pushing Back to ATH?Backtest of 150 first, then a test of 153.33 area where there is some overhead supply. Not too much to go through but could take a day or two if playing weeklies. Once through 153.33 supply, blue skies to 155.

AAPL ANALYSEi think AAPL will fly to 156.
but if it goes down more than the poi t of entry in the chart it will reverse and go down.

Apple | Fundamental Analysis | Must Read...Apple will release its fourth-quarter 2021 fiscal year results this Thursday, which entails investors looking for a fast-growing stock trading at a low price need to act quickly, as the smartphone titan looks poised to deliver solid numbers that will help halt the recent decline in its stock price.
As many know, Apple's stock has fallen over the past few weeks notwithstanding reports that the latest iPhone 13 models are in greater demand than last year's lineup. Let's take a look at the reasons why smart investors should take advantage of the Apple stock pullback.
Recent reports suggest that iPhone 13 sales may be held back by supply chain constraints. The iPhone maker could lose as many as 10 million iPhone 13 units as a worldwide shortage of semiconductors could disrupt production lines. The smartphone maker reportedly expected to produce 90 million iPhone units in 2021, but third-party reports indicate that it may fall short of that mark.
As it turns out, the chip shortage is awaited to influence not only iPhone production, but also interfere with the release of iPads and MacBooks. Not surprisingly, investor sentiment towards Apple stock has turned negative, but it should not be forgotten that the company has a huge opportunity.
For example, Wall Street expects Apple's fourth-quarter revenue to grow nearly 31% year-over-year to $84.7 billion. Earnings are expected to rise to $1.23 per share from $0.73 per share a year ago. When the company released its fiscal third-quarter results in July, Apple did not provide official guidance, citing uncertainty caused by the COVID-19 outbreak, but it would not be shocking if the company beat market expectations.
Morgan Stanley analysts estimate that Apple's iPhone shipments for the quarter that ended in September will grow 17% year over year to 49 million units. When you consider that in the 5G era, Apple expects the average selling price of iPhones to rise significantly, revenue from the company's largest product line (which accounts for 49% of third-quarter revenue) could grow impressingly. Not surprisingly, Morgan Stanley analysts expect Apple's iPhone revenue to grow 52% year over year in the September quarter.
The higher ASP, as well as the fact that the company's services business is growing at a good pace, should lead to higher margins. Apple recorded a 33% year-over-year increase in services revenue in its third fiscal quarter, and that trend is likely to continue, due to remarkable increase in offerings such as the Apple TV+.
All of this indicates that Apple is well on its way to achieving good results. More importantly, the tech giant will likely be able to maintain its high growth rate as it is at the beginning of a big renewal cycle.
Investors shouldn't worry too much about near-term problems that could derail iPhone production, as the company has ample room to grow in the era of 5G smartphones thanks to its huge user base.
CEO Tim Cook said in January that Apple has a base of more than 1 billion active iPhone users. The company only released its first 5G-enabled iPhone models last year, which means that only a small fraction of its installed base is using 5G devices. Shipments of the iPhone 12 (Apple's first 5G-enabled device) totaled 100 million units this April, meaning that millions of users are still in the upgrade window.
Thus, Apple could continue to see significant growth in shipments in the coming years as more and more users upgrade to the new iPhones. Add to that improved pricing for 5G-enabled smartphones, and it's no wonder why Apple's revenue is expected to grow nearly 20 percent a year over the next five years. That's a big jump from the 8.4 percent annual earnings growth the company has seen over the past five years.
Finally, since Apple is trading at a forward earnings ratio of 29, which is lower than the Nasdaq-100's high tech weighted ratio of more than 35, it makes sense to buy these tech stocks before the earnings report comes out, as strong numbers and solid guidance can lift the stock and increase its value.


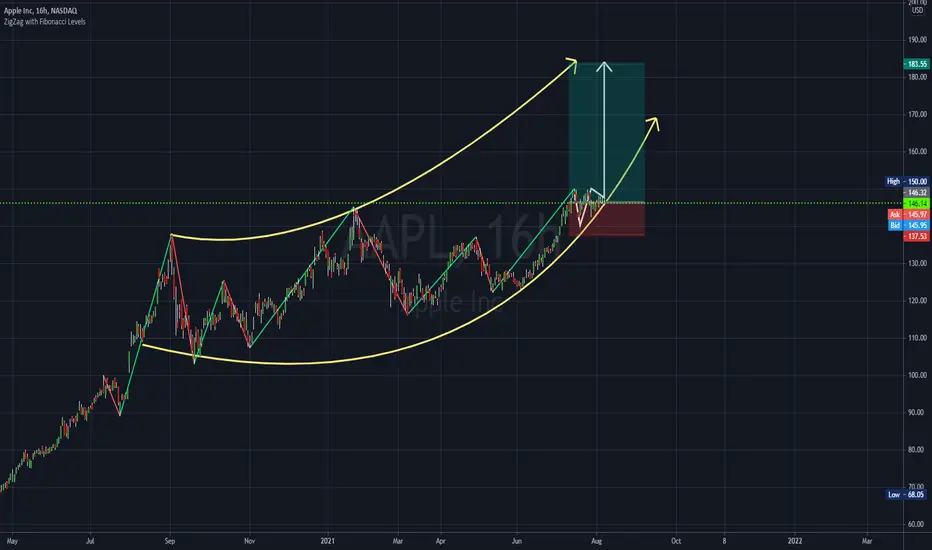
AAPLAAPL 16hour/candle chart review. FINAL PT BULLS 185/195USD. get ready for parabolic rally now. bullish fractal in progress now contained within parabolic channel. more gains next 4-8 weeks. setup still valid / in progress now. short-term target was reached. already +20% gains from my level. in-line with my NDX/ NAS100 setup, setup still valid as of today. compression into wedge. NOT A BEARISH SETUP!. strong prior UPTREND so MORE GAINS. Market Buying near current price is a great strategy for BULLS now. BUY/HOLD near my level for best results. BULLS maintain control for now. lower risk setup is BUY/HOLD. exit at 185/195 USD end of 2021. strong bullish chart expect more gains. TP BULLS TP1 175 USD TP2 185 USD. BUY/HOLD setup with great risk:reward. BULLS TP FINAL is 195 USD end of 2021. SWING trade setup do not expect fast/miracle overnights gains here.

AAPLApple (NASDAQ:AAPL) seems to be forming an ascending triangle pattern, a bullish continuation setup that typically breaks upward. Breakout watch over 149.78
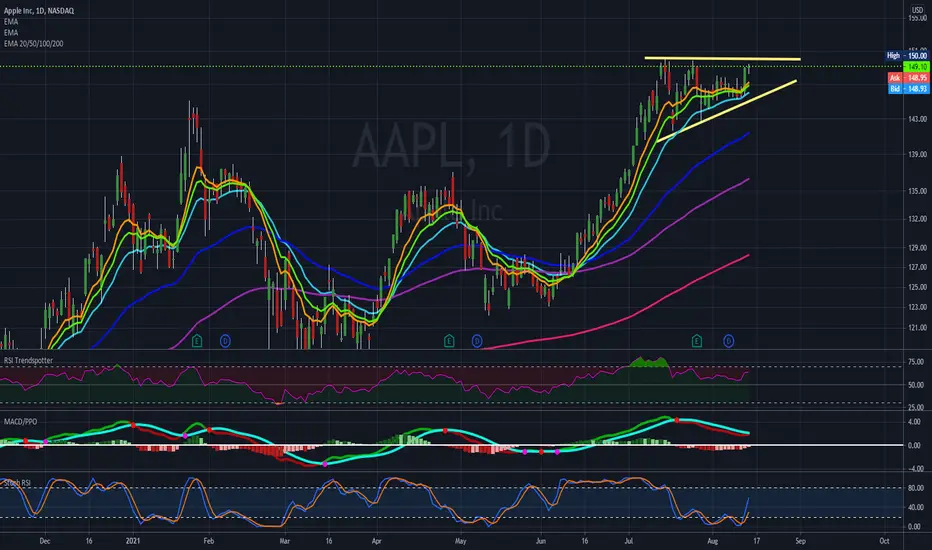
Apple ( $AAPL ) Break Out Confirmed$AAPL closed above $150.00 yesterday confirming break out of bullish pennant pattern. Showing strength in today's red markets. Look for $AAPL to test $155.00. After that, there is a high likelihood of the stock bouncing back to the bottom of the channel...

AAPL: New ATH for Apple soon! Requested by decimalSuccess35475 Apple broke out of a year long ascending triangle back in the beginning of July.
Right now, again it broke out of a month long symmetrical triangle with volume confirming the move.
Last Friday was a doji pattern, which means we can wait and see if Monday will be a down day presenting us with a better entry. Looking at the 1H chart, there's support at $147.50-147.80 range.
Profit target 1 is at $160, a round number as well.
A safer stop loss is below $146.
If you trade options, we can expect this move to be completed within 2 weeks. On the safer side, go at least 45 days out so that time decay won't erode too much of the profits away.
Disclaimer: I'm not giving any trading and investing advice. I'm just sharing my chart observations.
If you have any symbols that you'd like me to analyze, feel free to drop me a comment.

AAPLAAPL chart review. FINAL PT BULLS 185/195USD. bullish fractal in progress now. contained within parabolic channel. more gains next 4-8 weeks. setup still valid / in progress now. short-term target was reached. already +20% gains from my level. in-line with my NDX/ NAS100 setup. setup still valid as of today. compression into wedge. expecting bullish breakout. NOT A BEARISH SETUP!. strong prior UPTREND so MORE GAINS. July is a strong month for TECH STOCKS. Market Buying near current price. is a great strategy for BULLS now. BUY/HOLD near my level for best results. BULLS maintain control for now. lower risk setup is BUY/HOLD. exit at 185/195 USD end of 2021. strong bullish chart expect more gains. TP BULLS TP1 175 USD TP2 185 USD. BUY/HOLD setup with great risk: reward. BULLS TP FINAL is 195 USD end of 2021. recommend to BUY/HOLD. SWING trade setup do not expect. fast/miracle overnights gains here. Supply/Demand Zones near market fresh demand zone.185/195 USD fresh supply zone
WATCH $AAPL on monday MAKE OR BREAK!!!-We need to break fridays highs in order for us to see a continuation. Now as you may know apple has been having some crazy days so watch that break we might even gap up monday
-NOW if we reject oh boy PUTS ALL THE WAY baby that's a steal right there we are literally sitting smack in the middle
-SO there you have it your 2 possible scenarios that can happen based on how price moves monday.

AAPL Breakout !Made new All-Time HIgh on Friday
10 Month-long Ascending Triangle
Price well above 200 DMA
Decent Volume
Earnings coming up


Apple(AAPL) Are you long or still short?Apple(AAPL) Are you long or still short?
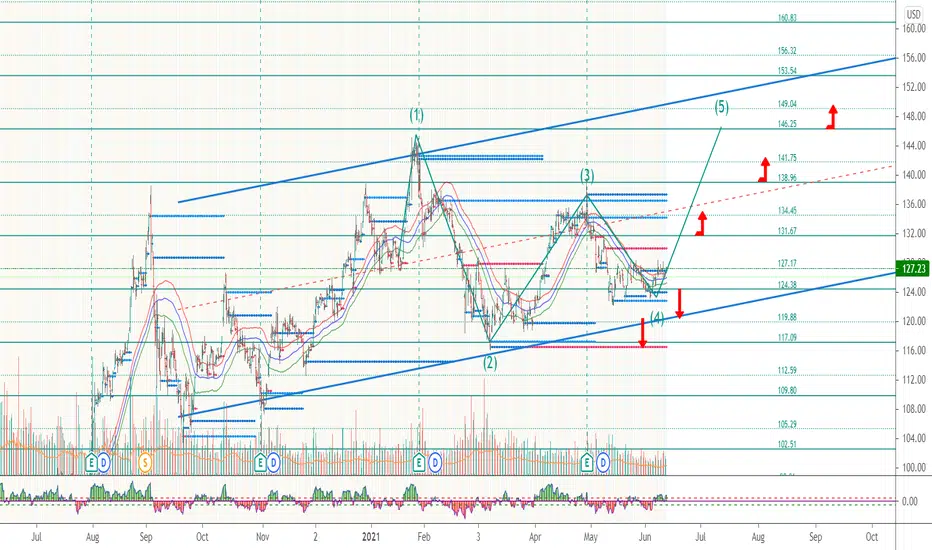
AAPL could be on its way to complete wave five if it holds above 124. It managed to hold above 124 in a few attempts by sellers to drive prices to 120/118 but was unsuccessful, as indicated in the H4 price chart below.
The short-term goals to the upside are indicated on the chart; target one at 132, target two at 138 and four at 146.
Support at 124, 120, 117


APPLE(AAPL) - At the best and worst priceWe are in the best buying zone for Apple, stop at -5% approx.
The bullish and bearish scenarios can be seen in the chart.
In case of failure a big HCH can be observed.
MANAGE YOUR RISK! The loss you take in case of failure should NEVER be more than 2% of your total capital. NEVER.
You invited to share your vision in the comments. Thank yo

Watch the AAPL Open for further upsideDrill down to a lower timeframe pre market and have a look at AAPL. Earnings report has brought some nice volume/volatility into it.
Watch for a breakout of the trendline but I'd rather wait until the open for confirmation.
Stop at low to stay safe and keep risk at a minimum.

