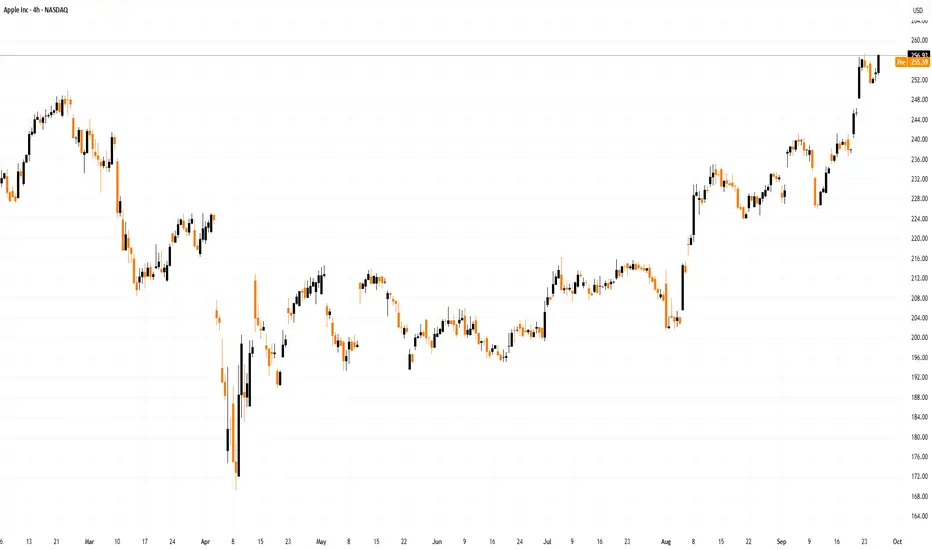
APPLE (AAPL) – BUY SETUP ANALYSIS | TARGET $280 | OCT 2025Current Price: $258.01
Trend: Uptrend channel (bullish)
The chart shows a rising parallel channel, and the price is currently trading near the upper region of the channel — suggesting possible short-term correction before resuming the uptrend.
🧭 Key Levels
Buy Entry Point: $223.34 – $223.68
This zone is highlighted as a strong demand/support area. Price may retrace to this zone before resuming upward.
Stop Loss: $211.44
Below this level, bullish structure would be invalidated.
Target Point: $280.74 – $280.80
This is the projected take-profit zone, aligning with the top of the channel extension.
🔍 Projection
Expected move:
Price might break below the current trend channel, retest the support zone around $223, and then bounce upward toward the $280 target.
This setup represents a buy-the-dip strategy inside a long-term uptrend.
⚠️ Risk Management
Risk-to-Reward Ratio ≈ 1:4, favorable setup.
Entry should only be considered if price confirms reversal signals (e.g., bullish candlestick patterns) near $223 support.
Aapltrade

Apple Shares (AAPL) Close to Reaching Record HighApple Shares (AAPL) Close to Reaching Record High
On 10 September, we noted that following the launch of new products — including the iPhone 17 — AAPL shares had fallen by approximately 1.5%, as analysts considered the model lacked the breakthrough appeal necessary to drive further growth.
However, two weeks on, media reports point to strong demand for the new product range, highlighting that:
→ orders for the new devices exceed those for last year’s iPhone 16 series;
→ Apple has asked suppliers to increase production;
→ the base model, featuring the long‑awaited 120Hz display and the powerful A19 chip, is in especially high demand.
Positive reports of long queues at Apple Stores worldwide, along with extended delivery times — which Bank of America estimates at an average of 18 days compared to 10 days for last year’s model — have only bolstered bullish sentiment. AAPL shares are rising this week, even as broader market indices are falling.
Technical Analysis of Apple (AAPL) Shares
AAPL stock price movements in 2025 form a broad ascending channel (shown in blue). In this context:
→ Until early August, the price remained in a consolidation phase (shown by black lines) below the channel’s median;
→ Since then, the balance has shifted in favour of buyers — the price has demonstrated bullish momentum, forming a steep growth channel (shown in orange), with the median providing support (indicated by an arrow).
The strength of demand is confirmed by AAPL’s price action rising from $240 to $250:
→ bullish candlesticks were wide;
→ closing prices were close to the highs;
→ a bullish gap is visible on the chart.
This points to a buyers’ imbalance, giving grounds to regard this area as support in terms of a Fair Value Gap pattern.
From a bearish perspective:
→ the RSI indicator is in overbought territory;
→ shareholders may wish to take some profits.
Nevertheless, it cannot be ruled out that AAPL’s price growth will continue, driven by expectations that strong demand for the iPhone 17, as well as the updated Apple Watch Series 11 and AirPods Pro 3 with new AI features, will deliver record quarterly revenue for the company, covering the upcoming holiday season. In this scenario, bulls may target the upper boundary of the blue channel.
This article represents the opinion of the Companies operating under the FXOpen brand only. It is not to be construed as an offer, solicitation, or recommendation with respect to products and services provided by the Companies operating under the FXOpen brand, nor is it to be considered financial advice.
BUY AAPL Apple at current levels (175 to 176) for T1 180 T2 195BUY AAPL Apple at current levels for T1 180 T2 195
Its less than 2 minute video where I have explained the entry and stop loss
Expecting the target to be achieved in a month or 2

Don't Buy AAPL in Short TermAs we can see in the above weekly charter, Apple(AAPL) is doing a correction in wave (C) in black to complete the wave II in red. The wave (C) will be done in wave 5 in blue.
- ALERT: We expect Smart Buyers will appear around $140~142
- Apple(AAPL) has a strong correlation with NASDAQ and this also shows the similar structure. We need to continue following this correlation.

AAPL Hitting weekly resistance, a pullback is on the wayPrice pierced into the weekly resistance zone. This is a strong resistance zone. A considerable pullback is expected here before the next attempt to break this resistance.
If that expected pullback is there, the price will probably tap into this below weekly support and bounce from there.
