NZDUSD — Correction Invalidated, Execution From the A–B BreakerPrice is trading inside a higher-timeframe BC , where the first failure already occurred.
The base breaker formed when continuation buyers expected the uptrend to resume, but MSS invalidated that assumption , trapping early continuation attempts.
At that stage, there was no sequence yet — only uncertainty.
Only after that failure did a valid ABC structure develop.
Wave A proposed direction
Wave B formed as a correction, where buyers entered expecting B to hold
Wave C began at the end of B and structurally invalidated B , proving the correction was finished
The continuation breaker is defined as the entire zone between the end of A and the end of B , where correction buyers built exposure.
For execution, I drop to lower timeframes and isolate the last breaker inside the A–B zone before Wave C flipped the scenario .
That breaker represents the final correction belief — and therefore the highest-probability entry location .
Price is expected to return to this area to:
remove correction buyers
sweep inducement
rebalance risk
That liquidity is the fuel for Wave C continuation toward its target .
If price does not return to the A–B zone, there is no trade .
If correction is not structurally invalidated, there is no participation .
I don’t trade direction —
I trade when correction proves it’s finished .
“ I participate only after correction fails — not before, not without proof. ”
Not financial advice.
ABC

Gold (4H) — Supply is holding… for nowContext
On the left of the chart, Gold reached the higher-timeframe C target .
That was a valid place for sellers to take control — and they didn’t.
Price absorbed selling pressure and kept moving.
Now we’re at a different level.
The red zone is the all-time-high supply.
Sellers are active here. Price is being held.
That part matters and shouldn’t be ignored.
What formed under supply
Instead of a dump, price built structure:
A clear base
Liquidity sweep
MSS
A fresh ABC sequence
B held.
B broke A.
That tells me buyers are still participating, even with supply overhead.
Expectation
I’m not expecting an immediate breakout.
What makes sense here is a pullback first.
A revisit into the continuation breaker , clearing inducement and resetting positioning.
If that zone holds and price flips back up, then a break of supply opens the path toward C .
If the structure fails, I step aside.
No forcing it.
Watching how price behaves — not guessing the outcome.
SmellyTaz — decoding chaos.
Not financial advice. Shared for educational purposes only.

AUDUSD — Counter-Trend ABC Breathing Inside a Bearish HTF WCLPrice is currently trading inside a fresh bearish higher-timeframe WCL , so any upside here is treated as corrective, not a trend flip.
Within that context, a clean bullish ABC has formed.
B held structurally, displacement followed, and the move left behind a breaker block + FVG , which defines my area of interest.
The idea is simple:
If price revisits this zone and respects it, the path of least resistance is a continuation of the correction toward the ABC C-target , before deeper HTF supply comes into play.
Invalidation is clear.
A break below B kills the sequence entirely.
This is a location-first setup —not a prediction, not a signal.
Always wait for confirmation and trade in alignment with higher-timeframe context.
Not financial advice.

GBPAUD — BC Entry Inside Weekly WCL, Invalidation Below BPrice is trading inside a Weekly WCL after a weekly bearish ABC sequence completed . At that point, momentum fades and location takes control .
Within this context, a bullish ABC formed, and price retraced into the BC / order-block zone .
Entry is mechanical, with invalidation below B , the sequence failure point.
Expectation is simple:
B holds → rotation higher toward the bullish ABC target
B breaks → idea invalidated
Note : when time allows, always wait for confirmation inside the level (sweep, displacement, CISD, etc.).
Structure over prediction.
— SmellyTaz
Disclaimer : This is not financial advice.

EURUSD — One Turnpoint, Two OutcomesThis Daily chart reduces the entire narrative to one decisive level .
We had a completed bearish ABC sequence , with price reaching its C target and establishing a fresh bearish WCL . As price entered that terminal zone, a new bullish ABC sequence began forming — a classic SK transition from momentum to location.
What matters now is not the past sequences, but the bullish WCL .
That bullish WCL is the turnpoint .
From an SK perspective, this level is binary:
If the bullish WCL is respected , price should rotate higher and retest the bullish ABC objective
If the bullish WCL fails , the bullish sequence is invalidated, and price should rotate lower to retest the bearish ABC objective
There is no prediction here and no bias without confirmation.
The market has compressed into a decision point where one level defines two paths .
Breaker structure still frames the area, but the WCL is doing the heavy lifting.
Everything else is context.
This is not about direction — it’s about who controls the turnpoint .
— SmellyTaz
Decoding chaos .
Disclaimer : This is not financial advice.

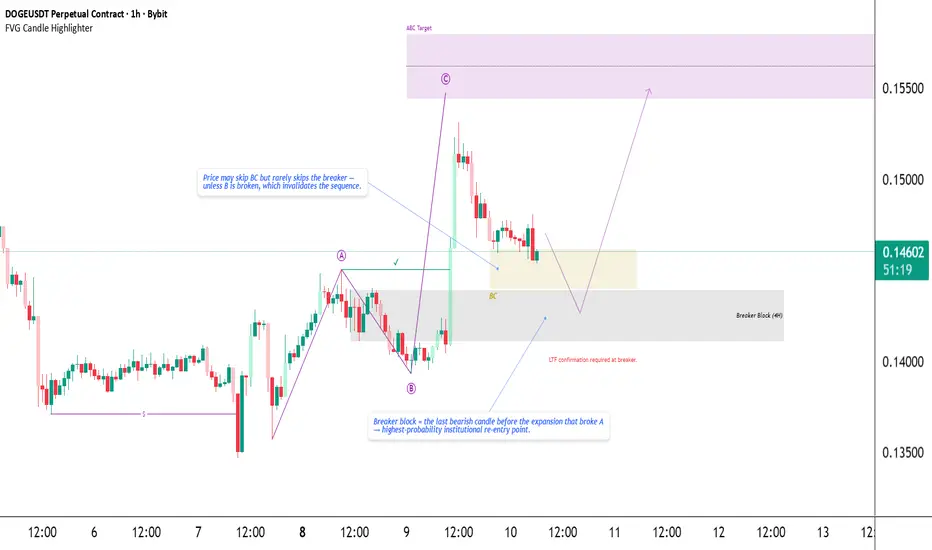
DOGE — SK Structure Breaker Block Re-Entry Toward C-TargetDOGE has completed a clean SK bullish sequence :
• A → B → C , with C breaking above A and confirming bullish intent.
• This expansion created two important reaction zones:
— BC zone → structural strength (broader discount area)
— Breaker Block → precision re-entry (highest probability)
From testing across assets, price may skip BC entirely, but it almost always respects the breaker block , as long as swing B remains protected.
➡️ If B breaks, the sequence is invalid.
Trade Plan
I’m waiting for price to retrace into the Breaker Block (4H) .
Inside that zone, I will look for LTF confirmation before entering — ideally a small BOS/MSS or shift in delivery.
Targets & Invalidation
• Target : The projected C-Target zone above
• Invalidation : ➡️ Any wick through B instantly invalidates the SK sequence — setup is dead.
This setup reflects my current blueprint:
Structure → Breaker → LTF confirmation → Ride back to C-Target.
Not financial advice.
GBPNZD Potential Long setup Price has formed and ABC pattern and has reacted from a demand area
waiting to see some price action at pullback inside the zone with some volume pushing price up targeting around 2.35 area
watching price action here is a must
trade safe

EURUSD SHORTPrice tapped the supply zone at daily
overall trend bearish
ABC formation high probability for short trade to 1.1550
Trend safe

USD/CHF — Riding the Channel Back to CPrice tapped the lower boundary of the long-term ascending channel and reacted exactly where the structure needed it to. The corrective leg into B also mitigated a breaker block, which gives this rebound a stronger backbone.
If this bullish sequence plays out, the next draw sits at the projected C up near the channel’s upper rail. As long as the lower structure holds, the risk–reward on this idea stays clean and controlled.
Following the wave logic, I’m targeting that C extension while keeping risk tucked below the breaker and the channel low. Let’s see if the market respects this geometry.
This is not financial advice.

HSBC (HSBC) – $54 Risk Zone if ABC Correction Is Triggered HSBCHSBC is currently trading within a rising wedge, but a potential short-term drop of approximately 5% could trigger a full ABC correction pattern. This scenario is not confirmed yet, as the chart remains structurally bullish.
However, should the price reverse and break below the rising channel, it would likely mark the start of wave C, completing an A-B-C corrective sequence. This development could lead the price toward the $54 support zone, which aligns with a previous demand area.
While there is no immediate breakdown or weakness, traders should remain alert. A simple -5% drop might be all it takes to activate the next phase of correction.
Pattern: Potential ABC correction
Trigger: 5% decline from current levels
Target: $54
Bias: Neutral – watch for reaction if price softens

$SPY Bounce to 590s?Hey everyone, it's your boy pic. AMEX:SPY looks primed for a typical ABC correction to around 590 going into the second half of March. Chart lines up with NextPivot Indicator and FIB levels just as pretty as you please. Nice look with clear stops. Good luck!

BTC to all time high nowBTC 2nd impulse wave started after big abc correction. Aiming to reach all time high now.

BTC to new high...It seems that BTC to be at the beginning of wave c:B. price is supported in green zone that it includes fibonacci 1.618 of wave W and fibonacci 0.5 of wave a:B and fibonacci 1.272 wave X. I expect that price to rise to red zone that it includes fibonacci 1.38 and fibonacci 1.23 of wave A and fibonacci 1 of wave a:B.
after that price completes the extended flat pattern in red zone, I expect the price to decline below the end of wave A and probably below 80,000.

BTC big retracementBTC big retracement
M, W, D, 4h divergence occurred. Now waiting 1h Divergence for short entry.

#xauusd #elliottwave short sell setup wave c 4 11Dec24This count is based on my assumptions so anything can happen not a trading or financial advice just for educational purposes only kindly do your own ta thanks trade with care good luck.

TRX looks fantastic for the long termCould TRX be in the middle of a wonderful impulse of 5 waves within a larger degree of trend? It looks like it just might be. It fits beautifully within the Hurst cycles (semi circles) at the bottom time wise. And, with wave 1 often looking very similar to wave 5, we could see a massive blow off top for wave 5 over the coming months. This is one of the coins that does not make up part of my portfolio, no matter how strong the analysis looks. But, if you want to go for it it's entirely up to you. Get out when the trend line breaks to the downside which will signal wave 5 having completed. Follow for more.

ADA looks fired up and ready to goIt looks as though the recent upward surge has confirmed there is more to come to the upside. This long term pattern of WXYXZ looks very likely meaning that the current upward surge is an impulse of X. It really does look great and would be confirmed with a lovely green bar in volume as shown at the bottom of the chart. Target would be a minimum of $8 within this scenario. Follow for more.

Aditya Birla Capital Ltd. (NSE: ABCAPITAL) Technical AnalysisCurrent Price: ₹201.60 (-0.82%)
Price Target (Jefferies): ₹265, maintained at Buy
Technical Overview
Price Action: The chart reflects a strong support level near ₹197-₹201, where the price is currently hovering. The support zone is reinforced by a trendline that has been respected several times (highlighted with green arrows). This support level aligns with a high-volume node in the volume profile, indicating considerable buying interest around this area.
Volume Profile Analysis: A significant amount of trading activity has occurred around the ₹190-₹200 range, suggesting strong demand. On the upside, high trading volume can also be seen around ₹227 and ₹241, which could act as resistance if the stock attempts an upward move.
Moving Averages: The 50-day and 200-day moving averages are providing additional support and resistance signals. The stock is currently trading near its 200-day moving average, which has historically provided solid support. A sustained break below this level could indicate bearish momentum.
Resistance Zones: The stock has encountered resistance around ₹240 (indicated by red arrows), with multiple attempts to break this level failing. This level will be crucial for the next bullish wave, and a breakout above it could lead to a new upward trend.
Key Pattern Observations: A broad ascending triangle pattern is observed, with the stock making higher lows since last year. This bullish structure indicates underlying strength, but a break below the support line could invalidate this pattern.
Technical Indicators
1.RSI: The Relative Strength Index is nearing the oversold territory, suggesting that the stock may be due for a reversal or consolidation phase.
2.Support and Resistance Levels:
Immediate Support : ₹197
Critical Support : ₹190
Resistance Levels: ₹211, ₹227, ₹241
Outlook and Conclusion
With Jefferies setting a revised target of ₹265 and maintaining a Buy rating, there is an optimistic long-term outlook. However, in the short term, the price may continue to consolidate around the ₹190-₹200 support region.
Bullish Scenario: If the stock bounces off the ₹197 level, supported by increased volume, it could make another attempt to reach ₹227 or even test the critical ₹240 resistance.
Bearish Scenario : A sustained break below ₹190 might attract further selling pressure, pushing the stock toward the ₹175 region.
Investment Idea: Traders may look for buy signals around the support zones of ₹190-₹200, with a potential target near ₹227 and ₹240, while maintaining a stop loss slightly below ₹190.

BTC: Impulse Wave 1 Complete, Awaiting Wave 3 SurgeIt appears that Impulse Wave 1 (green 1) has completed, with the necessary expanded ABC correction in place for Wave 2. Currently, BTC looks like it’s in Wave A of 5 of C. According to the Hurst cycles at the bottom, we should expect this corrective phase to last a few more days, up until the dotted blue line.
If all goes well, this will lead us into Wave 3, where we can anticipate strong upward momentum and potentially ferocious lunges to the upside. This will be Wave 3 of 3, meaning we should see a substantial bullish move.
The Hurst cycles suggest that Wave 3 could continue until around the 7th of November, making it interesting to consider how the U.S. election results on the 5th may influence this move. In any case, keep an eye on BTC for potential breakouts. Remember that corrections are healthy—and stay tuned for more updates!

CHZ in a Multi-Year Winter: Awaiting a Break for Wave 3 of 1CHZ looks like it’s deep into a multi-year correction as part of Wave 2 of the higher degree trend. The flameout in Wave 5 of 1 resulted in the current, drawn-out consolidation. This extended correction could be unfolding as a WXYXZ or a very elongated ABC pattern, reflecting the market’s need to churn and reset after the huge rally.
For now, volume remains low, suggesting the slow bleed may continue for some time longer. However, if we see a significant increase in volume, combined with a break of the upper trendline, this could signal the start of Wave 3 of 1, setting the stage for a strong impulse move upward.
Until then, patience is key, as the consolidation phase persists. But when the conditions align, CHZ could be primed for a major breakout.

WIF Stuck in a Wedge Pattern: Patience is Key For a BreakoutWIF is forming a very long but distinct WXYXZ wedge pattern, tightly confined within its channel. The structure is clear, with repeated ABC corrective waves confirming the pattern’s integrity. While the setup is clear, it suggests we may have to trade within the boundaries of the channel for now.
For those looking to trade short-term, focus on the key levels within the wedge, but be prepared to wait patiently for the eventual breakout—it could take time, but when it happens, it should be significant.

Nice entry point for buy this stockRetest ABC area ( Corrective Wave) for this UPtrend , time for buying more

AUDUSD LongAUDUSD completed ABC and as per rtm also it reached the origin Swap FL. harmonic made deep crab. Now its time for a upside reversal.
