Beautifully making HH HL.GOLD Analysis
CMP 11-01-2026
Beautifully making HH HL.
Previous Resistance should now act as a Support (around 4350 - 4400)
Crossing & Sustaining 4500 - 4600 may lead it towards 4900 - 5000.
However, breaking 4200 may bring more selling pressure.
Abcdchartpattern

Beautiful Cup & Handle formation.ILP Analysis
Closed at 84.49 (09-01-2026)
Beautiful Cup & Handle formation.
Crossing & Sustaining 84 - 86 may lead it
towards 100 & then 120+.
Immediate Supports seem to be around 83
& then around 75 - 76.

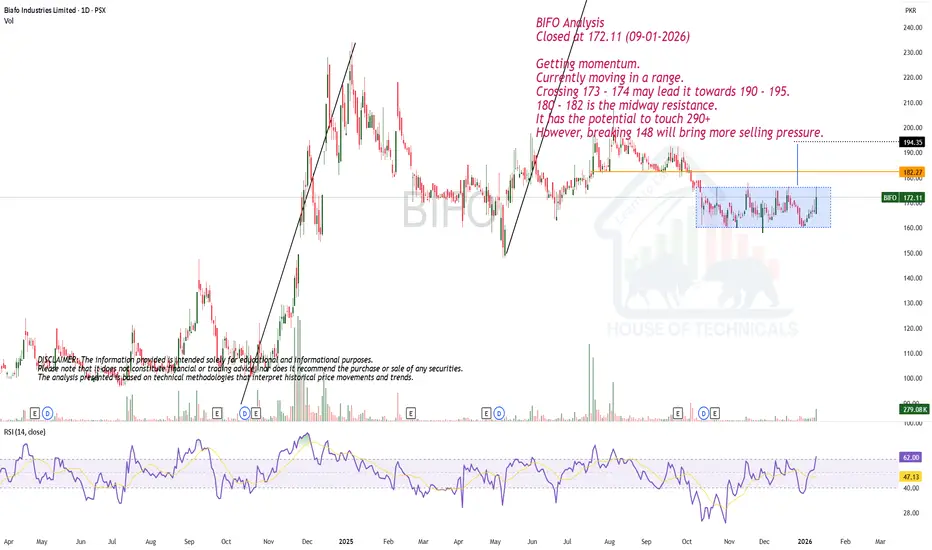
Getting momentum.BIFO Analysis
Closed at 172.11 (09-01-2026)
Getting momentum.
Currently moving in a range.
Crossing 173 - 174 may lead it towards 190 - 195.
180 - 182 is the midway resistance.
It has the potential to touch 290+
However, breaking 148 will bring more selling pressure.
ABCD Pattern appearing.TGL Analysis
Closed at 228.87 (06-01-2026)
ABCD Pattern appearing.
Important Supports seem to be around 212 - 215 & then around 188 - 190.
Immediate Resistance is around 243 - 245 & then around 290 - 292.
Crossing & Sustaining this range may lead it towards 390 - 392.
However, it should not break 164 this time.

Making HH HL.OGDC Analysis
Closed at 287.82 (01-01-2026)
Making HH HL.
Now at Very Strong Resistance Zone (288 - 292).
If this Zone is Crossed with Good Volumes &
Sustained, we may witness New Highs around
350+
Cup & Handle Pattern has also appeared. However,
resistance remains the same.

Levels to Play!NML Analysis
Closed at 178.52 (01-01-2026)
Currently seems to be around important
Support Zone (173 - 178).
Next Support is around 157 - 159.
Upside resistance is around 197 - 200.
Crossing this zone with good volumes may
lead it towards 220+

Cup & handle formation.SYS Analysis
CMP 170.45 (01-01-2026 02:19pm)
Cup & handle formation.
Important to Sustain 174 with Good Volumes.
Upside targets can be around 183 - 185 & then around 200.
However, breaking 160 may bring more selling pressure.

SAZEW - PSX - Technical AnalysisOn daily TF, after a phenomenal bull run, SAZEW has retraced Fib 25%.
Anchored Volume Profile has been used to identify the area of maximum participation (Volume).
Since Fib 30% and Fib 38% also coinciding with a big participation, therefore, it should test 1730 and then 1670. If price continues to go down then it will test Fib 55% to 60% zone.
Technically correct and very safe buying in expected bull run is 2075. However, buying at discounted level of 1645 or 1485~1500 are also very good.
However, buying at nearest support of 1720 may be a risky affair.
Although RSI suggest a small hidden bullish divergence which might take prices a bit up till 1890 where exists a strong resistance as well. Therefore, risking for mere 5% gain is not logical.

GCIL - PSX - Technical AnalysisOn daily TF, GCIL has been consistently following AB=CD pattern with Fib 50% retracement on previous two occasions.
On the same premise, one can take trade for quick profit booking. Moreover, it is also observed that volumes are more than previous occasions, therefore, the prices could even be pushed further up than AB=CD suggested. RSI still has some room to play and EFI is suggesting very strong buying.
Trade value
Buy : 38.46 (CMP)
SL: 34.50
TP-1: 42
TP2: 44

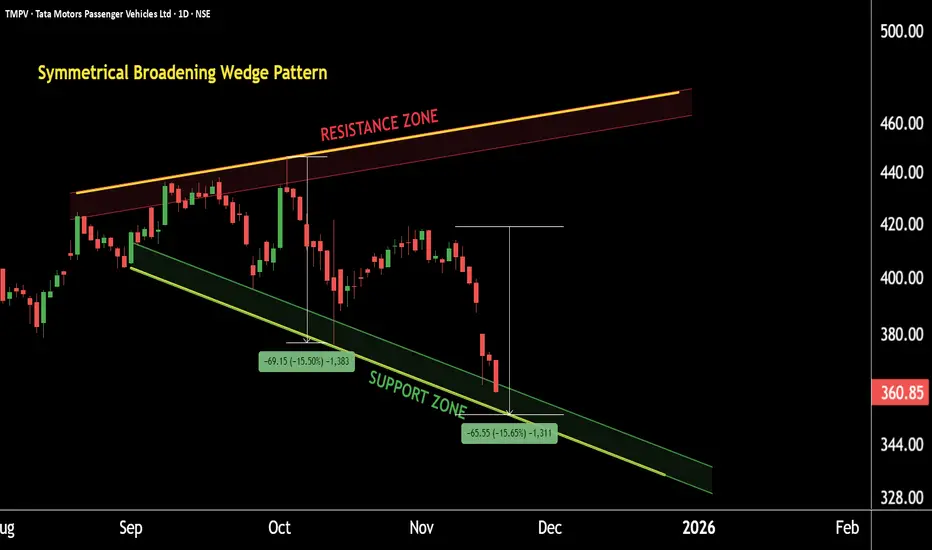
Tata Motors PV: A Big Pattern is Taking ShapeThis is the daily timeframe chart of TMPV.
TMPV is forming a Symmetrical Broadening Wedge Pattern with a key support zone near the 345–350 range.
The stock is also developing an AB=CD harmonic pattern within the broader structure, and the CD leg is completing near the same 350 support zone.
If the price continues to sustain above this support region, we may see higher levels like 400 and pattern price in TMPV in the coming sessions.
Thank you.
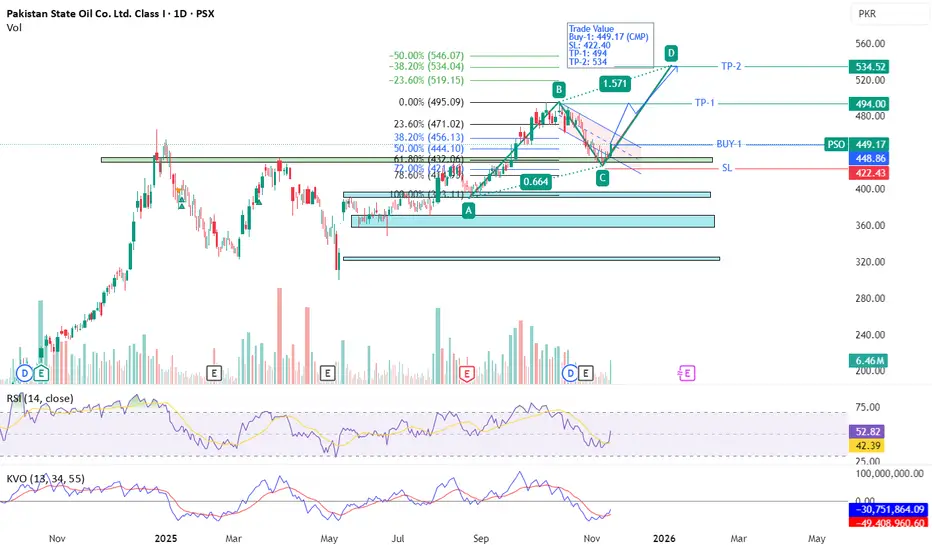
PSO - PSX - Technical Analysis AB=CDOn daily TF, PSO has retraced to Fib 62% and then went up after staying there for a few days. Closing of a Green Candle with volumes indicates that Buyers are active now. Also noted that KVO trigger line (Blue) has just crossed over the Signal line (red) indicating interest of Buyers although it is yet below zero level but its direction seems quite vertical. Also RSI is also moving up very sharply and still it has room to move up quote a bit. AB=CD pattern has been drawn to arrive to the TP.
Trade Value
Buy-1: 449.17 (CMP)
SL: 422.40
TP-1: 494
TP-2: 534
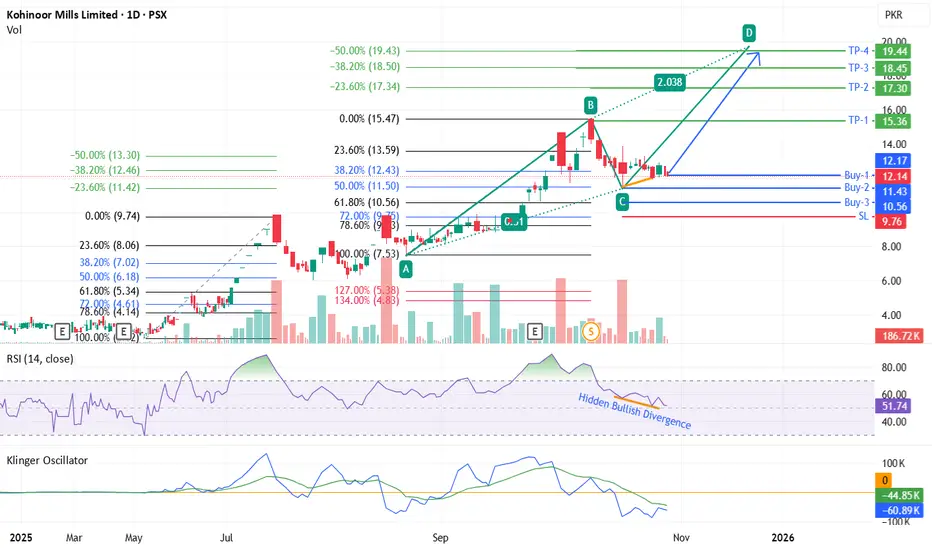
KML - Daily TF, Technical AnalysisKML after the 10/1 split share price dropped from PKR 146.77 to 14.67 and then it continued its price drop due to profit booking. Historically, this SCRIP retraces to 50% Fib level before starting its next run for HH.
At present, the price after retracing to 50% Fib level is almost maintaining 38~42% for the last 2 weeks consolidation. It may take even 1 to 2 weeks for once again going upwards but you never know it may go up even in one day as hidden bullish divergence has been observed on RSI. KVO is below zero level but its signal line (blue) is almost parallel to Klinger oscillator (green), suggesting slow transition but both lines are very close as well, therefore, any good news or bad news will give its immediate results.
For trade consider buying at levels mentioned on the chart.
ABCD harmonic pattern has been plotted to arrive to the TP-4.
Making HH HL.HAEL
CMP 25.32 (17-09-2025)
Making HH HL.
Took Support from a very important level of 21 - 22.
It has the potential to touch 30 & then 35.
& if 35.50 is Crossed & Sustained with Good Volumes,
it may touch 45 - 47.
However, breaking 20 this time will bring more selling
pressure.

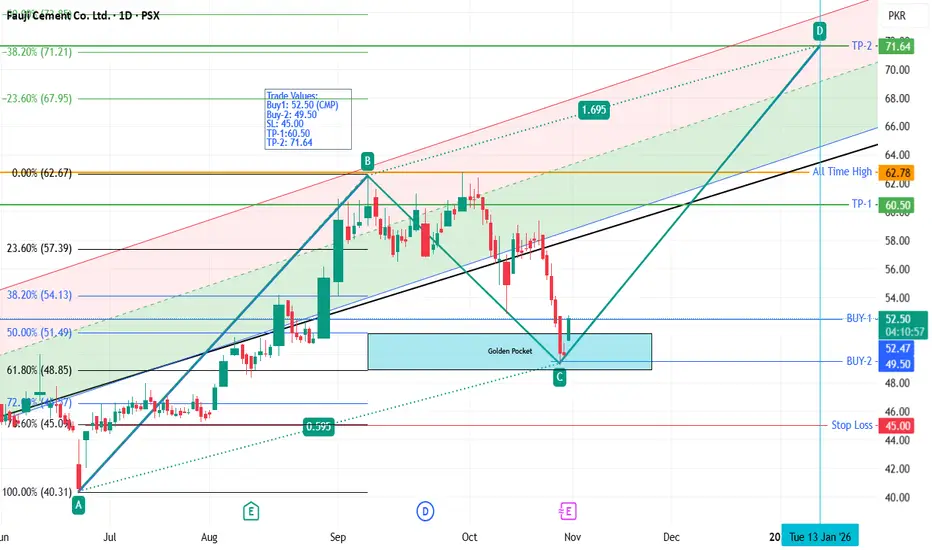
FCCL - PSX - Buy Call - ABCD PatternFauji Cement Co. Ltd. after making substantial retracement has fallen into Golden pocket and now has bounced from there.
AB=CD harmonic pattern has been drawn to arrive to the TP.
Trade Values:
Buy1: 52.50 (CMP)
Buy-2: 49.50
SL: 45.00
TP-1:60.50
TP-2: 71.64
The ABCD Pattern: The Market’s Favorite Alphabet TrickIf the markets had a secret language, the ABCD pattern would probably be one of the first letters you’d learn. Clean, geometric, and surprisingly common, this formation has been studied for decades. In abcd pattern trading, it’s not about spelling words. It’s about spotting balance, symmetry, and rhythm in price movements.
📐 What Is the ABCD Pattern?
Think of the ABCD pattern like a zigzag that markets often draw. It’s one of the simplest chart patterns in technical analysis because it shows how price usually moves in waves, not straight lines. Here’s how it works:
A → B (Impulse Move):
This is the first strong move, either up or down. In trading terms, it’s called an impulse leg — the market pushes in one direction with momentum.
B → C (Correction):
After a big push, the price takes a breather. This is the corrective leg. It doesn’t usually erase the whole move, just part of it.
C → D (Continuation Move):
Here’s the key: the price often makes another move, similar in size and angle to A → B. That’s why people say the ABCD has “symmetry.”
So, when you connect the dots A-B-C-D, you get a neat geometric shape that traders call the ABCD trading pattern. ⚠️ But a warning straight away: no matter how perfect an ABCD looks on paper, it cannot be read in isolation. Without confirmation from other tools — volume, momentum indicators, or broader market context — it’s just a geometric doodle on your chart.
🟩 Bullish and Bearish Variants
Like most patterns, ABCD has two moods. The bullish ABCD pattern shows up after a down-move, hinting that the market might be ready for a rebound. The bearish sibling often forms after an up-move, suggesting exhaustion.
The structure doesn’t change — it’s always AB, BC, and CD — but the meaning depends on where it forms. In a bullish ABCD, sellers push the price down twice before running out of strength, and that’s when buyers often step in. In a bearish ABCD, buyers push the price up twice, but eventually lose momentum, giving sellers a chance to take over. So when you see an ABCD chart pattern, you’re not just connecting dots — you’re watching how buyers and sellers take turns, and where one side might finally give up control.
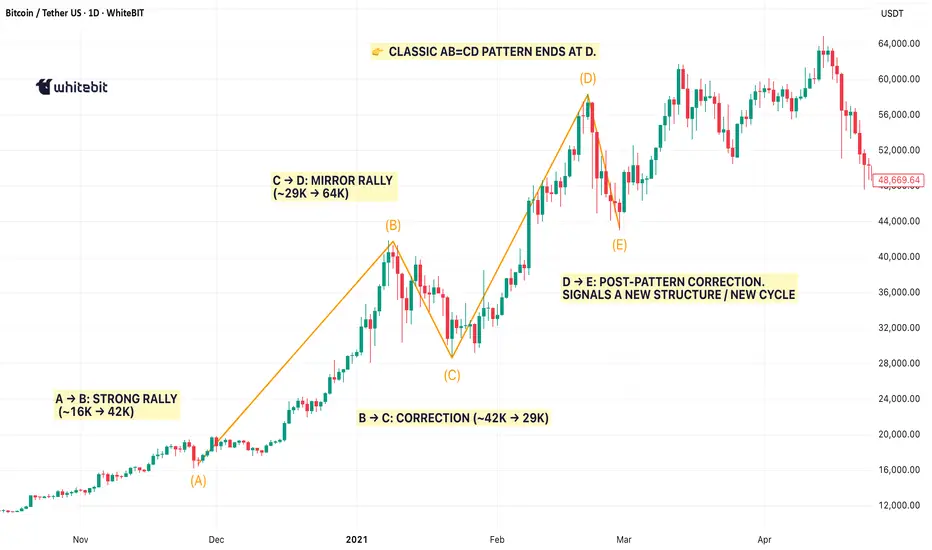
📊 Real Market Example
Take Bitcoin in early 2021. After a powerful rally from around ~$14K to ~$42K, BTC corrected back to ~$29K before surging again to new highs near ~$64K. This sequence mapped cleanly into a textbook ABCD pattern:
A → B: The rally into the ~$42K peak.
B → C: The correction down to the ~$29K zone.
C → D: A rebound to ~$64K, completing the mirrored leg.
It wasn’t a trading signal on its own — far from it. However, when combined with fading momentum and volume divergence, the ABCD chart pattern provided a visual anchor for identifying exhaustion in what was becoming an overheated market.
🧩 Why the ABCD Pattern Still Matters
The appeal of the abcd trading pattern lies in its simplicity. Markets are noisy, messy, and emotional. The ABCD strips that down to a geometric rhythm that even a beginner can spot. But here’s the catch: if you lean only on it, you’ll miss the bigger story. Professional analysts stress this constantly: the ABCD pattern works best as part of a toolkit. Pair it with Fibonacci retracements, moving averages, or support/resistance zones, and you’ll see how it fits into the wider puzzle. Alone, it’s just half a sentence. Together with other tools, it becomes part of the market’s story.
🎯 Final Thoughts
So, what is the ABCD pattern? It’s not magic, not a guarantee, but a visual lens. Think of it as one of the market’s favorite ways of whispering: “Something’s happening here.” The trick is listening carefully and comparing it with the rest of the orchestra. Because in trading, and especially in crypto, a single instrument never plays the whole song.
Tata Motors smashes resistance – Power packed rally ahead!This is the 4 hour chart of Tata Motors.
Tata Motors recently gave a breakout on the shorter timeframe around the ₹700 level and is currently trading near ₹721.
The stock has established a strong support zone between ₹690–₹700. If it sustains above this level and the current momentum continues, we may see a potential upside towards the ₹750–₹760 range in the shorter timeframe.
Thank you.

ABCD pattern appearing.HALEON Analysis
CMP 876.99 (04-09-2025)
ABCD pattern appearing.
Important to Cross 980 & Sustain this level
for the target of 1000+ & then 1400+
However, if 660 is broken this time, it may
drag the price towards 570 - 585.

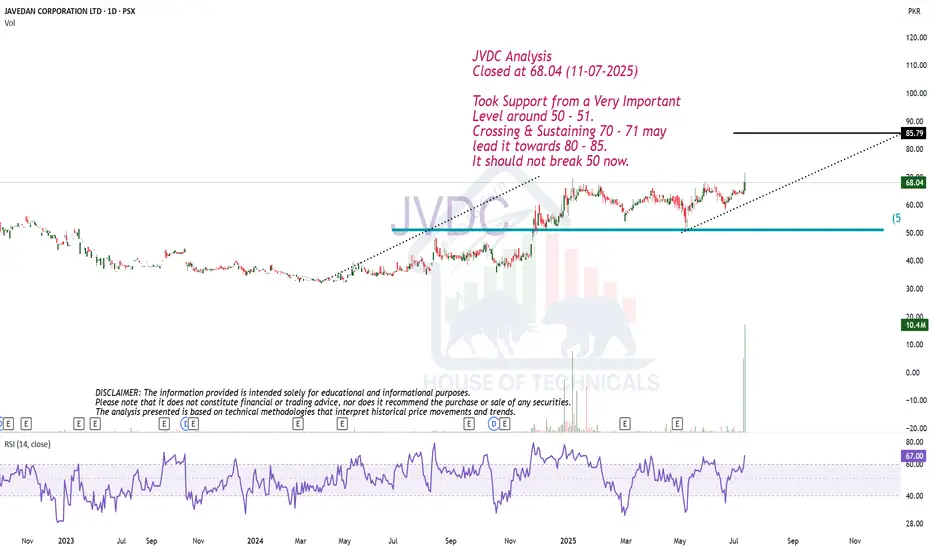
ABCD Possible.JVDC Analysis
Closed at 68.04 (11-07-2025)
Took Support from a Very Important
Level around 50 - 51.
Crossing & Sustaining 70 - 71 may
lead it towards 80 - 85.
It should not break 50 now.
Symmetry
Hello awesome traders! Hope you’re having a great summer. I’ve been juggling a few projects and a little time off—but eyes always on the charts. Today: Ethereum showing a clean symmetry (equal-legs) bullish setup.
Overview
Pattern: Symmetry / AB=CD (equal-legs) bullish
Context: Price printed D ≈ 4,047 and reclaimed momentum above 4,140, then based inside PCZ1.
Bias: Bullish while holding/reclaiming the PCZ1 band.
Key Levels
PCZ1 (retest/reclaim zone): 4,204 – 4,329
Momentum line: 4,140 (hold above = bulls in control)
Target 1: 4,652 (prior measured level on chart)
Target 2 zone: 5,191 – 5,498
Trade Plan
Primary long: 4H close above 4,329 (top of PCZ1) → look for continuation toward T1 4,652, then T2 5,191–5,498.
Alternative long: Reactive buy on a retest/hold of 4,204–4,220 with a bullish rejection (wick + strong close back inside PCZ1).
If PCZ1 rejects: Watch for a higher-low setup back near 4,260/4,220. Lose 4,140 on a 4H close → stand aside; deeper pullback to 4,080–4,050 possible.
Risk Management
Risk ≤ 1% per idea.
Stops: Conservative below 4,120 (for PCZ1 retest entries) or below 4,040 (for deeper-pullback entries).
Management: Scale at T1, trail to BE after ~1R, leave a runner toward T2 if momentum holds.
Notes
Structure stays valid while 4,140 holds on closing basis and price continues to respect PCZ1.
Confirmation = clean 4H close and hold above 4,329 with rising momentum.
@tradechartpatternslikethepros.

Hidden Bullish Divergence on Bigger tf.IMAGE
Closed at 21.94 (27-05-2025)
Hidden Bullish Divergence on Bigger tf.
Monthly Closing above 20.70 will be a
positive sign.
Upside Targets can be around 26 - 26.50
On the flip side, 20.50 - 20.68 is a Good
Support zone and then around 19.
Should not break 17.30, otherwise we may
witness nd Reversal.

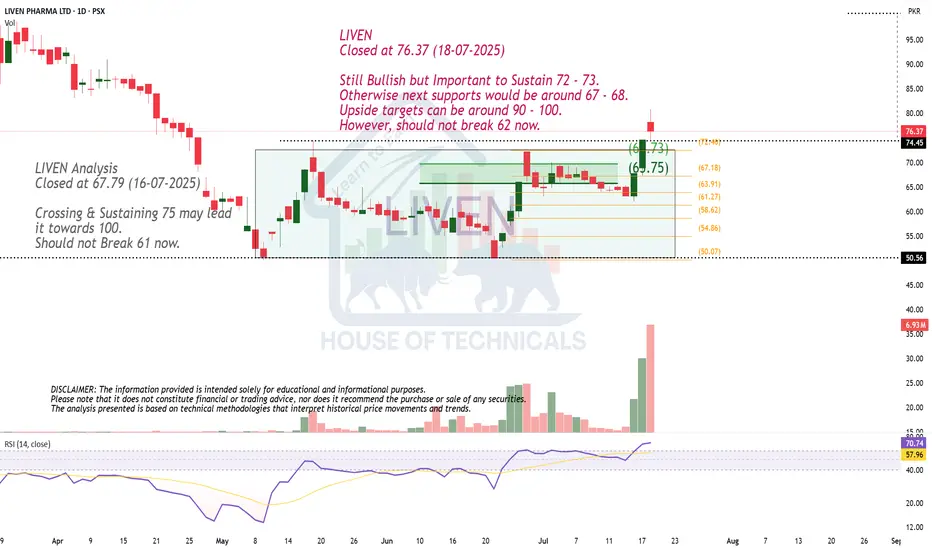
Still Bullish but ..LIVEN
Closed at 76.37 (18-07-2025)
Still Bullish but Important to Sustain 72 - 73.
Otherwise next supports would be around 67 - 68.
Upside targets can be around 90 - 100.
However, should not break 62 now.
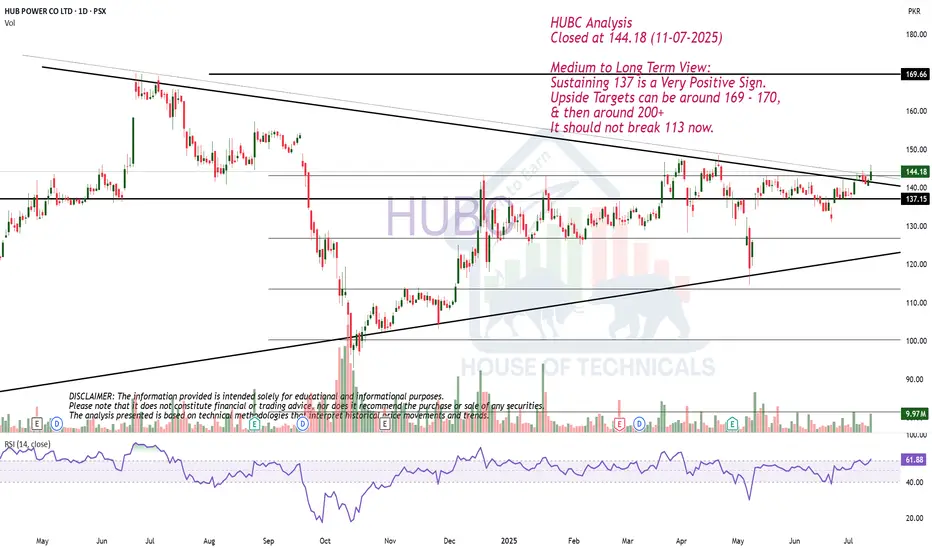
Medium to Long Term View.HUBC Analysis
Closed at 144.18 (11-07-2025)
Medium to Long Term View:
Sustaining 137 is a Very Positive Sign.
Upside Targets can be around 169 - 170,
& then around 200+
It should not break 113 now.
XAUUSD- Bearish AB=CD pattern at resistance zone!Timeframe:2H|Pattern: AB=CD| Bias: Bearish Reversal!
Gold (XAUUSD) has completed a precise AB=CD pattern aligning perfectly with a strong resistance zone near 3340-3350 the symmetry of the harmonic pattern combined with historical rejection levels gives a strong signal for a potential downside move
Trade setup idea:
Sell entry: 3340-3350
target:1: 3300
target:2: 3260
risk reward: Favorable setup with harmonic confirmation.
