GBPUSD Could Push Higher? | Rate-Cut Risk Pressures the Dollar!Hey Traders,
In today’s trading session, we are closely monitoring GBPUSD for a potential buying opportunity around the 1.33800 zone. GBPUSD remains in a well-established uptrend and is currently undergoing a healthy corrective pullback, approaching a key trendline confluence and the 1.33800 support-turned-resistance area, which may act as a strong demand zone for bullish continuation.
From a fundamental perspective, growing expectations of a potential interest rate cut by the Federal Reserve in the coming months continue to weigh on the US Dollar. A softer USD environment typically supports upside momentum in GBPUSD, reinforcing the bullish technical outlook.
As always, wait for confirmation and manage risk responsibly.
Trade safe,
Joe.
Abcpattern

NZDJPY – Bullish Momentum Building Toward ABC TargetNZDJPY is showing strong bullish structure on the 1H timeframe, supported by multiple confluences pointing toward continuation — with the final C-leg target still in play.
🧠 Trade Setup & Logic:
Bullish Ascending Channel: Price is moving within a larger bullish channel, supporting the overall long bias.
Bullish ABC Sequence: A clean ABC correction is underway, with price currently progressing through the BC leg and heading toward the projected C target.
BC Reaction Zone: This zone aligns with a bullish institutional order block , offering strong support and an ideal entry zone.
Descending Channel Break: Price broke out of a short-term descending channel structure, confirming a shift in momentum and trend continuation.
Target Confluence: The C target of the ABC sequence has not yet been reached. Interestingly, it sits inside a bearish order block , which may serve as a draw on liquidity and a potential reversal or reaction area.
🎯 Key Levels:
Entry Zone: Near BC zone / order block support (~90.3)
Target: 91.00 (ABC projected C-leg completion inside bearish OB)
Stop-Loss: Below 90.00 (invalidates bullish structure)
📚 Confluences Summary:
✅ Bullish ascending channel
✅ ABC bullish correction
✅ BC support zone + institutional order block
✅ Descending channel breakout
✅ Target not yet hit — potential continuation toward liquidity in bearish OB
💬 Do you wait for confirmation at BC zones, or enter on structure breaks? Drop your thoughts or questions below!

Gold Pullback Toward 4,420 as Dollar Weakness Persists!Hey Traders,
In today’s trading session, we are monitoring XAUUSD for a potential buying opportunity around the 4,420 zone.
From a technical perspective, Gold remains firmly within a broader uptrend and is currently undergoing a controlled corrective phase. Price is approaching the 4,420 area, a key confluence zone combining trend support with a former support/resistance level — an area where buyers have previously stepped in.
On the fundamental side, the backdrop continues to favor Gold. The Federal Reserve’s December rate cut has reinforced downside pressure on the US Dollar, while incoming data keeps the door open for another potential rate cut at the January FOMC, further weighing on USD expectations. This persistent weak-dollar bias remains structurally supportive for Gold.
Additionally, concerns around Federal Reserve independence and rising political and geopolitical tensions are contributing to renewed safe-haven demand, providing an additional tailwind for the metal.
As long as price holds above the 4,420 region, the broader bullish structure remains intact, with pullbacks viewed as potential continuation opportunities rather than trend reversals.
Don't forget to boost the post and leave your opinion on the comment section.
Trade safe,
Joe

AUDUSD — Counter-Trend ABC Breathing Inside a Bearish HTF WCLPrice is currently trading inside a fresh bearish higher-timeframe WCL , so any upside here is treated as corrective, not a trend flip.
Within that context, a clean bullish ABC has formed.
B held structurally, displacement followed, and the move left behind a breaker block + FVG , which defines my area of interest.
The idea is simple:
If price revisits this zone and respects it, the path of least resistance is a continuation of the correction toward the ABC C-target , before deeper HTF supply comes into play.
Invalidation is clear.
A break below B kills the sequence entirely.
This is a location-first setup —not a prediction, not a signal.
Always wait for confirmation and trade in alignment with higher-timeframe context.
Not financial advice.

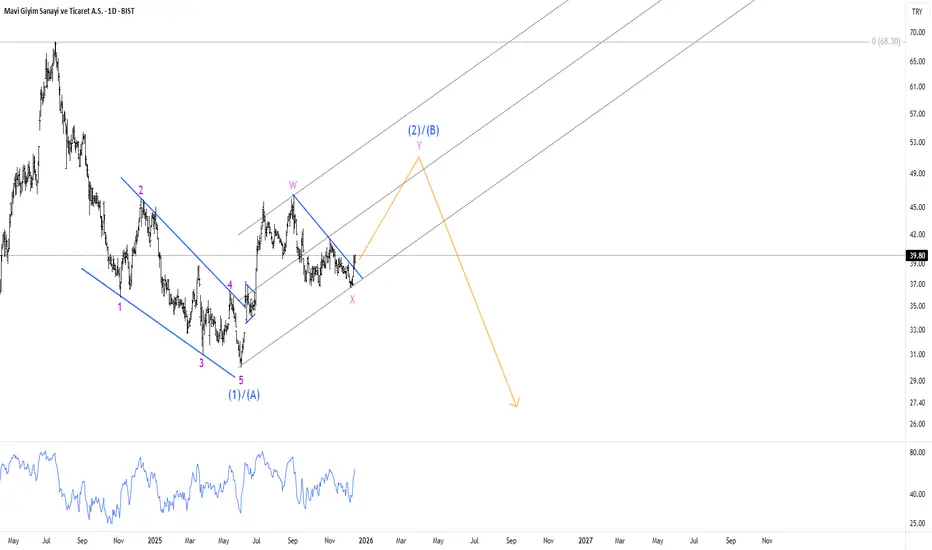
Mavi in a correctionmavi seems completed a diagnoal which may be Wave A or Wave 1 after the correction ends it should make new lows.
BTCUSD can crash to 24k if ABC correction occurs BTC experiencing the effect of Dead cross at 110000 USD ,which can drag upto 74500 and a support can take place due to price convergence and RSI divergence setup.
If price bounce backed from 74500 around ,then it can reach 0.386/0.618 around 106000 and 108000 USD.
A third try to breach 74500 can break the support and can take leap towards 24k making it drag down of 82% which BTC achieved back in 2017- 2018 .
Disclaimer: this is purely based on previous trends study and speculations according to price moments .i recommend to make your own study before investing or consult your financial advisor .

GBPUSD | External Liquidity Taken — Eyes on the Next DrawGBPUSD just cleaned out a batch of external sell-side liquidity (red SSS) sitting under the prior weekly lows. That sweep happened inside a major 1-Month FVG + 1-Month breaker block, which forms a strong HTF demand zone.
With liquidity taken and the zone respected, price may now be preparing for the next objective: the Draw on Liquidity resting above the recent swing high.
The ABC structure supports this idea.
Wave B held cleanly, and the market structure shift that followed keeps the C-leg bullish as long as price remains above this HTF demand.
So before the larger monthly target gets activated, this closer liquidity pool looks like the most natural first stop.
Not financial advice.

Joby Aviation - Breakout Complete - ABC Correction Underway
After a strong impulse wave up, the chart is now tracing a predictable ABC corrective pattern.
My suite of Fibonacci tools—especially the critical 0.786 retracement level—points to a likely downside target near $8 for the completion of wave C.
This is a healthy pullback within the larger bullish trend, offering a potential entry for the next leg up.
Tools used Fib/ Anchored Vwap , volume profile and TPO Chart

DXY Approaching 98.900 — Weak Labor Market Could Push Fed DovishHey Traders, in today’s trading session we’re monitoring DXY for a potential selling opportunity around the 98.900 zone.
The index continues to trade within a descending channel and is currently in a correction phase, approaching the upper boundary near 98.900, which aligns with channel resistance.
Fundamentals: Recent data continues to show signs of a weakening U.S. labor market, with job growth slowing and unemployment ticking higher. This softening backdrop increases pressure on the Federal Reserve to adopt a more dovish stance in upcoming meetings, potentially weighing further on the dollar.
Next move: Watching for bearish confirmations around the 98.900 zone — rejection here could resume the broader downtrend.
💬 What’s your outlook on the Fed’s next move? Drop your thoughts in the comments!

ASTER — OB Tap → WCL Retrace → Macro DownASTER is forming a clean ABC correction within a larger bearish structure. Price hasn’t yet tapped the order block — I expect a final dip to complete the C-leg before retracing toward the WCL zone. From there, the broader bearish wave should resume.
However, if Bitcoin continues its upward expansion, correlations could invalidate this structure and pull ASTER higher, overriding the current wave bias.
High-timeframe trend stays bearish, but intent always belongs to the present.
Strengths:
• Fractal alignment between macro and micro waves.
• Logical liquidity flow between OB and WCL.
• Flexible bias — corrective long, then macro short continuation.
Weaknesses:
• Requires precise OB tap and strong reaction.
• Bitcoin-driven expansion could neutralize bearish context.
• LTF volatility may distort confirmation signals.
SmellyTaz — decoding chaos

LINKUSDT – Possible Reversal After 5 Waves UpLINK has just completed a clear 5-wave impulsive move to the upside. With Wave V looking complete, there’s now a high probability of a corrective phase.
I’m watching for a potential drop towards the 17.5 USDT zone, which would be a significant percentage move from current levels.
📊 Potential Trade Levels:
Entry zone: 24.5 – 23.2 USDT
Stop Loss: 27.030 USDT
Target: 17.171 USDT
This scenario could unfold as an ABC correction.
⚠️ Disclaimer: This is just a personal trading idea based on Elliott Wave analysis, not financial advice. Please manage risk and do your own research before trading.

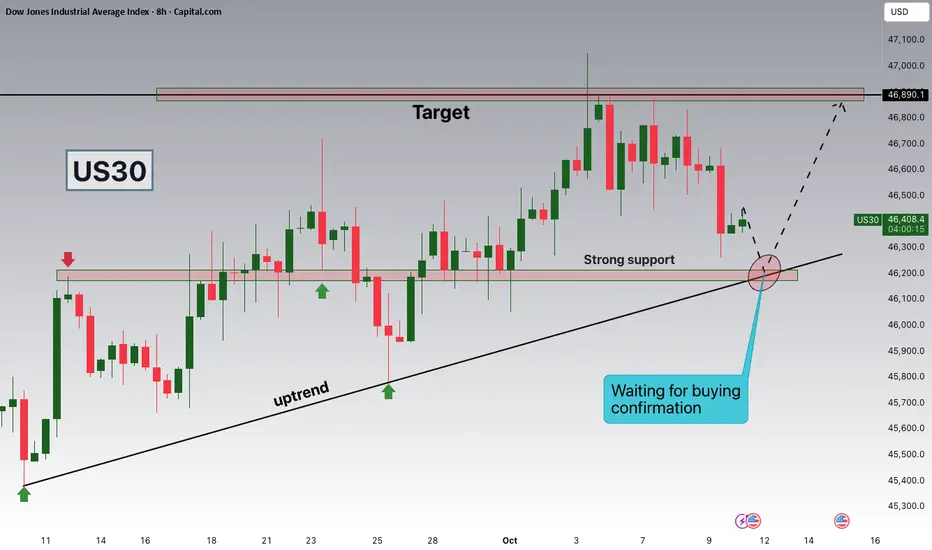
US30 Eyes 46,200 Support as Bulls Prepare for Next Leg Higher!Hey Traders,
In today’s session, we’re monitoring US30 for a potential buying opportunity around the 46,200 zone. The Dow Jones remains within a clear uptrend, and price is currently in a healthy correction phase, approaching a key confluence of support and trendline structure near 46,200.
A sustained reaction from this level could signal a continuation of bullish momentum in the broader equity market.
Trade safe,
Joe.
Yen Slips as New Fiscal Policies Emerge:GBPJPY Watching 203.900!Hey Traders,
In today’s session, we’re monitoring GBPJPY for a potential buying opportunity around the 203.900 zone. The pair remains in a broader bullish structure, and price is currently in a corrective phase, approaching a key trendline and support confluence near 203.900.
On the fundamental side, Japan’s latest election outcome brought a notable shift — a fiscally loose administration expected to keep stimulus running while maintaining pressure on the Bank of Japan to avoid tightening. This mix of expansive fiscal policy and dovish monetary stance could continue to weigh on the Yen, offering support to GBPJPY upside momentum in the short term.
Trade safe,
Joe.

Gold Holds 4,010 Ahead of Powell as Shutdown Clouds CPI OutlookHey Traders,
In today’s session, we’re keeping a close eye on XAUUSD for a potential buy setup around the 4,010 zone. Gold remains in a broader uptrend, and the current pullback brings price action near a key support and trend confluence that could attract fresh buyers.
All eyes are on Fed Chair Powell’s remarks later today. With the U.S. government shutdown disrupting key economic releases, including a possible delay of next week’s CPI data, Powell’s tone could heavily influence short-term Dollar sentiment—and by extension, Gold momentum.
If Powell hints at policy caution amid data uncertainty, the safe-haven narrative could re-emerge quickly. We’ll be watching closely for a potential technical trigger to align with the macro backdrop.
Trade safe,
Joe.

Can NASDAQ Hold 24,600 and Push to New Highs?Hey Traders, in tomorrow’s trading session we are monitoring NAS100 for a potential buying opportunity around the 24,600 zone. NASDAQ remains in an uptrend and is currently in a correction phase, with price approaching a key support/resistance level at 24,600.
Structure: The broader trend is bullish, with price moving within an ascending channel.
Key level in focus: 24,600 — a critical support area aligning with the lower boundary of the channel.
Next move: Holding above this level could set the stage for a rebound toward 25,100, which represents the channel’s upper resistance and potential higher high formation.
Trade safe,
Joe.

AUDUSD Eyes 0.65900 as Gold Nears Record HighHey Traders, in the coming week we are monitoring AUDUSD for a potential buying opportunity around the 0.65900 zone. AUDUSD remains in an uptrend and is currently in a correction phase, with price moving toward this key support/resistance level.
Structure: The broader bias is bullish, with price retracing toward trend support.
Key level in focus: 0.65900 — an important area where buyers may look to re-enter.
Fundamentals: Gold continues to rise and is nearing a fresh ATH, supported by a bearish US Dollar bias. Given the positive correlation between AUDUSD and Gold, further upside on the pair remains likely.
Next move: Monitoring price reaction at 0.65900 to assess whether the trend resumes higher.
Trade safe,
Joe.

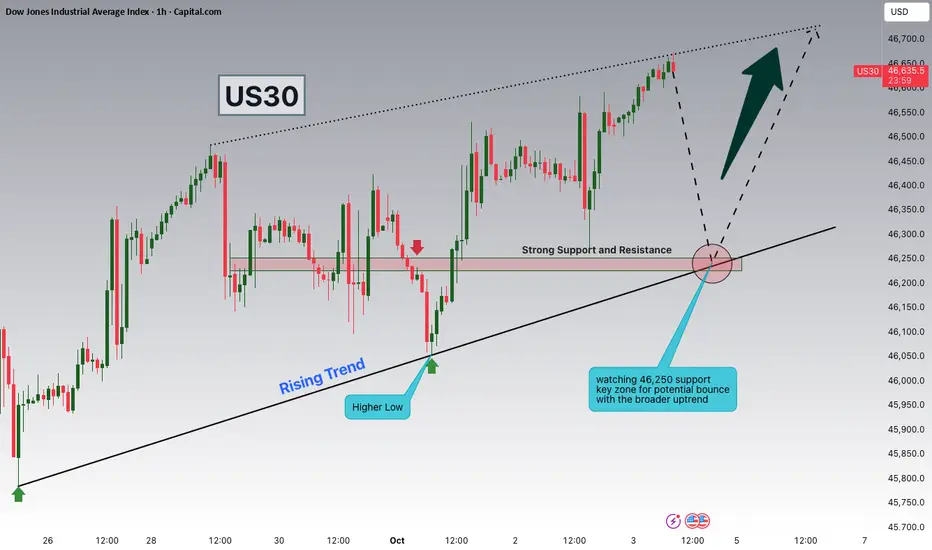
Dow Jones Watching 46,250 Support for Potential ContinuationHey Traders, in today’s trading session we are monitoring US30 for a potential buying opportunity around the 46,250 zone. The Dow Jones is trading in an uptrend and currently in a correction phase, with price moving toward this key support/resistance level.
Structure: The broader trend remains bullish, with pullbacks serving as corrections within the uptrend.
Key level in focus: 46,250 — an important support zone where price could stabilize and attract buyers.
Next move: Holding above 46,250 could open the door for continuation toward higher highs, while a breakdown would suggest a deeper retracement.
Trade safe,
Joe.
Cannabis stocks are looking bullish!Loving this setup with an ABC correction and a double bottom on TCNNF. The whole cannabis industry is very undervalued and should see a huge run with a big-picture reversal.
As always, stay profitable.
- Dalin Anderson

USDJPY Near 148.500 as Markets Await Key NFP PrintHey Traders, in today's trading session we are monitoring USDJPY for a potential selling opportunity around the 148.500 zone. The pair recently broke its uptrend structure and is now in a correction phase, approaching this important support/resistance level.
Structure: USDJPY shifted from an uptrend into a corrective move, with 148.500 acting as a retracement area of interest.
Key level in focus: 148.500 — a zone where sellers could regain control if bearish momentum builds.
Event risk – NFP scenarios:
Below 60k: Would likely trigger immediate USD weakness, keeping pressure on USDJPY and favoring further downside.
Between 80k–95k: Could produce an initial USD bounce, but the move may fade as markets recognize it’s still a soft jobs number.
Above 100k: Would complicate the bearish USD narrative, as stronger data may support the greenback.
Context: Overall, the bias leans toward USD weakness unless a clear upside surprise emerges from NFP. Watching how USDJPY reacts around 148.500 will be key into the weekly close.
Trade safe,
Joe.

US30 Pullback Toward 44,600 Within Ongoing UptrendHey Traders, in today's trading session we are monitoring US30 for a buying opportunity around the 44,600 zone. Dow Jones (US30) is trading in an uptrend, with price currently correcting toward this key support/resistance level.
Structure: The broader bias remains bullish, but price is pulling back after recent highs.
Key level in focus: 44,600 — a significant area where buyers may look to step in and continue the upward trend.
Fundamentals: Market sentiment remains broadly supportive for equities, with risk appetite steady as investors weigh U.S. economic data and central bank policy outlook.
Trade safe,
Joe.

Gold Pullback Toward 3,510 as BRICS Demand and Dollar Weakness.Hey Traders, in today's trading session we are monitoring XAUUSD for a buying opportunity around the 3,510 zone. Gold is trading in an uptrend, with price currently correcting toward this key support/resistance level.
Structure: The broader bias remains bullish, but price is retracing after recent highs.
Key level in focus: 3,510 — an important zone where buyers may look to step in and resume the upward trend.
Fundamentals: Geopolitical alignment among Russia, China, India, and North Korea strengthens the case for continued gold purchases by BRICS central banks. At the same time, the U.S. Dollar Index (DXY) has broken below 98.400 support and could retrace further to the downside, adding to gold’s bullish backdrop through negative correlation.
Trade safe,
Joe.

Gold Dips to 3,440:Dollar Weakness Sets Stage for the Next SurgeHey Traders, in today's trading session we are monitoring XAUUSD for a buying opportunity around the 3,440 zone. Gold is trading in an uptrend, with price currently correcting toward this key support/resistance level.
Structure: The broader bias remains bullish, but price is pulling back after recent highs.
Key level in focus: 3,440 — an important area where buyers may look to step in and resume the trend.
Fundamentals: The U.S. Dollar Index (DXY) is approaching 98.400 resistance while maintaining a bearish tone. A weaker dollar continues to provide support for Gold, reinforcing the bullish context.
Trade safe,
Joe.

USDCAD Pullback Toward 1.37900 as Dollar Weakness PersistsHey Traders, in today's trading session we are monitoring USDCAD for a selling opportunity around the 1.37900 zone. USDCAD is trading in a downtrend, with price currently correcting toward this key support/resistance level.
Structure: The broader bias remains bearish, but price is retracing upward after recent lows.
Key level in focus: 1.37900 — a critical area where sellers may look to re-enter and push the pair lower.
Fundamentals: The U.S. Dollar Index (DXY) maintains a bearish tone as Jerome Powell’s recent dovish stance weighs on the greenback. With DXY approaching 97.800 resistance, further downside pressure on USD could reinforce USDCAD weakness.
Trade safe,
Joe.
