Gold Watching 3,360 Support as Powell Dovish Tone Weighs on USDHey Traders, in tomorrow's trading session we are monitoring Gold for a buying opportunity around 3,360 zone, Gold (XAUUSD) recently broke above the 3,360 resistance, turning it into an important support level to watch on any pullback. A retracement into this zone could help determine whether the breakout has strength to extend toward higher levels.
On the fundamental side, Fed Chair Powell struck a dovish tone, signaling support for a potential September rate cut, citing lower inflation pressures and risks in the labor market. This backdrop keeps USD under pressure and maintains a bullish bias for Gold in the near term.
Monitoring price action around 3,360 to assess whether buyers defend this level or if deeper consolidation unfolds.
Trade safe, Joe.
Abcpattern

APEUSDT – 1D AnalysisHey traders! 👋
Looking at APEUSDT on the daily chart, we can see that the market has completed a clear 5-wave impulse to the downside. After that strong bearish move, the resistance line was broken, which gave us the first signs of a potential reversal.
From there, we formed a smaller 5-wave impulse upwards, which could very well be wave A of an ABC zig-zag correction. Following that, wave B unfolded in what looks like an irregular correction.
👉 Now, I’m watching closely for wave C to unfold, which should take the form of another 5-wave impulse. According to Elliott Wave guidelines, wave C often equals the length of wave A. However, in this case, wave A was already quite extended, so I wouldn’t be overly optimistic with projections. The minimum correction target has already been reached, but structurally we’re still missing wave C – so I expect it to play out, potentially in the form of a rising wedge.
The good news is that the structure will become clearer as it develops, and we can adjust targets dynamically once price action confirms the pattern. For now, I’m eyeing the green zone as a possible target area for wave C.
📊 Potential Trade Levels:
Entry zone: 0.60 – 0.65 USDT
Stop Loss: 0.51 USDT
Target: 0.99 USDT
⚠️ Important reminder: This is not financial advice – just sharing my Elliott Wave perspective and how I’m viewing the structure right now. The market may develop differently, so please manage your own risk and adjust accordingly. Trade safe, friends! 🙌

XAUUSD – Watching 3,310 as Price Pulls BackHey Traders, in today's trading session we are monitoring XAUUSD for a buying opportunity around 3,310 zone, Gold (XAUUSD) has been moving lower after its recent swing high, with price now correcting toward the 3,310 area.
Structure: The broader bias has been bullish overall, but recent price action shows a corrective move.
Key level in focus: 3,310 — previously acted as support/resistance.
Next move: Holding above this zone could maintain the medium-term bullish bias, while a clear break below may open the way for deeper retracement.
Monitoring how price behaves around 3,310 to understand whether buyers will step in or if weakness continues.
Trade safe, Joe.

EURUSD Testing 1.16650 in Descending Channel as DXY Holds 98.100Hey Traders, in today's trading session we are monitoring EURUSD for a selling opportunity around 1.16650 zone, EURUSD continues to trade inside a descending channel, with price correcting upward toward 1.16650, a key resistance zone aligned with channel structure.
At the same time, the U.S. Dollar Index (DXY) remains in an uptrend and is approaching 98.100 support. With recent inflation readings running high, markets may expect a more hawkish Federal Reserve, which could support further USD strength.
Monitoring how EURUSD reacts near 1.16650 in relation to DXY’s price behavior to gauge whether bearish momentum will resume or consolidation will continue.
Trade safe, Joe.

AUDUSD Tests 0.64400 as DXY Strengthens on Fed BetsHey Traders, in today's trading session we are monitoring AUDUSD for a selling opportunity around 0.64400 zone, AUDUSD is correcting higher within its broader downtrend, with price approaching the 0.64400 resistance area. This zone aligns with prior supply and could be pivotal in determining whether bearish momentum resumes or a deeper retracement unfolds.
The U.S. Dollar Index (DXY) recently broke above the 98.700 key resistance, reinforcing its bullish bias. With U.S. inflation still elevated, markets are focused on potential hawkish commentary from the Federal Reserve at the Jackson Hole symposium — a factor that could further strengthen the dollar and weigh on AUDUSD.
Price action around 0.64400 will be critical in assessing whether sellers reassert control or the correction continues.

EURUSD is Nearing 1.17500 Important Resistance!!!Hey traders, in tomorrow's trading session we are monitoring EURUSD for a selling opportunity around 1.17500 zone, EURUSD is trading in a downtrend and currently is in a correction phase in which it is approaching the trend at 1.17500 support and resistance area.
Trade safe, Joe.

GBPUSD at 1.35250 Resistance as DXY Eyes 98.100 SupportHey Traders, in today's trading session we are monitoring GBPUSD for a selling opportunity around 1.35250 zone, GBPUSD is moving within a descending channel, with price correcting higher toward the 1.35250 resistance zone — an area that previously acted as support.
Meanwhile, the U.S. Dollar Index (DXY) remains in an uptrend and is approaching the 98.100 support area, which may influence GBPUSD direction if buyers step in.
Watching how GBPUSD reacts at 1.35250 in relation to DXY’s behavior could provide insight into whether the current correction ends or extends further.
Trade safe, Joe.

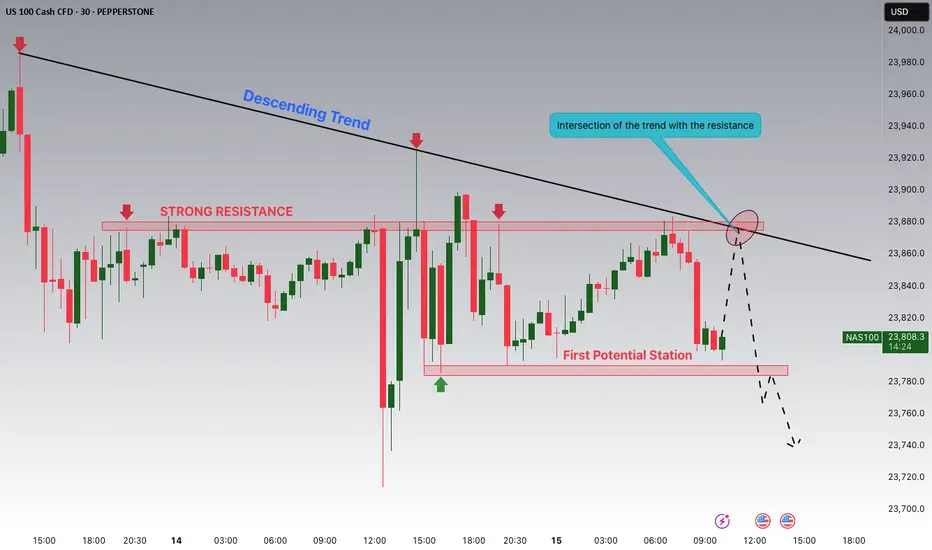
NASDAQ is Nearing the Intersection of The Trend with Resistance!Hey Traders, in today's trading session we are monitoring NAS100 for a selling opportunity around 23,875 zone, NASDAQ is trading in a downtrend and currently is in a correction phase in which it is approaching the trend at 23.875 support and resistance area.
Trade safe, Joe.
DXY Potential DownsidesHey Traders, in today's trading session we are monitoring DXY for a selling opportunity around 97.900 zone, DXY is trading in a downtrend and currently is in a correction phase in which it is approaching the trend at 97.900 support and resistance area.
Trade safe, Joe.

EURUSD Potential UpsiddesHey Traders, in today's trading session we are monitoring EURUSD for a buying opportunity around 1.15700 zone, EURUSD is trading in an uptrend and currently is in a correction phase in which it is approaching the trend at 1.15700 support and resistance area.
Trade safe, Joe.

USDJPY Breakout and Potential RetraceHey Traders, in today's trading session we are monitoring USDJPY for a selling opportunity around 148.900 zone, USDJPY was trading in an uptrend and successfully managed to break it out. Currently is in a correction phase in which it is approaching the retrace area at 148.900 support and Resistance area.
Trade safe, Joe.

NZDUSD is Nearing an Important Support Area!!Hey Traders, in today's trading session we are monitoring NZDUSD for a buying opportunity around 0.59300 zone, NZDUSD is trading in an uptrend and currently is in a correction phase in which it is approaching the trend at 0.59300 support and resistance area.
Trade safe, Joe.

AUDUSD: Gold Breakout & DXY Resistance Could Fuel Bulls!!Hey Traders,
In tomorrow’s session, we’re eyeing a buying opportunity on AUDUSD around the 0.65100 zone. The pair remains in an uptrend and is currently in a correction phase, approaching a key support level at 0.65100.
We’re also keeping a bullish bias on Gold, which is attempting to break and hold above 3,400. Given the positive correlation between Gold and AUDUSD, this could lend additional upside momentum to the pair.
Meanwhile, the DXY is approaching the 98.300 resistance. A rejection from this level could serve as a strong catalyst for AUDUSD bulls.
Trade safe, Joe.

EURGBP is Nearing the Daily Trend!!!Hey Traders, in the coming week we are monitoring EURBBP for a buying opportunity around 0.86400 zone, EURGBP is trading in an uptrend and currently is in a correction phase in which it is approaching the trend at 0.86400 support and resistance area.
Trade safe, Joe.

USOIL: Eyes on 64.10 as Geopolitics Take Center Stage!!In today’s session, we’re watching USOIL for a potential short setup around the 64.10 zone. Price action remains in a broader downtrend, with the current move looking like a corrective retracement into a key support turned resistance area.
From a fundamental perspective, all eyes are on the scheduled August 15 meeting between Donald Trump and Vladimir Putin. A ceasefire agreement could fuel bearish momentum, potentially accelerating the sell-off. On the other hand, if talks collapse, renewed geopolitical tension could keep oil prices bid in the short term.
Technically, 64.10 is the battleground a decisive rejection here could offer an attractive risk reward for sellers aligned with the dominant trend.

NASDAQ Potential UpsidesHey Traders, in today's trading session we are monitoring NAS100 for a buying opportunity around 23,300 zone, NASDAQ is trading in an uptrend and currently is in a correction phase in which it is approaching the trend at 23,300 support and resistance area.
Trade safe, Joe.

DXY: Trump's Goal is to Devalue the Dollar!!Hey Traders, in tomorrow's trading session we are monitoring DXY for a selling opportunity around 98.300 zone, DXY is trading in a downtrend and currently is in a correction phase in which it is approaching the trend at 98.300 support and resistance area. On the other hand Trump is looking towards devaluing the dollar in order to refinance the US depth and stimulate the economy.
Trade safe, Joe.

NZDUSD Potential UpsidesHey Traders, in today's trading session we are monitoring NZDUSD for a buying opportunity around 0.59050 zone, NZDUSD is trading in an uptrend and currently is in a correction phase in which it is approaching the trend at 0.59050 support and resistance area.
Trade safe, Joe.

EURUSD Potential UpsidesHey Traders, in today's trading session we are monitoring EURUSD fora buying opportunity around 1.15800 zone, EURUSD is trading in an uptrend and currently is in a correction phase in which it is approaching the trend at 1.15800 support and resistance area.
Trade safe, Joe.

Gold Potential UpsidesHey Traders, in today's trading session we are monitoring XAUUSD for a buying opportunity around 3,360 zone, Gold is trading in an uptrend and currently is in a correction phase in which it is approaching the trend at 3,360 support and resistance area.
Trade safe, Joe.

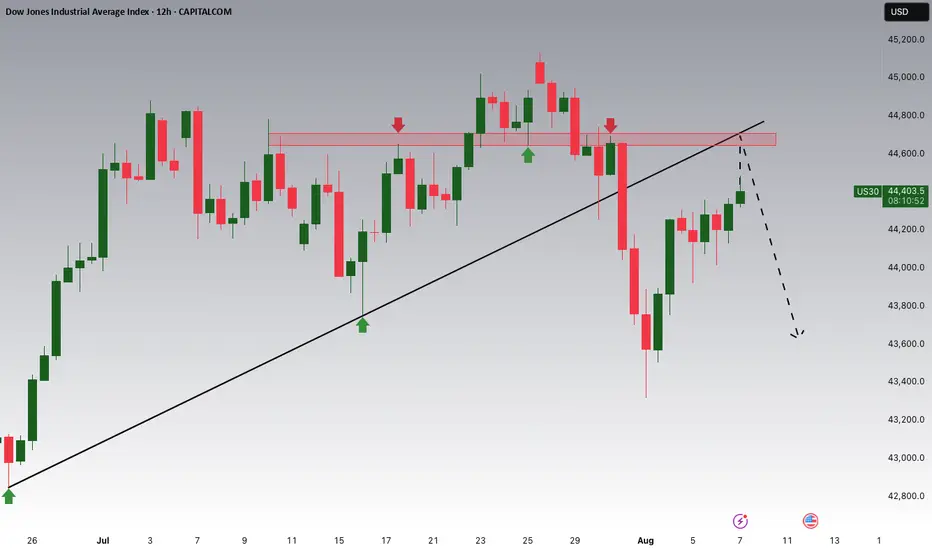
Dow Jones Breakout and Potential RetraceHey Traders, in today's trading session we are monitoring US30 for a selling opportunity around 44,650 zone, Dow Jones was trading in an uptrend and successfully managed to break it out. Currently is in a correction phase in which it is approaching the retrace area at 44,650 support and resistance area.
Trade safe, Joe.
USDJPY Breakout and Potential RetraceHey Traders, in today's trading session we are monitoring USDJPY for a selling opportunity around 148.300 zone, USDJPY was trading in an uptrend and successfully managed to break it out. Currently is in a correction phase in which it is approaching the retrace area at 148.300 support and resistance area.
Trade safe, Joe.

AUDUSD Breakout and Potential RetraceHey Traders, in today's trading session we are monitoring AUDUSD for a buying opportunity around 0.64700 zone, AUDUSD was trading in a downtrend and successfully managed to break it out. Currently is in a correction phase in which it is approaching the retrace area at 0.64700 support and resistance zone.
Trade safe, Joe.
