ACH Is About to Collapse? Smart Money Is Dumping!Yello Paradisers! Are you seeing what smart money is doing on #ACH right now, or are you about to become liquidity for the next leg down? This current move might look harmless to inexperienced traders… but the structure is telling a completely different story. And if you understand what the chart is really showing, you know this is not the place to get emotional.
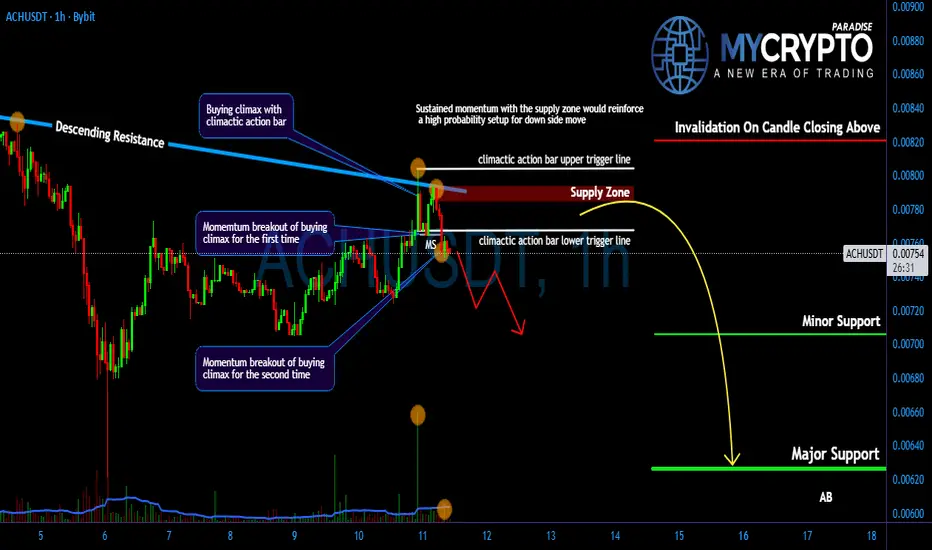
💎#ACH formed a buying climax followed by climactic action bar, strongly suggesting that institutional players are offloading and preparing for more downside move according to volume spread analysis (VSA).
💎#ACH breaks the lower trigger line of buying climax for the second time, which confirmed the weakness, if momentum holds, the next major target sits around 626 that could be tested soon.
💎#ACH respected the descending resistance and failed to break above it, which confirms ongoing weakness. #ACH momentum has now clearly shifted to the downside, as long momentum sustained within the supply zone, we can expect a further move down toward the minor support level of 707.
💎If #ACH manages to break above the key resistance at 822 with a strong momentum candle, this whole bearish probability would be invalidated, and we could instead see a bullish continuation. As always, we let price confirm our bias.
Discipline is key, Paradisers! The charts may look volatile, but this is where professionals thrive and amateurs panic. Don’t let emotions guide your trades. Wait for clear confirmation and manage risk like a pro. Strive for consistency, not quick profits. Treat the market as a businessman, not as a gambler.
MyCryptoParadise
iFeel the success🌴
ACHUSDT
ACH - Still Bullish - Macro retest at $0.04Discord AMA on 1/29
ACH will be attending the Hong Kong Consensus February 11-12, 2026
Still respecting the ascending parallel channel.
Close to second Take Profit.
Congratulations to all that followed this trade.
We are not done yet.
Macro retest is $0.04
Currently at $0.01246

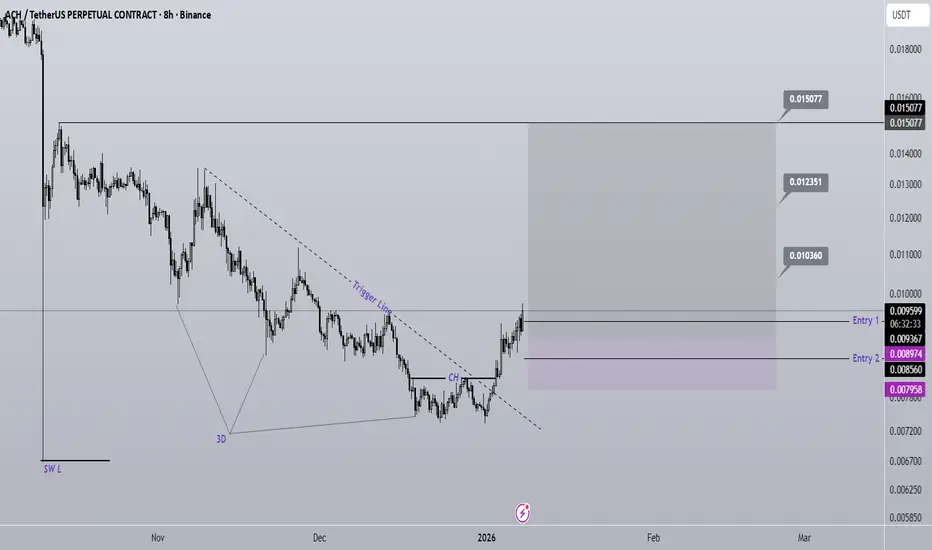
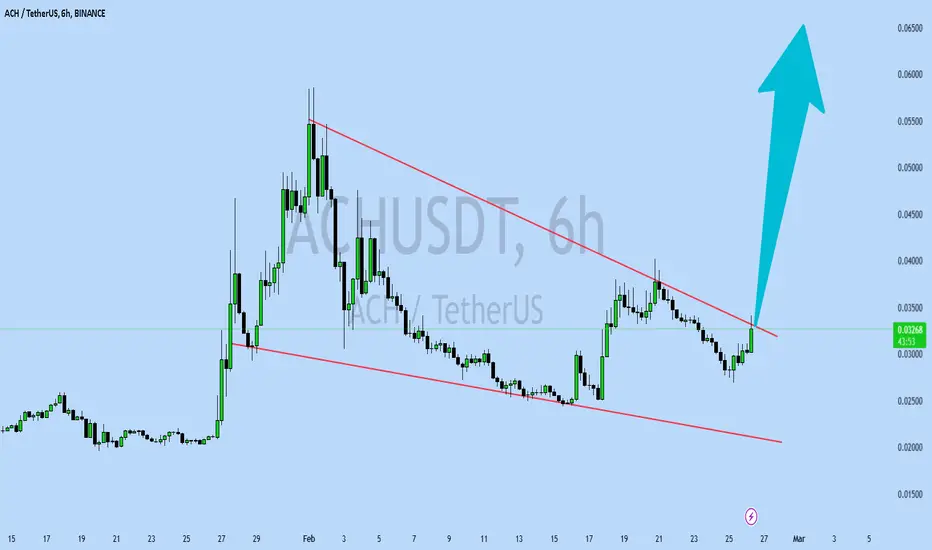
ACH will experience a strong pump soon (8H)The price has formed a bottom at a 3D pattern. This pattern indicates the liquidation of sellers, after which the price typically rebounds upward.
Our confirmation comes from the break of the trigger line. For some time, the price was unable to break this trigger line, but now it is trading above it, which clearly shows that buyers are strong.
Additionally, we have a bullish CH (Change of Character) on the chart, further confirming that strong buyers have appeared.
The current structure supports buy/long positions, which is why we are focusing on looking for long entries.
There are two entry points, which should be taken using a DCA (Dollar-Cost Averaging) strategy to manage risk and optimize the position.
Targets are marked on the chart. At the first target, consider taking partial profits, and then move your stop-loss to the entry point to protect your capital while keeping the remaining position active for potential further upside.
In summary:
Pattern: 3D bottom indicating seller liquidation
Confirmation: Price breaking above the trigger line
Bullish signal: CH on the chart
Strategy: Buy/long positions with DCA entries
Risk management: Partial profit at first target, stop-loss at entry
This setup highlights a strong bullish structure, giving traders a clear framework to participate while managing risk efficiently.
If you would like us to analyze a coin or altcoin for you, first like this post, then comment the name of your altcoin below.
ACH - Flashing BullishMacro & micro time frames look bullish for ACH.
SuperTrend bullish, MACD and RSI are flashing bullish
The gold lines/Take Profit zones will produce some great gains if triggered.

ACH - Looking prime for a bullish waveLooking at RSI Weekly timeframe we see the same RSI range like it was back in January 2023 that produced a bullish wave with almost a 500% gain shortly after.
I plotted 4 possible take profit zones for us.
Alchemy Pay’s price trajectory hinges on executing its compliance-driven roadmap while navigating a cautious market. Short-term volatility is likely, but successful Alchemy Chain adoption or RWA traction could reverse the 60% annual decline. Watch the Q4 2025 blockchain launch: Will it catalyze transactional demand for FWB:ACH , or face scalability hurdles?

ACH/USDT — Multi-Year Support Zone, Bounce or Breakdown?🔎 Overview
ACH/USDT is currently consolidating within a multi-year demand zone around ~0.01811 (highlighted in yellow). This level has acted as a strong support multiple times, producing significant reactions whenever price touched it.
However, each bounce from this area has been weaker than the last, forming lower highs — a clear sign of persistent selling pressure. Structurally, this resembles a descending triangle, where sellers are consistently pushing from above while buyers defend the same support zone.
This puts ACH at a critical crossroads:
Will buyers defend the support again and trigger a strong rebound?
Or will sellers finally break it down, opening the path toward new lows?
---
📌 Key Technical Levels
Main demand zone (support): 0.01811
Next supports if breakdown: 0.01400 → 0.00950 → historical low 0.00720
Major resistances (bullish targets):
0.02263
0.02867
0.03441
0.04075
0.04500
0.05059
---
📈 Bullish Scenario
Trigger: Weekly close above 0.02263 or a confirmed breakout from the lower-high structure.
Implication: Buyers successfully defend the multi-year demand zone and regain short-term control.
Targets: 0.02867 → 0.03441 → 0.04075 → 0.05059
Note: A sustainable breakout will require strong buying volume; otherwise, it risks being another failed rally.
---
📉 Bearish Scenario
Trigger: Weekly close below the 0.01811 demand zone.
Implication: Descending triangle confirms to the downside, signaling potential mid-term breakdown.
Targets: 0.01400 → 0.00950 → possibly retesting the historical low at 0.00720.
Note: A breakdown here could trigger capitulation, since this zone has long been a critical stronghold for buyers.
---
📊 Pattern & Sentiment
Dominant pattern: Descending Triangle (neutral-to-bearish bias).
Short-term sentiment: Neutral, awaiting reaction at the demand zone.
Mid-term sentiment: Bearish leaning, as repeated tests of support increase breakdown risk.
Catalysts: A broader crypto market recovery (BTC/ETH rally) could fuel upside, while weak market conditions may accelerate a breakdown.
---
📌 Conclusion
ACH/USDT is standing at a make-or-break zone. The multi-year support around 0.01811 is the last stronghold for buyers. A solid bounce could spark rallies toward 0.02867 and higher, but if the support breaks, a deep correction toward the historical lows near 0.00720 becomes likely.
Strategy:
Bullish traders: Wait for confirmed weekly breakout & retest.
Bearish traders: Watch for a confirmed weekly breakdown below 0.01811.
Neutral traders: Stay patient, as this zone may define ACH’s direction for the coming months.
---
#ACHUSDT #ACH #AlchemyPay #Crypto #Altcoin #ChartAnalysis #TechnicalAnalysis #SupportResistance #DescendingTriangle #BreakoutOrBreakdown

ACHUSDT - SPOT SETUP🚀SPOT - @Alchemy @AlchemyPay @binance
🔥 Buy Zone: $0.02041 - $0.02051
🎯 TP1: $0.02142 | TP2: $0.02169 | TP3: $0.0226
Always DYOR before this...

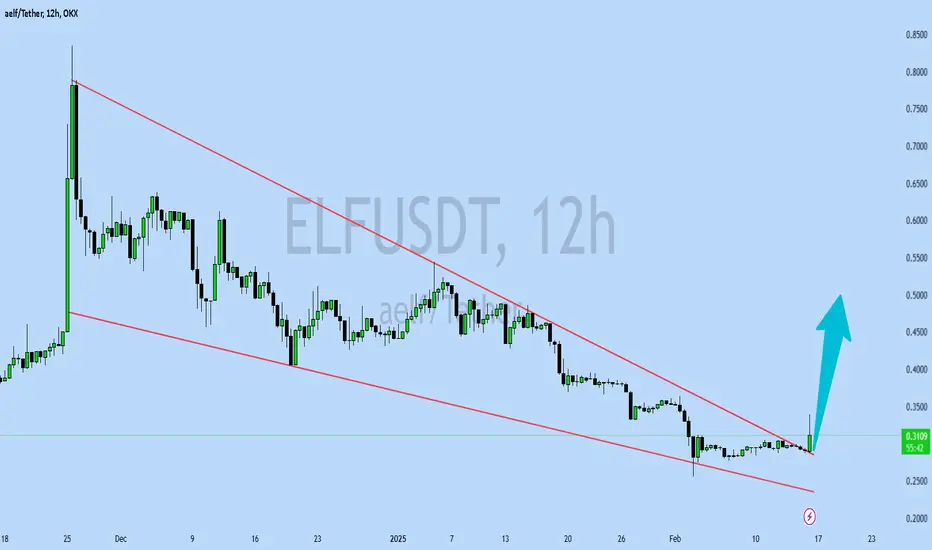
ACHUSDT Forming Descending ChannelACHUSDT is currently displaying a promising descending channel pattern, which is a classic technical setup often seen before a bullish reversal. The price has consistently respected the upper and lower bounds of the channel, and recent price action indicates a potential breakout. With good volume support, this setup gains even more credibility, suggesting growing interest and confidence among market participants. As of now, traders are eyeing a potential 40% to 50% upside move as the price attempts to escape the downtrend and head toward key resistance levels.
Alchemy Pay (ACH) continues to gain traction due to its role in connecting traditional finance systems with the crypto economy. As the project expands partnerships and improves its payment infrastructure, the coin is becoming more attractive to both retail and institutional investors. This growing interest is reflected in its trading volume, which aligns with the current bullish chart pattern and builds the case for a strong short-term rally.
From a technical standpoint, the descending channel has compressed price action over several weeks, and this type of structure often precedes large price moves once a breakout occurs. Traders watching for confirmation may look for strong bullish candles above resistance with high volume. A breakout from this level could act as a springboard for a rapid upward price movement, especially in favorable market conditions.
✅ Show your support by hitting the like button and
✅ Leaving a comment below! (What is You opinion about this Coin)
Your feedback and engagement keep me inspired to share more insightful market analysis with you!
ACHUSDTHello everyone. This is purely my vision in connection with the resignation of the head of the Federal Reserve, Jerome Powell. The lending rate will be reduced and this will cause a reaction in the markets. I consider this seller's block as the first stopping point.

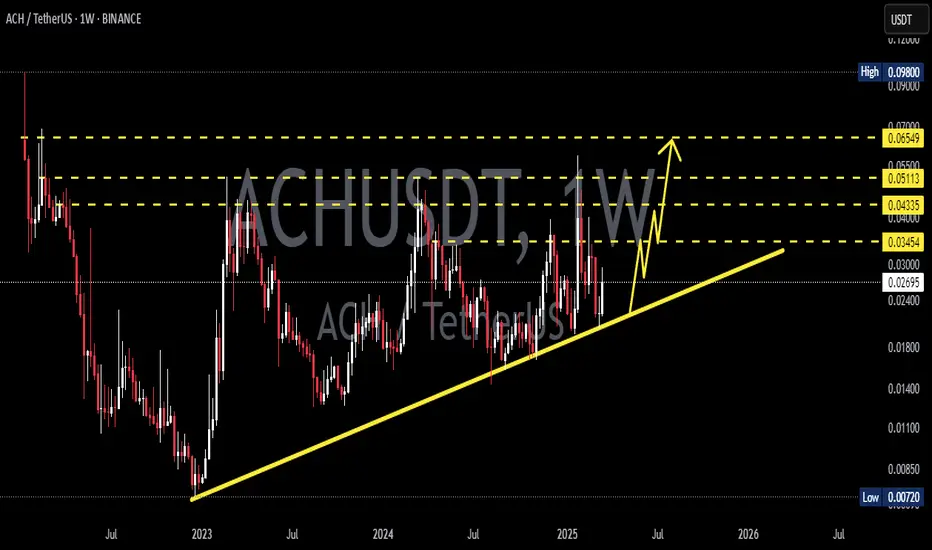
ACH/USDT at a Historical Pivot Zone — Is a Major Reversal🔍 In-Depth Weekly Chart Analysis of ACH/USDT
ACH/USDT is currently retesting a critical historical demand zone between $0.01876 – $0.02263, which has consistently acted as a major accumulation area since late 2022. This zone has served as the launchpad for multiple bullish moves in the past and is now being tested once again.
Interestingly, price action appears to be forming a long-term consolidation base, potentially a triple bottom pattern or a classic accumulation phase, which often precedes significant impulsive rallies.
✅ Bullish Scenario (High-Probability Reversal)
If price successfully:
1. Holds above $0.01876, and
2. Breaks above minor resistances at $0.02263 and $0.02867
Then a bullish reversal is likely, with price targeting the following resistance levels:
🔸 $0.02867 — structural resistance
🔸 $0.03441 — neckline zone of the accumulation pattern
🔸 $0.04075 — key psychological level
🔸 $0.05059 — full measured move target from the base pattern
Should momentum and market sentiment align, ACH could even test the $0.065–$0.098 range, especially if volume supports a breakout continuation.
Key confirmation: A weekly close above $0.02867 with strong volume would signal a clear breakout from accumulation.
❌ Bearish Scenario (Breakdown from Critical Support)
On the flip side, if price fails to hold:
A weekly breakdown and close below $0.01876 will invalidate the bullish structure.
This could lead to a decline toward:
$0.01400 — minor support
$0.01000 – $0.00720 — historical bottom zone
This would likely reflect a capitulation phase, particularly if accompanied by negative macro sentiment across the broader crypto market.
📈 Technical Pattern Structure
📌 Triple Bottom + Long-Term Accumulation = Early Reversal Signal
📌 Multiple rejections off the support zone = Buyer defense still strong
📌 Increasing volume near lows = Signs of smart money accumulation
📌 Formation of higher lows in the coming weeks will reinforce bullish momentum
💬 Market Psychology Insight
After prolonged sideways action, many retail traders tend to exit
This creates ideal conditions for smart money to accumulate quietly
A breakout from this zone could trigger mass FOMO, accelerating price action
🧠 Conclusion
ACH/USDT currently offers a highly attractive risk-to-reward setup, especially for swing traders and medium-term investors. The zone being tested is a make-or-break level that could dictate the next major trend. A confirmed breakout could mark the beginning of a powerful expansion phase.
#ACHUSDT #CryptoAnalysis #AltcoinReversal #BullishSetup #TechnicalAnalysis #TripleBottom #BreakoutTrade #SwingTradeOpportunity #CryptoOpportunities

#ACH/USDT#ACH
The price is moving within a descending channel on the 1-hour frame and is expected to break and continue upward.
We have a trend to stabilize above the 100 moving average once again.
We have a downtrend on the RSI indicator, which supports the upward move by breaking it upward.
We have a support area at the lower limit of the channel at 0.01800, acting as strong support from which the price can rebound.
Entry price: 0.01878
First target: 0.01925
Second target: 0.01970
Third target: 0.02025

ACHUSDT 1W AnalysisACH ~ 1W Analysis
#ACH This trade is very high risk. Buy from here if you still have confidence in this coin with a short term target of 20%+.

ACHUSDT ShortThe ACHUSDT ticker has sharply deviated from both the 4-hour and daily EMA50 levels without undergoing a retest. I anticipate a price correction towards these EMAs within the next few days. Targets are marked on the chart.

Alchemy Pay - April 2025Potential Bull Flag for ACH. Watch carefully. This chart is not investment advice. Always do your own research!

ACH/USDT Analysis – Joining the Long SideWe are considering a continuation of the long position on this coin through two scenarios:
a false breakout below the $0.02664 level,
or a test and reaction from the volume zone at $0.025–$0.024.

Long Entry Signal for ACH/USDT - Bullish Setup (Daily Chart)
Symbol:
Timeframe: Daily
Analysis:
MLR > SMA: The MLR (blue) is above the SMA (pink), signaling a bullish trend.
MLR > BB Center: MLR exceeds the Bollinger Bands Center Line (orange), showing strong bullish momentum.
PSAR: PSAR dots (black) are below the price, reinforcing the uptrend.
Price > SMA 200: Price is above the 200-period SMA (red), indicating long-term bullish strength.
Trade Idea:
Entry: Consider a long position at the daily close.
Stop Loss: Place SL at the current PSAR level to limit downside risk.
Follow Me: Follow me for exit or profit-taking opportunities.
Outlook: All indicators align for a bullish move. Stay alert for reversal signals or trend shifts.
Risk Warning: Not financial advice, trade at your own risk

ACHUSDT 1WACH ~ 1W Analysis
#ACH This coin is still in a bullish trend. Buy when re -testing this support with a short -term target of at least 15%+.
Bearish opportunity in ACH1. We want price to at least head to the order blck meanthreshold
2. We have structure shift in H1
2. We have turtlesoup confirming liquidity grab
4. We are at H1 Orderblocks
ALTERNATIVE SCENARIO;
We have very clean buyside in 0.024228 and 0.024228 That pose a risk to downside orderflow

Long Signal Entry for ACH/USDT
Based on the daily chart for ACHUSDT on Bybit, here's a concise analysis:
MLR vs. SMA: The MLR (blue) is above the SMA (pink), indicating a bullish trend.
MLR vs. BB Center: The MLR is above the BB Center Line (orange), suggesting bullish momentum.
PSAR: The PSAR dots (black) are under the price, confirming a bullish trend.
Price vs. SMA 200: The price is above the 200-period SMA (red), supporting a long-term bullish trend.
Current Strategy: Since all entry conditions for a long position are met (MLR above SMA, MLR above BB Center, PSAR under price, price above SMA 200), you might consider entering a long position. You can enter now or wait for the close of the day, depending on your availability. Waiting for the close of the day would be preferred to confirm the trend.
Stop Loss (SL): Set the stop loss at the current level of the PSAR dots to manage risk.
Monitor My Idea: Keep monitoring my idea for any changes in trend or potential profit-taking opportunities.

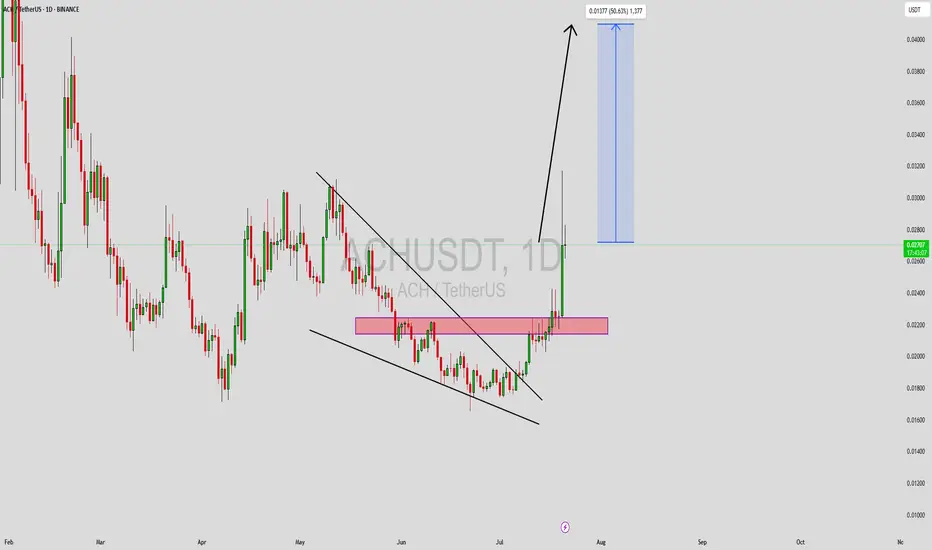
ACHUSDT UPDATEACHUSDT is a cryptocurrency trading at $0.03285. Its target price is $0.06500, indicating a potential 90%+ gain. The pattern is a Bullish Falling Wedge, a reversal pattern signaling a trend change. This pattern suggests the downward trend may be ending. A breakout from the wedge could lead to a strong upward move. The Bullish Falling Wedge is a positive signal, indicating a potential price surge. Investors are optimistic about ACHUSDT's future performance. The current price may be a buying opportunity. Reaching the target price would result in significant returns. ACHUSDT is poised for a potential breakout and substantial gains.
ACHUSDT(AlchemyPay) Updated till 18-02-25ACHUSDT(AlchemyPay) Daily timeframe range. last pump fully retraced now its trying to push back for recovery. confirm close above 0.03076 can send it to 0.04700 if volume keeps up. local support at 0.01999.

MKRUSDT UPDATEMKRUSDT is a cryptocurrency trading at $1,116. Its target price is $1,700, indicating a potential 55%+ gain. The pattern is a Bullish Falling Wedge, a reversal pattern signaling a trend change. This pattern suggests the downward trend may be ending. A breakout from the wedge could lead to a strong upward move. The Bullish Falling Wedge is a positive signal, indicating a potential price surge. Investors are optimistic about MKRUSDT's future performance. The current price may be a buying opportunity. Reaching the target price would result in significant returns. MKRUSDT is poised for a potential breakout and substantial gains.
MLong

IDUSDT UPDATEIDUSDT is a cryptocurrency trading at $0.3183. Its target price is $0.5000, indicating a potential 50%+ gain. The pattern is a Bullish Falling Wedge, a reversal pattern signaling a trend change. This pattern suggests the downward trend may be ending. A breakout from the wedge could lead to a strong upward move. The Bullish Falling Wedge is a positive signal, indicating a potential price surge. Investors are optimistic about IDUSDT's future performance. The current price may be a buying opportunity. Reaching the target price would result in significant returns. IDUSDT is poised for a potential breakout and substantial gains.