Can America Break China's Rare Earth Monopoly?USA Rare Earth (Nasdaq: USAR) stands at the center of America's most ambitious industrial gamble in decades. The company pursues a vertically integrated "mine-to-magnet" strategy designed to break China's stranglehold on rare earth elements, critical materials that power everything from electric vehicles to F-35 fighter jets. With China controlling 70% of global mining and over 90% of refining capacity, the United States faces a strategic vulnerability that threatens both its defense capabilities and its energy transition. Recent Chinese export restrictions on gallium and germanium have accelerated USA Rare Earth's timeline, with commercial production now targeted for late 2028, two years ahead of previous guidance.
The company's success hinges on extraordinary government backing and massive capital infusions. A $1.6 billion letter of intent from the Department of Commerce, combined with a $1.5 billion private investment, provides $3.1 billion in potential funding. The government will take a 10% equity stake, signaling an unprecedented public-private partnership in critical infrastructure. This funding supports the entire value chain: extraction at the Round Top deposit in Texas, chemical separation in Colorado, and advanced magnet manufacturing in Oklahoma. The Round Top deposit itself is geologically unique, a 1-billion-metric-ton laccolith containing 15 of 17 rare earth elements, processable through cost-effective heap leaching rather than traditional roasting.
Beyond minerals, the project represents a test of American industrial resilience. The Trump administration's "Project Vault" initiative establishes a $12 billion strategic mineral reserve modeled after the Strategic Petroleum Reserve. International alliances with Australia, Japan, and the United Kingdom create a network of "friend-shored" supply chains designed to counter Beijing's leverage. USA Rare Earth's acquisition of UK-based Less Common Metals provides critical refining expertise currently unavailable outside China. The company achieved a milestone in January 2026 by producing its first batch of sintered neodymium magnets at its Oklahoma facility, proving its technical capabilities.
The path forward remains treacherous. Critics point to timeline delays, insider selling, and the volatility inherent in pre-revenue mining ventures. Short sellers have claimed a potential 75% downside, questioning equipment age and promotional tactics. Yet the strategic imperative is undeniable: without domestic rare earth capacity, the United States cannot maintain technological superiority in defense or achieve energy independence. USA Rare Earth's 2030 goal of processing 8,000 tons of heavy rare earths and producing 10,000 tons of magnets annually would fundamentally reshape global supply chains. The billion-dollar race for magnet supremacy will determine whether America can reclaim industrial sovereignty or remain dependent on geopolitical rivals for the minerals of the future.
Act

[LOI] - WolfSpeed - WolfSpeed Inc.
Key Points:
Bullish Outlook on Wolfspeed : Research suggests Wolfspeed is well-positioned for growth in silicon carbide (SiC) demand, driven by EVs, AI data centers, and renewables, with potential margin expansion as new fabs ramp up. However, financial risks like debt and dilution temper absolute confidence.
CHIPS Act Benefits : Wolfspeed has secured significant support, including nearly $700M in tax refunds received and up to $750M in grants, enabling U.S. expansions that enhance domestic supply chains.
On-Shoring Advantages : U.S. semiconductor reshoring efforts align with Wolfspeed's investments in North Carolina and New York facilities, potentially bolstering national security and economic resilience amid global competition.
Key bearish insiders :
- November 14, 2025: Soros Fund Management added new put positions in NYSE:WOLF , part of a portfolio update including other hedges like NASDAQ:SMH puts.
Notes on how I personally use my charts/NFA:
Each level L1-L3 and TP1-TP3 (Or S1-S3) has a deployment percentage. The idea is to flag these levels so I can buy 11% at L1 , 28% at L2 and if L3 deploy 61% of assigned dry powder. The same in reverse goes for TP. TP1: 61%, TP2:28% and TP3:11%. If chart pivots between TP's, in-between or in Between Sell levels these percentages are still respected. I like to use the trading range to accumulate by using this tactic.
Just my personal way of using this. This is not intended or made to constitute any financial advice.
This is not intended or made to constitute any financial advice.
NOT INVESTMENT ADVICE
I am not a financial advisor.
The Content in this TradingView Idea is for informational purposes only, you should not construe any such information or other material as legal, tax, investment, financial, or other advice. Nothing contained within this idea constitutes a solicitation, recommendation, endorsement, or offer to buy or sell any securities or other financial instruments in this or in in any other jurisdiction in which such solicitation or offer would be unlawful under the securities laws of such jurisdiction.
All Content on this idea post is information of a general nature and does not address the circumstances of any particular individual or entity. Nothing in the idea/post constitutes professional and/or financial advice, nor does any information on the idea/post constitute a comprehensive or complete statement of the matters discussed or the law relating thereto. You alone assume the sole responsibility of evaluating the merits and risks associated with the use of any information or other Content on the idea/post before making any decisions based on such information.
Sir. Galahad - QUANT
Disclaimer
The information and publications are not meant to be, and do not constitute, financial, investment, trading, or other types of advice or recommendations supplied or endorsed by.

JPMorgan Maintains Neutral Rating on Enact (ACT)JPMorgan Maintains Neutral Rating on Enact (ACT) with Slight Target Adjustment Post-Q3 Earnings
On November 7, JPMorgan analyst Richard Shane reaffirmed a Neutral rating on Enact Holdings, Inc. (NASDAQ: ACT) while modestly reducing his price target to $39 from $40. This adjustment followed the company’s third-quarter 2025 financial update, as reported by The Fly.
Third-Quarter 2025 Financial Overview
Enact reported total revenue of $311.4 million, a slight increase from the $309.5 million recorded in the same quarter last year. Premiums for the quarter came in at $244.6 million, compared to $249 million in Q3 2024. The company’s liquidity position remained stable, with $339 million in cash and cash equivalents and an additional $311 million in invested assets as of September 30. Management noted that the combined liquidity pool was essentially unchanged from the previous quarter, as share repurchases and regular dividend payments largely offset the capital contributions from its EMICO subsidiary.
Key Operational Metrics Show Steady Growth
New insurance written during the quarter reached $14 billion, representing a 6% increase from Q2 2025 and a 3% year-over-year rise. The product mix remained heavily weighted toward monthly premium policies, which accounted for 97% of the volume, while purchase originations made up 93%. Primary insurance in force grew marginally to $272 billion, up from $270 billion in the prior quarter and $268 billion a year earlier. During the quarter, Enact continued its commitment to shareholder returns, distributing $31 million in dividends.
Industry Context: Property & Casualty Insurance in Q3
Enact operates within the broader Property & Casualty (P&C) insurance sector, which is known for its cyclicality. The industry tends to perform well during "hard markets," characterized by rising premium rates that outpace claims and cost inflation. Conversely, profitability can compress during "soft markets." External factors such as interest rates—which influence investment yields—and long-term challenges like increasing catastrophe losses due to climate change and rising litigation costs ("social inflation") also shape sector performance.
Among the 33 P&C insurance stocks tracked, the group reported a strong collective quarter, with revenues exceeding consensus estimates by 3.8% on average. Following their earnings releases, these stocks have remained resilient, posting an average gain of 4.6%.
Enact’s Position and Market Performance
As a leading U.S. private mortgage insurer, Enact plays a vital role in the housing ecosystem by enabling lenders to offer mortgages with lower down payments—thereby expanding access to homeownership—while assuming default risk on behalf of lenders. The company’s Q3 revenue of $311.5 million was essentially flat compared to the prior year and aligned with analyst expectations. Although it was a relatively slower quarter with only a narrow beat on earnings per share estimates, the stock has responded positively, rising 8.3% since the earnings release to trade around $38.90.
Technical Perspective and Price Levels
From a technical standpoint, Enact’s share price is currently situated below the revised JPMorgan target of $39. Key support zones to monitor are located near $35, $34, and $31, which could serve as potential areas of buyer interest should any near-term pullbacks occur. On the upside, a take-profit target around $42 remains a relevant resistance level for traders and investors looking for continued upward momentum.
In summary, while JPMorgan’s slight target trim reflects a cautious near-term outlook, Enact’s stable operational performance, disciplined capital management, and strategic role in the mortgage market continue to support a steady investment case within the Neutral rating framework.

ACTUSDT Forming Bullish PennantACTUSDT is showing a bullish pennant pattern on the charts, which is typically considered a continuation signal of upward momentum. After a strong upward move, the price is now consolidating within a tight range, forming a pennant structure. This kind of setup often precedes another breakout to the upside, backed by good trading volume and renewed market confidence.
The current volume activity suggests that buyers are maintaining control, and a breakout from this formation could lead to a significant rally. With expectations of a 50% to 60%+ gain, ACTUSDT is positioning itself as a strong candidate for traders looking for short- to mid-term bullish opportunities. Investors should closely monitor resistance zones, as a confirmed breakout above them could fuel rapid price expansion.
Market interest in ACTUSDT has been rising, with more traders recognizing its technical strength. As momentum builds and the pennant nears completion, volatility could increase, giving investors opportunities to benefit from sharp price movements. The alignment of bullish technical patterns with growing investor participation creates a favorable environment for sustained growth.
✅ Show your support by hitting the like button and
✅ Leaving a comment below! (What is You opinion about this Coin)
Your feedback and engagement keep me inspired to share more insightful market analysis with you!
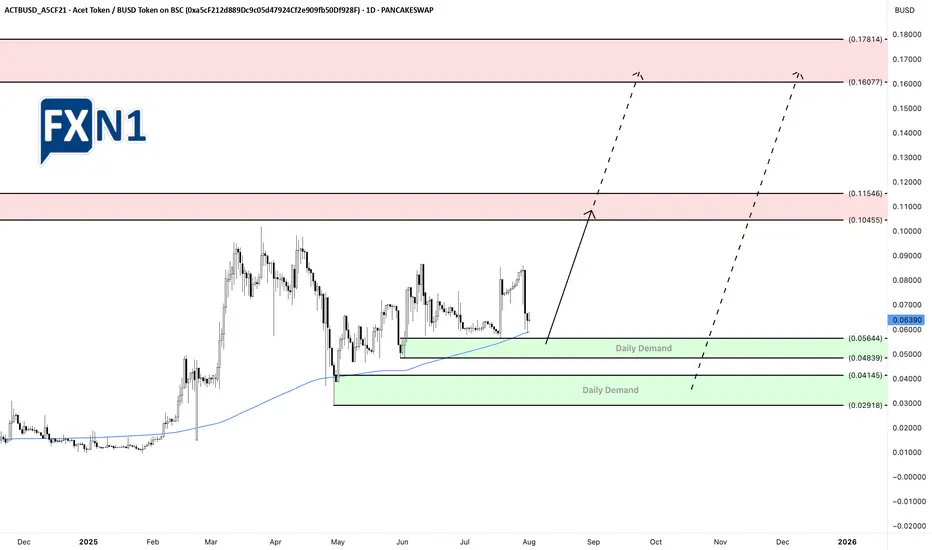
Acet Token’s Price Analysis: Levels and Future PotentialsThe Acet Token (ACT) is currently nearing a critical daily demand zone at 0.05644, suggesting a potential opportunity for a bullish move or a strategic entry at a discounted rate. Additionally, there is another fresh daily demand level at 0.04145, which could present an even more attractive entry point for those willing to buy at a lower price. Looking ahead, the token might retest higher levels around 0.10445, which stands as our primary target for future gains.
Acet (ACT) stands out in the crowded cryptocurrency field by pioneering the "Initial Zero Supply" model, aimed at tackling issues related to token oversupply. Developed by Thai trader and entrepreneur Acme Worawat, Acet is more than just a digital asset—it represents a movement towards integrating cryptocurrencies into larger economic systems. Built on Binance Smart Chain (BSC) and compliant with the BEP-20 standard, Acet employs a Zero Initial Supply strategy, where tokens are generated through Liquidity Mining. This process involves users staking assets in designated pools, with smart contracts ensuring transparent, secure, and efficient token issuance.
✅ Please share your thoughts about ACT in the comments section below and HIT LIKE if you appreciate my analysis. Don't forget to FOLLOW ME; you will help us a lot with this small contribution.
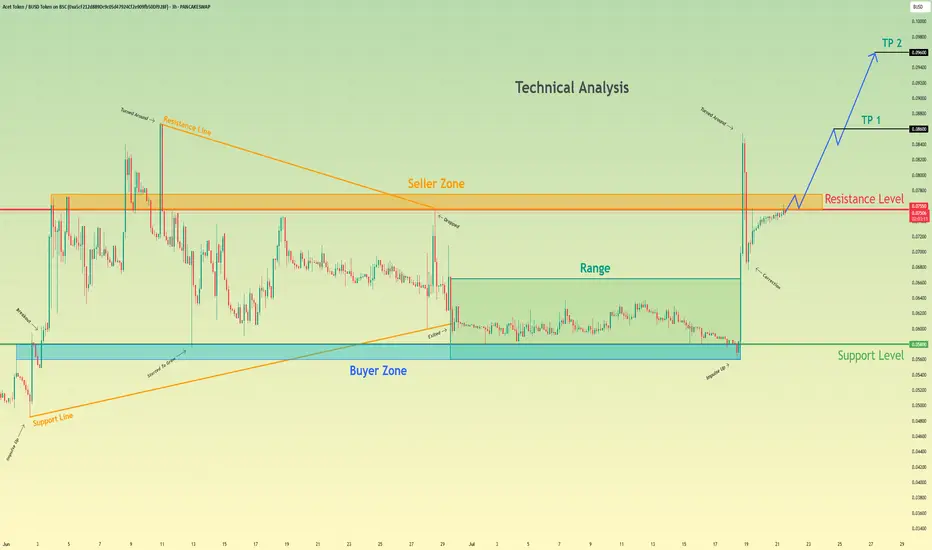
Acet Token will break resistance level and continue to move upHello traders, I want share with you my opinion about Acet Token. Looking at the recent price action, we can see a clear narrative unfolding. The asset initially formed a large wedge pattern, experiencing a trend reversal that led to a breakdown and a period of prolonged consolidation within a defined range between the buyer zone around 0.0580 and the upper boundary. Recently, however, the market showed a strong impulse, breaking out of this range and decisively moving upwards. Currently, the price of act is testing the key resistance level at 0.0755, an area historically defined as a seller zone. The hypothesis is that after this powerful impulse, the asset will manage to break and hold above this resistance. A successful retest of the 0.0755 level would likely signal a continuation of the uptrend, paving the way towards our specified take-profit targets. The first goal is set at TP 1 at 0.0860, with a further extension to TP 2 at 0.0960, capitalizing on the anticipated bullish momentum. Please share this idea with your friends and click Boost 🚀
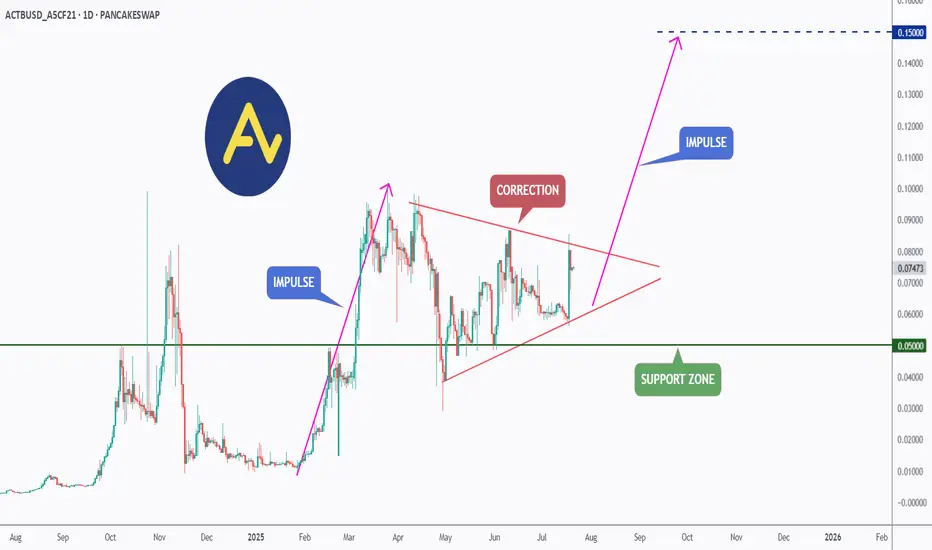
ACT (Acet) - Eyeing the Next Impulse Move?ACT has been forming a textbook bullish continuation pattern.↗️
After a strong impulse leg earlier this year, price has been consolidating within a symmetrical triangle, signaling a healthy correction phase.
🏹Today, ACT broke out of the triangle to the upside , indicating that bulls may be taking control once again.
📍If momentum continues, the next impulse move could push price toward the $0.15 resistance as a first target — a major psychological and technical level.
As long as the $0.050 support holds, ACT remains in bullish territory with upside potential in sight.
📚 Always follow your trading plan regarding entry, risk management, and trade management.
Good luck!
All Strategies Are Good; If Managed Properly!
~Richard Nasr
ACTUSDT Forming Classic Falling Wedge ACTUSDT is currently exhibiting a classic falling wedge pattern on the chart—a bullish reversal setup known for its high probability of a breakout to the upside. After a consistent downtrend, the price action has started to compress within converging trendlines, suggesting that selling pressure is diminishing. A breakout above the wedge's resistance line could trigger a sharp price surge. Technical traders often look to such formations for potential entries, especially when combined with growing volume and renewed market sentiment.
Volume analysis reveals a notable uptick in recent sessions, signaling that investors are beginning to accumulate ACTUSDT. This increased interest could be due to fundamental news or broader market momentum returning to altcoins. When volume expands near the apex of a falling wedge, it usually reinforces the validity of the pattern and strengthens the breakout potential. With this setup, the projected move points to a possible gain of 140% to 150%, aligning with previous key resistance levels that the price could retest post-breakout.
On a momentum front, indicators like RSI and MACD are starting to turn bullish, offering early signs of a reversal. The price is also holding above short-term support zones, suggesting the formation of a base. The combination of technical structure, volume dynamics, and improving sentiment makes ACTUSDT a strong contender for a breakout move in the near term. Such opportunities are especially attractive in trending markets where capital rotates quickly into coins showing strong chart setups.
Given this confluence of bullish signals, ACTUSDT could become a leading performer in the altcoin space over the coming weeks. Traders and investors are advised to keep a close watch for breakout confirmation and subsequent retest levels, which could offer optimal entry points for both short-term gains and medium-term swing setups.
✅ Show your support by hitting the like button and
✅ Leaving a comment below! (What is You opinion about this Coin)
Your feedback and engagement keep me inspired to share more insightful market analysis with you!

Continuation of the PORTO trendAccording to porto, the picture resembles alpine, the goal is also to try to take the level of 1.5 with the opening of the second half of the quarter higher, which will create the ground for a stable trend immediately to 2.5. The main medium-term goal is the range of 2.5-3.5, where large volumes of purchases were previously left. I would like to note that the level of 2.5 is the threshold for the growth of volatility, and in case of its breakdown, any growth wave can give an impulse up to 5 and 7.5. If there is insufficient volatility, there is a possibility of a rollback to a 0.9-1.0 retest and a second attempt to take 1.5 by the beginning of the new month.
Porto Lazio adm city acm does not have futures on finance yet and may be added in the near future, which will cause a wave of growth up to 100%+ for these tokens. Together with this group, I am considering alpine for work, while the rest of the fan tokens are still in a more overbought zone.

A likely move by ALPINEToday, the market looks very optimistic. The week on air opened above 2500, which compensates for sales on a weekly schedule. You can continue to keep working on fantokens to maintain growth in a row. In the absence of a significant market drawdown, an additional wave of purchases of up to 70-100% from current levels is likely. Binance also continues to support this group of instruments by adding futures. There is a possibility of a new announcement regarding atm city acm tomorrow.
To date, the fan token group remains the most undervalued instruments on binance. In addition to ATM AND ACM, which are the most oversold among them, I am considering the work of ALPINE in connection with the recent addition of futures on binance and listings on several small exchanges. These factors can contribute to significant liquidity inflows and growth. A technical signal was also left for a breakdown of the strong resistance of 1.5, which will open the way immediately to 2.5. In an optimistic scenario, an attempt to open above 1.5 in the second half of the quarter can be expected in the next few days, which will pave the way for purchases until the end of the half-year. In a more negative scenario and a drawdown of ether below 1400-1500, there is a possibility of a slight pullback and an attempt to consolidate above 1.5 for ALPINE already in the last days of the month in order to open a new monthly candle above this level. This rollback will provide an additional opportunity to top up the position and make a profit. I would like to draw your attention to the fact that the main level for increasing volatility is 2.5, in case of a breakdown of which there is a possibility of a growth impulse to 5.0 and 7.5.

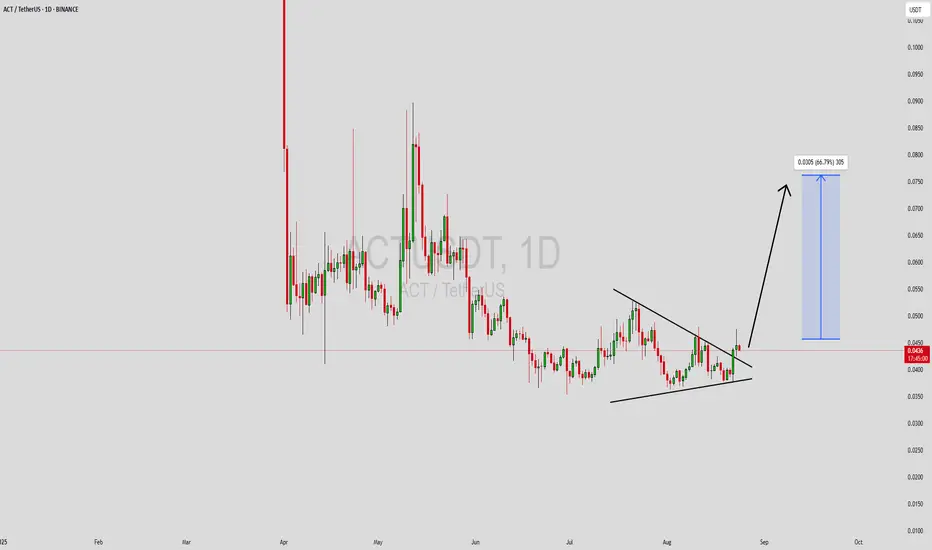
On the zero line of the borderACTUSDT – Daily Technical Analysis
After experiencing a 74% correction, ACT has reached a major support level at $0.0480 , where the price has currently stabilized. From this zone, there is a potential upside move of 26%, targeting the resistance at $0.0650.
However, traders should closely monitor the support level, as a confirmed breakdown below $0.0480 could trigger a bearish flag continuation pattern, potentially leading to another 74% drop.
🟢 Support: $0.0480 (major level)
🔴 Resistance: $0.0650 (26% above current price)
⚠️ Risk: Breakdown could activate a bearish flag and resume the downtrend

ACT: Classic Range Accumulation with Breakout Potential#ACT is showing clean sideways movement with classic deviations—textbook accumulation. Horizontal volume is stacked right in the middle, confirming the range is solid.
This one’s coiling up for a move. Follow me so you’re in before it breaks out. 🚀
Entry: 0.052-0.0536
TP: 0.068
SL: 0.0463

BTC is still bullish!!!🚨 CRYPTOCAP:BTC is dipping hard! 🚨
📍 All eyes on $72,000 — this could be the ultimate buy zone:
🔽 Why this level matters:
1️⃣ Bottom of the blue wedge
2️⃣ Flipped resistance → support
3️⃣ Major demand zone
4️⃣ Classic -34% pullback move
📊 This could be a textbook entry point.
Are you ready to catch the bounce?

Public trade #5 - #ACT price analysis ( Act I: The AI Prophec )Nowadays, the #ACT coin is quite hype.
And most platforms display the OKX:ACTUSDT chart as circled above.
What do you think of this full price chart of #ACTUSDT presented by us?)
Scary, isn't it?)
👀 We are going to watch this asset for now #ActITheAIProphecy
And we would dare to buy not earlier than if the price falls into the Buy zone $0.024 - $0.036 - $0.048
_____________________
Did you like our analysis? Leave a comment, like, and follow to get more

The AI Prophecy: Marketwide Bullishness ProofThis is a chart and pair that I showed you recently. Why am I showing it to you again?
This is the proof.
The Altcoins market is bullish and the Altcoins market can only be bullish when Bitcoin is either growing or set to grow.
Notice the last five days, how did Bitcoin perform?
When Bitcoin crashes, everything crashes but, look at this divergence between Bitcoin and many Altcoins.
Look at the last five days for ACTUSDT, or many others, and what do you see?
➖ This pair remains strong and trading above EMA13.
➖ This pair is super-bullish, above a consolidation pattern and ready to grow.
➖ This pair broke out of a downtrend is now ready to move up.
This and other Altcoins cannot grow while Bitcoin goes down toward 40K, that's not how Bitcoin/Crypto works.
The market grows when Bitcoin grows.
What this chart reveals is a hidden bullish bias, the bottom is already in. We are going up now.
Hold patiently. Feel secure and feel safe because Cryptocurrency is set to grow like never before.
Thanks a lot for your continued support.
Namaste.

ACTUSDT 1WACT ~ 1W Analysis
#ACT Buy after successfully penetrating this resistance line, with a short -term target of at least 15%+.
Reason, The seller's pressure seems to have been completed.

$ACT ANALYSIS!NASDAQ:ACT is testing the black resistance line ⚫.
✅ If breakout is successful, the first target is the green line level 🟩.

ACT ANALYSIS (4H)ACT is in a major correction. This correction is a large-degree diametric. It now appears to have entered the bearish G wave.
The price is pulling back into zones where sell orders exist to complete wave G.
A daily candle closing above the invalidation level will invalidate this analysis.
For risk management, please don't forget stop loss and capital management
Comment if you have any questions
Thank You

ACT Coin NEXT POSSIBLE MOVES AND TRADE SETUPS !!NASDAQ:ACT Coin Update & Next Possible Moves!!
• Right now NASDAQ:ACT Coin price trading in a falling wedge on 1D Tf & overall structure look bearish.
• but once its break its resistance trendline then minimum 30% bounce back expected.
• Let's see what happened.
Warning : That's just my analysis DYOR Before taking ant action🚨

Trading opportunity for ACTUSDTBased on technical factors there is a Sell position in :
📊 ACTUSDT
🔴 Sell Now
🪫Stop loss 0.238000
🔋Target 0.114000
📏 R/R 2
💸RISK : 1%
We hope it is profitable for you ❤️
Please support our activity with your likes👍 and comments📝

$ACT - Long SetupAltcoins have been down so bad from their highs, but I'm still expecting high volatility this week.
Just taking this one with a tight stoploss just below 0.15 (low)
Long at current market price (cmp) , dca level at 0.165
Targets:
tp1 - 0.20
tp2 - 0.25
tp3 - 0.32

Trading opportunity for ACTUSDTBased on technical factors there is a Buy position in :
📊 ACTUSDT
🔵 Buy Now
🪫Stop loss 0.243000
🔋Target 0.287000
📏 R/R 2
💸RISK : 1%
We hope it is profitable for you ❤️
Please support our activity with your likes👍 and comments📝

ACT - LONG - Good opportunityACT is now ready to give us a chance. Despite being a little late it is still in a good place for daily timeframe. This is a moderate risk trade, as we have a small confirmation and good support. These currencies are also very volatile and high leverage should not be used.
TP 1: 0.42
TP 2: 0.58
TP 3: 0.63 (It's not very likely, but it could be).
SL 1: 0.2368
SL 2: 0.21
-
First trade of 2025, have a happy new year.
