ADAUSDT - 1H - WHAT TO EXPECT TODAY ? 03-02-2026ADAUSDT - still kinda on the "move" and after some "INSTITUTIONAL" manipulations will continue DOWN...
Sadly any Set- Ups for trades "mutated " and multiply to 5m failed set ups, developed institutional "accumulation" and SL sweep range .
I'm not going to repost a pretty much similar charts for the most crypto pairs. After some analysing by your self you will find a plenty of Institutional manipulations today...
Stay "SAFE" today, don't rush with entering trades, seems going to be Loss Stop "hunting" day...
Educational "piece":
An Institutional Stop Loss (SL) Sweep (also known as a liquidity sweep or stop hunt)
is a trading concept within Smart Money Concepts (SMC)
where large financial institutions deliberately drive prices beyond well-defined support or resistance levels to trigger the clustered stop-loss orders of retail traders
Chart is itself explaining. Kept a "KISS" approach all the way ( "Keep It Simple, Stupid") & beginners friendly... ;)
I do hope that nobody ignoring SL ( Stop Loss) ! Without it, It is a fastest way to loose hard earned money...
;)
Trade safe & don't do "gambling". In the end it never pays, not worth it to risk loose all your $...
PS: above technical analysis is done for the community & educational purpose only! It is not a financial advice. Just share my very own insight to it.
Adausdtanalysis

ADAUSDT - ACCUMULATION/INSTITUTIONAL/RETAIL SL 03-02-2026ADAUSDT - G-Money's short version analysis based purely on technical analysis only, no nonsense or "BS". I do totally ignore any fundamental analysis, technical analysis only
ADAUSDT - still kinda on the "move" and continue DOWN...All the way down to 0.2000-0.1880 ....
ACCUMULATION PHASE, Institutional traders gonna to "clear up" a plenty retail stop loses again....
Thought of the day: sometimes you can "win" much more money by not trading...
Wisdom of G-Money2022 :)
Chart is itself explaining. Kept a "KISS" approach all the way ( "Keep It Simple, Stupid") & beginners friendly... ;)
I do hope that nobody ignoring SL ( Stop Loss) ! Without it, It is a fastest way to loose hard earned money...
;)
Trade safe & don't do "gambling". In the end it never pays, not worth it to risk loose all your $...
PS: above technical analysis is done for the community & educational purpose only! It is not a financial advice. Just share my very own insight to it.

Cardano (ADAUSDT) — W1 Price at Major Support | Descending ChannCardano (ADAUSDT) — W1 Price at Major Support | Descending Channel | Triangle Structure
🔎 Market Structure (Weekly)
On the weekly timeframe, ADA is approaching a strong long-term support zone while remaining in a clear descending trend.
Key technical factors:
Price is moving toward the lower boundary of the descending channel
Market remains below key resistance levels
Overall structure is still bearish, with sellers in control
At this stage, ADA is not showing confirmed reversal signals on the higher timeframe.
📐 Pattern & Wave Context
• A triangle structure has recently formed within the downtrend
• This may act as a compression phase before the next impulsive move
• The triangle itself does not confirm a reversal
• Directional bias remains to the downside until proven otherwise
Any bullish scenario requires confirmation on lower timeframes (H4 / D1).
📍 Key Support Zone
Current price is testing a major historical support area
This level may trigger:
A technical bounce
Or continuation toward lower Fibonacci extensions
Reaction at this level is critical for further portfolio decisions.
🎯 Targets & Projections
Future targets should be defined based on Fibonacci levels and emerging patterns, depending on how price reacts to support:
• If support fails — continuation toward lower Fibonacci extensions
• If support holds — potential corrective or impulsive move upward, only after confirmation
At the moment, short positions remain preferable.
🧠 Trading & Investment Notes
• This is a high-timeframe zone, not an entry signal by itself
• No portfolio accumulation without confirmation on lower TF
• Shorts are still favored while price remains below channel resistance
• Watch for ABC completion or impulsive breakout before changing bias
📌 Summary
ADA is trading near a strong weekly support, but the primary trend remains bearish.
The current triangle formation may precede an impulsive move, however selling pressure still dominates.
Until a confirmed bullish structure appears on lower timeframes, short scenarios remain the priority, while long-term accumulation should be postponed.

ADAUSDT - A QUICK SELL SET UP - 30-01-2026ADUSDT - G-Money's short version analysis based purely on technical analysis only, no nonsense or "BS". I do totally ignore any fundamental analysis, technical analysis only
ADAUSDT - still kinda on the "move" and continue DOWN... Done run for 1H already...4H IS NOT FINISHED YET...Search for entry on the LTF. SL "must be", don't get ruined down by big money...
Who did enter this trade earlier congratulations! Who missed it... See you next time! ;)
Chart is itself explaining. Kept a "KISS" approach all the way ( "Keep It Simple, Stupid") & beginners friendly... ;)
I do hope that nobody ignoring SL ( Stop Loss) ! Without it, It is a fastest way to loose hard earned money...
;)
Trade safe & don't do "gambling". In the end it never pays, not worth it to risk loose all your $...
PS: above technical analysis is done for the community & educational purpose only! It is not a financial advice. Just share my very own insight to it.

ADAUSDT - A QUICK SELL SET UP - 29-01-2026ADAUSDT - G-Money's short version analysis based purely on technical analysis only, no nonsense or "BS". I do totally ignore any fundamental analysis, technical analysis only
ADAUSDT - still kinda on the "move" and continue DOWN...
Who did enter this trade earlier congratulations! Who missed it... See you next time! ;)
Chart is itself explaining. Kept a "KISS" approach all the way ( "Keep It Simple, Stupid") & beginners friendly... ;)
I do hope that nobody ignoring SL ( Stop Loss) ! Without it, It is a fastest way to loose hard earned money...
;)
Trade safe & don't do "gambling". In the end it never pays, not worth it to risk loose all your $...
PS: above technical analysis is done for the community & educational purpose only! It is not a financial advice. Just share my very own insight to it.

ADAUSDT Near Major Breakout Level — Trend Reversal or Bull Trap?On the 12-hour timeframe, ADAUSDT remains within a clear medium-term downtrend structure. Over the past few months, price has consistently formed lower highs and lower lows, capped by a dominant descending trendline.
However, recent price action shows an early bullish reaction from the lower support area, suggesting a potential transition phase or a short-term relief rally.
---
Pattern & Technical Structure
Primary Pattern:
Descending Trendline / Bearish Channel Breakdown Test
Price has been trading below the descending trendline (dynamic resistance) for an extended period.
The latest candles indicate a retest of the trendline, which now acts as a critical decision zone.
The marked horizontal levels (yellow dashed lines) represent key historical support and resistance zones.
Pattern Summary:
As long as price remains below the trendline, the broader structure stays bearish. A valid break and close above the trendline would be the first signal of a potential trend reversal or short-term bullish continuation.
---
Key Levels
Major Resistance:
0.413
0.468
0.520
High Resistance / Reversal Zone:
0.616 – 0.682
Key Support:
0.370
0.345
0.321 (structural low)
---
Bullish Scenario
Price successfully breaks and closes above the descending trendline (12H close).
Trendline flips into support after a successful retest.
Upside targets:
TP1: 0.413
TP2: 0.468
TP3: 0.520
If bullish momentum and volume expand, further upside toward 0.616 – 0.682 becomes possible.
Bullish Confirmation:
Higher low formation
Minor market structure shift
Strong candle close, not just a wick
---
Bearish Scenario
Price fails to break the trendline and forms a clear rejection (long upper wick / bearish engulfing).
Price revisits lower support zones:
First support: 0.370
Next support: 0.345
Worst-case scenario: 0.321 (new lower low)
A breakdown below 0.321 would confirm continuation of the major downtrend.
Bearish Confirmation:
Clear rejection at the trendline
Lower high formation
Increasing selling volume
---
Conclusion
ADAUSDT is currently at a critical decision zone.
The macro trend remains bearish, but the recent bullish reaction from lower support opens room for a short-term reversal or relief rally.
Traders are advised to wait for confirmation — either a breakout or rejection — at the trendline, as this area will define the next major move.
---
#ADA #ADAUSDT #Cardano #CryptoAnalysis #TechnicalAnalysis #Downtrend #Trendline #SupportResistance #Altcoins

ADAUSDT: Bullish Push to 0.45?BINANCE:ADAUSDT is eyeing a bullish rebound on the 4-hour chart , with price forming higher lows after touching the downward trendline and cumulative long liquidation zone, converging with a potential entry area that could ignite upside momentum if buyers defend against short-term dips. This setup suggests a reversal opportunity amid recent downtrend, targeting higher resistance levels with strong risk-reward .🔥
Entry between 0.3780–0.3880 for a long position. Targets at 0.43 (first), 0.45 (second). Set a stop loss at a daily close below 0.37 , yielding a risk-reward ratio of approximately 1:2.5 to first target and up to 1:3.5 overall . Monitor for confirmation via a bullish candle close above entry with rising volume, leveraging the pair's momentum post-rebound.🌟
📝 Trade Setup
🎯 Entry (Long):
0.3780 – 0.3880
(Entries within this zone are valid with proper risk & capital management.)
🎯 Targets:
• 0.43 (first)
• 0.45 (second)
❌ Stop Loss:
• Daily close below 0.37
⚖️ Risk-to-Reward:
• Up to 1:3.5 overall
💡 Your view?
Does ADA hold this demand zone and push toward 0.45 — or is this rebound just a dead-cat bounce before another leg lower? 👇

ADAUSDT —Breakout: 0.4355–0.4150 Will Decide the Next Trend?ADA is approaching a critical phase after successfully breaking above a major descending trendline that has guided the market lower for weeks. This breakout signals a potential shift in momentum, but the bullish move is not confirmed yet. Everything now depends on how price reacts to the 0.4355–0.4150 demand zone, the yellow block on the chart.
This zone is not just a simple consolidation range; it is the area where buyers previously stepped in aggressively and prevented deeper downside. If price retests this zone and holds, the breakout gains strong validity and opens the door for a broader trend reversal.
The breakout has happened. The market will now decide whether this is the beginning of a larger bullish leg, or merely a relief bounce within the existing downtrend.
---
Bullish Scenario
The bullish case remains intact as long as ADA holds above the 0.4355–0.4150 zone. A clean retest followed by a strong bullish 8h close would confirm buyers are in control.
If bullish confirmation holds:
First target: 0.5200, a key pivot resistance
Break above 0.52 leads to the next level at 0.5925
Sustained momentum could push ADA into the 0.6800–0.7300 zone
A full extension points toward the 0.8750 supply area, the larger upside magnet
As long as the yellow zone holds, the bias remains bullish.
---
Bearish Scenario
The bearish outlook only activates if price convincingly breaks back below 0.4150, invalidating the breakout and signaling that sellers still dominate the trend.
If a breakdown occurs:
Initial downside target sits around 0.375–0.360, the previous structural lows
Losing this level opens the possibility of forming a new lower low
In short, bearish momentum returns only if the key demand zone fails.
---
Pattern & Market Structure
Clean breakout from a major descending trendline
Price currently testing the transition phase between downtrend continuation or higher-low formation
The 0.4355–0.4150 zone acts as the trend validation zone, the most critical area on the chart
This is the most important structural zone ADA has interacted with in weeks.
#ADA #Cardano #ADAUSDT #CryptoAnalysis #Breakout #DemandZone #TechnicalAnalysis #MarketStructure

#ADAUSDT: Two Targets Both Possible, Let's See How Price MoveADAUSDT collapsed following the announcement of new tariffs on China, which caused fear in the cryptocurrency market and affected minor currency pairs. This led to a significant drop in the price of ADAUSDT. A minor decline may occur before the price reverses. There are two potential targets for the price to reach.
Entry area:
- We have identified the key area where a price reversal is likely to occur.
We wish you the best of luck and trade safely.
Team Setupsfx
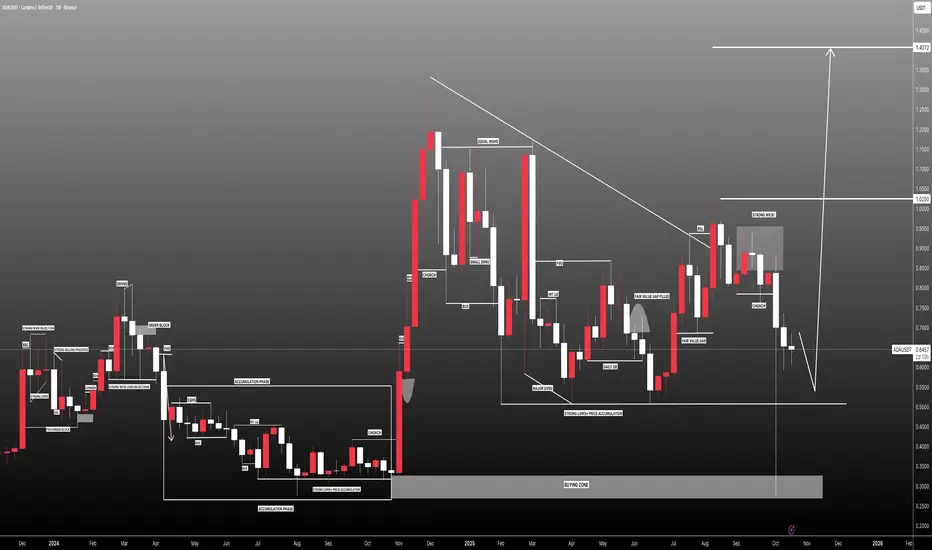
ADA/USDT — at a Make-or-Break Zone: Will Bulls Defend?Cardano (ADA) is now sitting at a critical decision point, testing the major demand zone between 0.55–0.625 USDT — a key level that has acted as the foundation for multiple rallies since early 2024. This zone represents the battlefield between long-term buyers and sellers, where price reactions have historically triggered large directional moves.
Recently, ADA experienced a deep liquidity sweep, leaving a long wick below the zone — a common sign of stop-loss hunting or institutional accumulation. Such moves often occur before a trend reversal, making this area one of the most strategic zones to watch in the coming weeks.
---
Pattern and Market Structure Analysis
The yellow block (0.55–0.625) is a macro demand/support zone, repeatedly tested and defended by buyers.
Main resistances are located at 0.9239, 1.2075, and 1.3264, forming the upper bounds of ADA’s broader trading range.
The overall structure shows a wide consolidation phase, potentially signaling re-accumulation if the current zone holds.
The long wick beneath support reflects a liquidity grab, often used by smart money to fill large buy orders before an upward move.
---
Bullish Scenario — Potential Start of a Major Rebound
1. Price holds and rebounds from 0.55–0.625 with a strong bullish reversal candle (bullish engulfing, hammer, or pin bar).
2. Increasing buying volume confirms accumulation interest at this level.
3. A clean breakout and daily close above 0.9239 would confirm bullish continuation toward 1.20 and 1.32.
4. Formation of a higher low above 0.625 will further validate a new uptrend structure.
🎯 Bullish Targets:
TP1: 0.92
TP2: 1.20
TP3: 1.32
📉 Suggested Stop Loss: Below 0.53 (outside the demand zone).
Narrative:
If this pattern confirms, ADA could begin a new major recovery wave, potentially marking the start of a strong uptrend cycle heading into 2026.
---
Bearish Scenario — Breakdown and Failed Retest
1. Price fails to hold above 0.55 and closes decisively below the yellow zone.
2. High selling volume confirms continuation pressure.
3. A failed retest of 0.55–0.625 as new resistance strengthens bearish momentum.
4. The next key downside targets are 0.40 and 0.27, both major liquidity levels.
🎯 Bearish Targets:
TP1: 0.40
TP2: 0.27
📈 Confirmation: Daily candle close below 0.55 with strong volume.
Narrative:
If this support collapses, ADA could enter a mid-term redistribution phase, potentially setting a new bottom before the next macro bull run.
---
Conclusion and Strategic Outlook
The 0.55–0.625 zone is ADA’s make-or-break region — a critical level that will likely define its direction for the months ahead.
Holding the zone could trigger a strong reversal rally toward 0.92–1.32.
Losing it would confirm a bearish continuation toward 0.27.
Traders should wait for confirmation through daily candle closes and volume surges before committing to major positions.
This zone offers both a high-risk accumulation opportunity for patient investors and a decisive pivot area for short-term traders.
---
#ADA #Cardano #ADAUSDT #CryptoAnalysis #TechnicalAnalysis #PriceAction #SupportZone #ReversalZone #Altcoin #CryptoMarket #DemandZone

#ADAUSDT: Is the crypto hype finally over? ADAUSDT is likely to drop first then it can reverse and continue the bullish move upwards of previous all time high. Before we can confirm any entry on this pair we need strong confirmation which will allow us to predict a correct and accurate swing move.
If you like the work then do consider liking and commenting on the idea.
Team Setupsfx_❤️

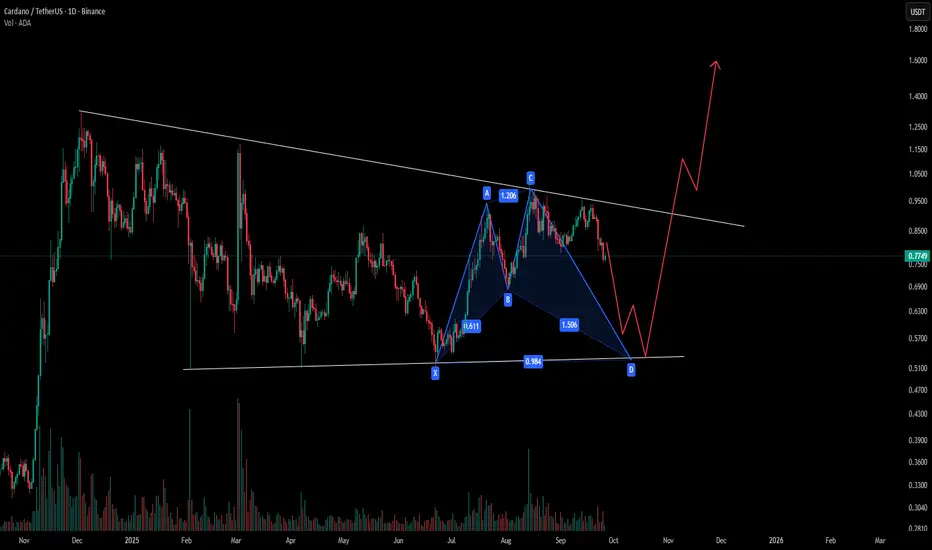
ADA analysisFrom the current structure, I think price may continue lower to retest the trendline support before setting up for a reversal.
The harmonic pattern visible on the chart also supports this idea — suggesting that the market could complete the pattern with a touch of the trendline before turning back higher.
If this plays out, I see potential for ADA to bounce strongly and work its way back toward the 2024 highs.
It’s also worth highlighting that Cardano remains a fundamentally strong project in the crypto space, and that broader strength gives more weight to the long-term bullish outlook once technical retracements play out.
🎯 Conclusion: This is my analysis — not financial advice. I don’t want to see people lose money in the markets, but from a technical standpoint, the chart points to a likely move into the trendline first, followed by a possible recovery toward prior highs.
👉 For more structured market insights and professional analysis, follow along.
ADA/USDT: Bullish Rise to 0.96?BINANCE:ADAUSDT is gearing up for a bullish move on the 4-hour chart , with an entry zone between 0.87-0.85 near a key support and trendline.
The target at 0.96 aligns with the next resistance, signaling strong upside potential. Set a stop loss on a close below 0.8450 to manage risk effectively.
🌟Entry is suitable even right now with proper risk management.
📝 Trade Plan:
✅ Entry Zone: 0.85 – 0.87 (support + trendline area)
❌ Stop Loss: Daily close below 0.8450 to manage risk
🎯 Target: 0.96 (next resistance)
Ready for this lift-off? Drop your take below! 👇

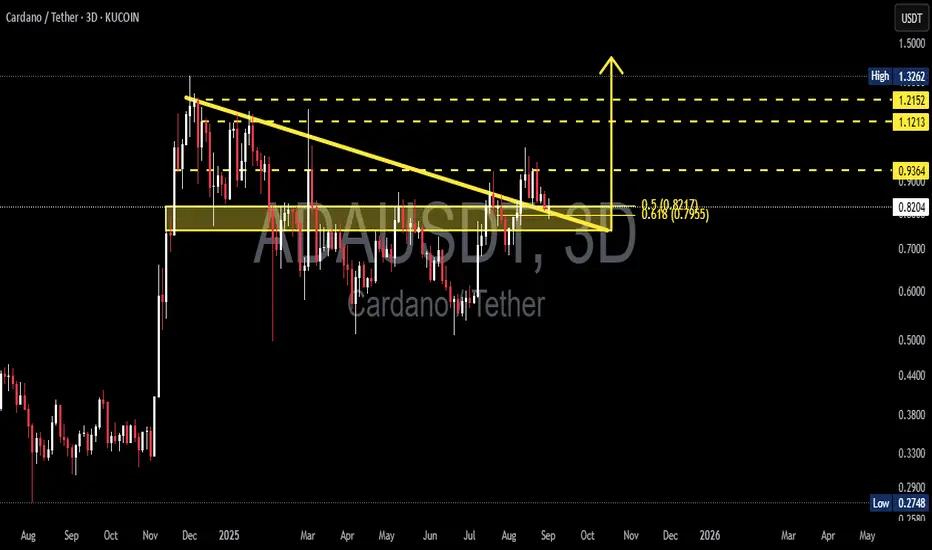
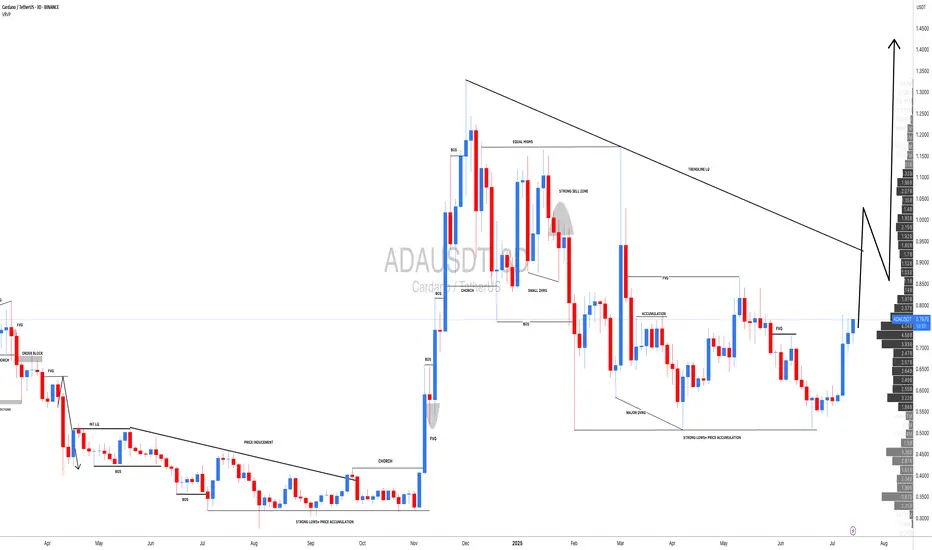
ADA/USDT — Breakout & Retest at a Critical Fibonacci Zone!
Currently, Cardano (ADA/USDT) is at a decisive point on the 3D timeframe, where price has just broken out of a mid-term downtrend line and is now retesting a very strong support area.
---
🔎 Technical Structure & Pattern
Downtrend line has been broken to the upside → sign of trend reversal.
Price is retesting a confluence support zone (0.78 – 0.83) consisting of:
Historical support/resistance (yellow box).
Fibonacci retracement 0.5 (0.8217) and 0.618 (0.7955).
This setup forms a classic “breakout & retest” pattern — where old resistance potentially flips into new support. If it holds, ADA could confirm a mid-term bullish continuation.
---
🟢 Bullish Scenario
If the price holds and closes above 0.795–0.821, bullish momentum remains valid.
Potential upside targets:
R1 = 0.9364 (short-term swing target).
R2 = 1.1213 (strong confirmation of trend shift).
R3 = 1.2152 (key resistance before major highs).
R4 = 1.3262 (major high & psychological zone).
In this scenario, ADA could stage a significant rally if market sentiment supports it.
---
🔴 Bearish Scenario
If the price breaks down below 0.7955 (Fib 0.618), the bullish setup may turn into a false breakout.
Downside targets to watch:
Previous consolidation range around 0.60–0.70.
Deeper support near 0.44.
Worst-case scenario: retesting the major low at 0.27.
---
📌 Conclusion
ADA is currently at a make-or-break level.
As long as price holds above 0.795–0.821, the bias remains bullish with targets at 0.94 – 1.12 in the mid-term.
A failure to hold this zone would shift bias to bearish, opening the way for deeper corrections.
Traders should closely monitor price action & volume around this retest, as it will determine ADA’s next big move.
---
📝 Notes
Always apply risk management (stop-loss & position sizing).
Wait for 3D/weekly candle close confirmation.
This is technical analysis, not financial advice.
#Cardano #ADA #ADAUSDT #CryptoBreakout #CryptoTrading #TechnicalAnalysis #PriceAction #Altcoins #CryptoSetup
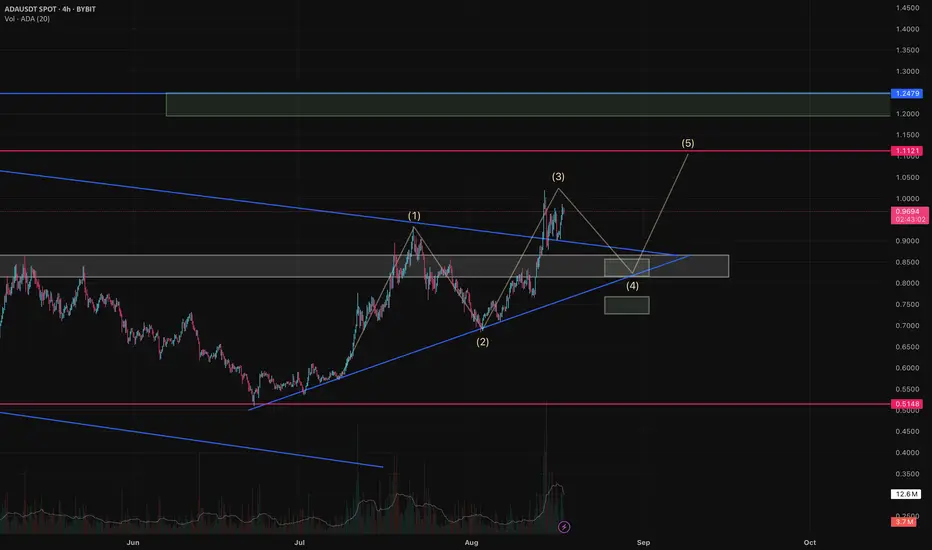
ADA After Channel Breakout — What’s Next?ADA has broken out of a downtrend channel and signals the start of a new trend. The breakout also came with higher volume that shows us that buyers are full of power.
The 3rd Elliot wave looks complete to me, so I'm expecting the market may correct into wave 4 before the next impulse up.
Scenarios:
Bullish:
Price holds above 0.82-0.85 support
Next targets are 1.11 and 1.20-1.25 later
Bearish/correction:
If 0.85 fails, price may fall to 0.72-0.75
RSI hints a correction, but the buy volume supports bulls
Key levels:
Support: 0.85
Resistance: 1.11
Target: 1.25
Disclaimer: The author’s opinion may not align with yours.
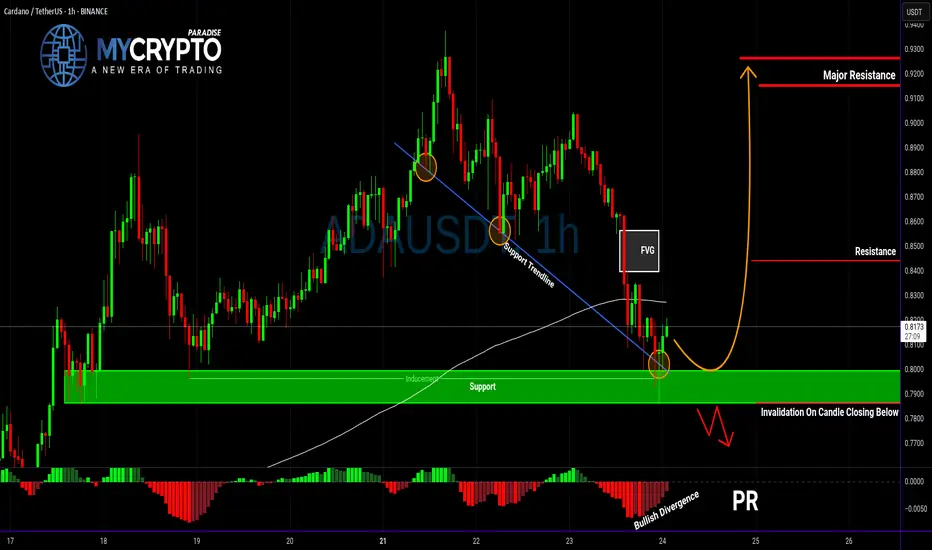
ADAUSDT: Bullish Breakout Loading or Painful Trap Ahead?Yello Paradisers, are we about to witness ADAUSDT explode to the upside, or is this just the market luring in impatient traders before the real move? The current setup is looking dangerous — in a good way for those who know how to play it.
💎ADAUSDT has broken out of a descending channel and found support at the 200 EMA. On top of that, we have bullish divergence showing on both the RSI and Stoch RSI — a rare alignment that significantly increases the probability of a bullish push.
💎If ADAUSDT pulls back, it could provide entry opportunity with even better RR, while aggressive entries remain risky — especially for beginners.
💎But here’s the key: if price breaks down and closes candle below our invalidation level, the bullish outlook is completely off the table. In that case, patience will be our best weapon, waiting for cleaner price action before making any moves.
🎖Strive for consistency, not quick profits. Treat the market as a businessman, not as a gambler.
MyCryptoParadise
iFeel the success🌴

ADAUSDT Breaks Long-Term Downtrend – Critical Support Retest!The ADAUSDT pair is showing a compelling technical setup. The price has successfully broken out of a long-term descending trendline (yellow line) that had been acting as dynamic resistance since late 2024. This breakout came with strong momentum, signaling a potential shift from a bearish trend to a bullish reversal.
After the breakout, price managed to rally up to minor resistance around $0.90, but is now pulling back and retesting the key support zone (highlighted yellow box) — a previous strong resistance area now potentially flipping into support.
---
🟢 Bullish Scenario:
If the price holds above the $0.80 - $0.83 support zone, the break-and-retest structure will be validated.
A successful bounce from this area could push ADA back toward:
$0.90 (current minor resistance)
$1.13 (psychological and horizontal resistance)
$1.23 (previous supply zone)
$1.32 (recent local high)
A confirmed bullish continuation will be more convincing if the price forms a higher low and breaks above $0.90 with strong volume.
---
🔴 Bearish Scenario:
If ADA fails to hold the $0.8281 support and falls back below the descending trendline, then:
It may re-enter the previous range and test lower support around $0.75 or even $0.65.
This would suggest a potential false breakout and return to bearish territory.
Watch for bearish candlestick confirmations below $0.80 as an early warning.
---
📌 Pattern Insights:
Descending Trendline Breakout: Suggests a possible long-term trend reversal.
Break & Retest Structure: Price is currently testing the previous resistance zone as new support.
Layered Resistance Zones: Several clear resistance levels above provide logical targets for a bullish rally.
---
📊 Conclusion:
ADAUSDT has printed an early signal of a bullish reversal by breaking out of a long-standing downtrend. However, the sustainability of this trend depends heavily on the ability of price to hold the $0.80 - $0.83 support zone. Look for bullish confirmation candles in this area for a safer long entry.
#ADAUSDT #Cardano #CryptoBreakout #TechnicalAnalysis #Altcoins #BreakoutSetup #BullishRetest #CryptoChart #SupportAndResistance #PriceAction #TrendReversal

ADA About to Explode or Collapse?Yello Paradisers — is ADA gearing up for a breakout, or are we walking straight into a bull trap? After the recent pullback, the market is throwing mixed signals, but this setup is becoming too important to ignore. Here’s what we’re seeing right now on ADAUSDT.
💎ADA is currently showing positive signs of strength after a solid retracement. Current support zone is not only a historical price pivot, but it's also aligned with a supportive trendline, the 200 EMA, and a developing bullish divergence on the chart. All these factors combined are increasing the probability of a short-term bounce — but that doesn't mean we go in blind.
💎For aggressive traders, entering at the current price might make sense, especially if you’re targeting the first resistance level. However, it’s important to note that this entry offers a relatively limited reward compared to the risk — roughly a 1:1 risk-reward ratio — so it’s crucial to size your position accordingly and keep tight control over your stop loss.
💎If you're looking for a cleaner setup with a better risk-to-reward profile, patience is key. A more favorable scenario would be waiting for a proper pullback and a confirmed retest of the support zone. Ideally, you want to see a strong bullish candle at the support level to signal continuation — that’s when the setup shifts from average to high-probability.
💎But be cautious. If the price breaks down and closes a candle below our support zone, the entire bullish idea becomes invalid. In that case, it’s much wiser to step back and allow the market to develop more structure before re-engaging. Forcing trades in uncertain conditions is where most traders lose, and we don’t want to be part of that crowd.
🎖Strive for consistency, not quick profits. Treat the market as a businessman, not as a gambler. Be patient, Paradisers — only those who follow structured strategies and risk management will thrive in the long run.
MyCryptoParadise
iFeel the success🌴
ADAUSDT: $1.50 Year End Target, Is It Possible? The price has remained steadily bullish, but we haven’t seen a strong bullish impulse in the daily timeframe yet. This suggests that we’ll likely reach the $1.50 price range. Please wait for the price to break out and then enter a trade when it shows confirmation. You can use smaller timeframes while taking any entry. Good luck and trade safely!
Like and comment for more!
Team Setupsfx_
ADA/USD Thief Trading Plan – Bullish Snatch & Run!🚨 ADA/USD HEIST ALERT! 🚨 – Bullish Loot Grab Before the Escape! (Thief Trading Strategy)
🌟 Greetings, Market Pirates & Profit Raiders! 🌟
🔥 THIEF TRADING STRIKES AGAIN! 🔥
💎 The Setup:
Based on our stealthy technical & fundamental heist tactics, ADA/USD is primed for a bullish loot grab! The plan? Long entry with an escape near key resistance. High-risk? Yes. Overbought? Maybe. But the heist must go on!
🎯 Key Levels:
📈 Entry (Vault Cracked!) → Swipe bullish positions on pullbacks (15m-30m precision).
🛑 Stop Loss (Escape Route) → Recent swing low (4H basis) at 0.5290 (adjust per risk!).
🏴☠️ Target (Profit Snatch!) → 0.6500 (or bail early if bears ambush!).
⚡ Scalpers’ Quick Heist:
Only scalp LONG!
Big wallets? Charge in! Small stacks? Ride the swing!
🔐 Lock profits with Trailing SL!
📢 Breaking News (Heist Intel!):
Fundamentals, COT, On-Chain, Sentiment— All hint at bullish momentum!.
🚨 ALERT! News volatility ahead—Avoid new trades during releases! Secure running positions with Trailing SL!
💥 BOOST THIS HEIST! 💥
👉 Hit LIKE & FOLLOW to fuel our next market robbery! 🚀💰
🎯 Profit taken? Treat yourself—you earned it!
🔜 Next heist incoming… Stay tuned, pirates! 🏴☠️💎

ADA/USDT Ready to Explode? Watch This Symmetrical Triangle
🧠 Detailed Technical Analysis:
Cardano (ADA) is currently consolidating within a well-defined Symmetrical Triangle pattern on the 3-day chart. This pattern is formed by a series of lower highs and higher lows, indicating compression and indecision in the market — a classic setup for a strong breakout in either direction.
Price has recently bounced off the lower boundary of the triangle and is now heading toward the resistance trendline. A breakout from this structure could trigger a powerful bullish move if confirmed with volume.
🔼 Bullish Scenario (Upside Breakout):
A confirmed breakout above the descending trendline (~$0.65) with strong volume would indicate buyers regaining control.
Key upside targets based on historical resistance zones and the triangle's height:
🟡 $0.8144 – First major horizontal resistance
🟡 $0.9386 – Mid-range resistance from March 2025
🟡 $1.0920 – Former distribution zone
🟡 $1.2118 – Medium-term bullish target
🔵 $1.3264 – Key structural high from previous cycle
🔔 A breakout from a symmetrical triangle often leads to significant price action due to the long period of coiled pressure release.
🔽 Bearish Scenario (Breakdown):
If ADA fails to break above $0.62–$0.65 and gets rejected from the upper boundary of the triangle, the price could:
Revisit the lower trendline support around $0.55
A breakdown below this zone could lead to:
🔻 $0.48
🔻 $0.39
🔻 $0.2756 – A major psychological and historical support level
⚠️ This scenario would invalidate the bullish structure and potentially resume the mid-term downtrend.
📐 Pattern Breakdown – Symmetrical Triangle:
Pattern Duration: ~6 months of consolidation (Feb – July 2025)
Support Zone: $0.55 – $0.60
Resistance Zone: $0.65 – $0.75
Breakout Confirmation: Requires strong bullish candle close with increased volume
Volume Profile: Decreasing, typical of symmetrical triangle before explosive move
💡 Final Thoughts:
Cardano is at a make-or-break point. It has bounced from support and is attempting a breakout from this symmetrical triangle. If successful, this could mark the beginning of a major trend reversal with over +100% upside potential from current levels.
On the flip side, failure to break resistance could lead to a deeper retracement. That’s why confirmation is critical before entering a position!
#ADAUSDT #CardanoAnalysis #CryptoBreakout #SymmetricalTriangle #AltcoinSeason #BullishBreakout #BearishScenario #TechnicalAnalysis #CryptoChart #CryptoTrading #Altcoins

ADA About to Explode or Fakeout Trap?Yello Paradisers — is ADA quietly setting up for a powerful reversal, or are we about to walk straight into a painful bull trap? This zone could decide everything, and here’s why you need to pay close attention.
💎Cardano (ADAUSDT) is currently sitting right on the supportive trendline of a descending channel, while also forming a classic double bottom pattern. What makes this even more significant is the presence of bullish divergence on RSI. This combination alone already hints at a potential bullish reversal, but there’s more to it.
💎The current zone also served as a previous resistance area, and it has now flipped into support—this “resistance-turned-support” structure adds confluence and increases the probability of an upward move. When multiple bullish signals align at a major structural level like this, it usually sets the stage for a strong bounce.
💎Aggressive traders who entered early from current levels are already seeing a potential 1:1 risk-to-reward ratio. However, for safer and more strategic positioning, conservative traders can wait for a pullback to this support zone. Waiting for a bullish confirmation candle after the pullback can offer a better entry with a healthier RR and higher probability of success.
💎That said, if the price breaks below the current support and closes a candle below our invalidation level, the entire bullish idea will be invalidated. In that scenario, the smart move is to remain patient and wait for a new setup to form. Chasing trades after invalidation is how most retail traders get trapped—don’t be one of them.
🎖Strive for consistency, not quick profits. Treat the market as a businessman, not as a gambler. This is the only way you’ll make it far in your crypto trading journey. Be a PRO.
MyCryptoParadise
iFeel the success🌴

ADAUSDT Is Warming Up for a Major MoveYello, Paradisers! Did you notice what just happened on ADAUSDT? After sweeping liquidity, the pair has now printed a bullish internal change of character (I-CHoCH), confirmed by bullish divergence. This confluence significantly increases the probability of a bullish move from here—but only if you play it smart.
💎From the current price levels, the risk-to-reward ratio isn’t the most attractive for conservative entries. Aggressive traders might still consider taking a position with a tighter invalidation, but the trade needs to be managed with precision.
💎For those who prefer safer setups, it’s much wiser to wait for a pullback into the key support zone. A confirmed retest from there could offer a much cleaner risk-to-reward structure and a clearly defined invalidation level.
💎However, if the price breaks down and closes below that invalidation level, this entire bullish setup becomes invalid. In that case, it's best to stay patient and wait for a new structure to form before jumping back in. Entering too early in uncertain territory can turn a high-probability setup into a costly mistake.
🎖Strive for consistency, not quick profits. Treat the market as a professional, not a gambler. Discipline and timing are what separate the winners from the crowd. Be patient, wait for the high-quality trades, and execute with confidence. That’s how long-term success is built in this game.
MyCryptoParadise
iFeel the success🌴
