SIACOIN CRYPTO STRATEGYSiacoin is a cryptocurrency that is based on sharing hard drive space. In essence, Siacoin provides new opportunities for everyone to deposit files much like Dropbox can store files (video, images, and documents) on the SIA network.
The advantages of Siacoin are that it uses a decentralized user-contributed sharing economy where you can essentially cut the cost of storing files online.
So, to purchase storage capacity, you can just use Siacoin tokens, and you can share your unused hard drive space.
Cryptocurrency Siacoin is currently the 34th most valuable cryptocurrency with more than $750 million in market capital. Current market Siacoin price is a steal at $0.021 per coin value.
Tradingview Indicator DMI includes ADX
The ADX indicator doesn’t tell us whether the market is going up or down, it only measures the strength of the trend. To determine whether the trend is up or down we’re going to use the Plus Directional Index (+DI) and the Minus Directional Index (-DI).
Step #1: The ADX indicator needs to be higher than 30.
The first rule needs the strength trend indicator to show a reading greater than 30.
This is the first signal that we’re about to enter into a trending period and, it is a useful information because we don’t want to enter into a market that’s not in a trend condition.
The ADX indicator will be raising in a strong bullish trend and the higher it moves the stronger the trend becomes.
Step #2: The DI indicator needs to show the +DI line above the –DI line.
The directional movement indicator gives us the direction of the Siacoin trend.
The blue line is the positive DI, while the yellow line is the negative DI. When the +DI line is above the –DI line that’s a sign of a bullish trend. When the +DI line holds above the –DI and if they are also really spread apart, it signals the presence of a strong bullish trend.
So, the reading of the DI indicator also matters, because the higher the +DI line is, the stronger the trend will be. Basically, the strength of the trend is checked twice, first with the ADX indicator and then secondly, with the DMI indicator.
Step #3: How to Buy Siacoin: Buy at the opening of the next candle once the two trading conditions are met.
A buy stop is placed at the opening of the next candle after the first two conditions are satisfied.
Most often when the ADX indicator shows a reading above the 30 level, the directional index will already show a positive trend, so we need to get ready to buy Siacoin straightaway.
Step #4: Place protective Stop Loss below the most recent swing low
The protective stop loss should be placed below the most recent swing low point. If you’re having problems identifying swing market low points simply check when the ADX indicator bottomed. Usually, the ADX indicator offers a much clearer view of the market swing points.
Step #5: Take Profit when the +DI line crosses below the –DI line
When the DMI indicator crosses in the opposite direction, we know the trend is turning bearish and we want to take profits on our Siacoin trade.
The DMI indicator is a great tool to be used for profitable trading because it provides you with fantastic exit points.
I offered 3 different exit points. 1st 1.5 to 1 risk ratio, 2nd 10 candle new low, 3rd +D1 cross below -D1
ADX


ADX vs BTCADX had a pretty big breakout and then fell to about .1 Fib on the retracement.
I am going to say buy now.
TP1: 13800
TP2: 18300
TP3: 27000
Stop/ Loss: 8600
current price: 11400
Acquire 10600- 11800

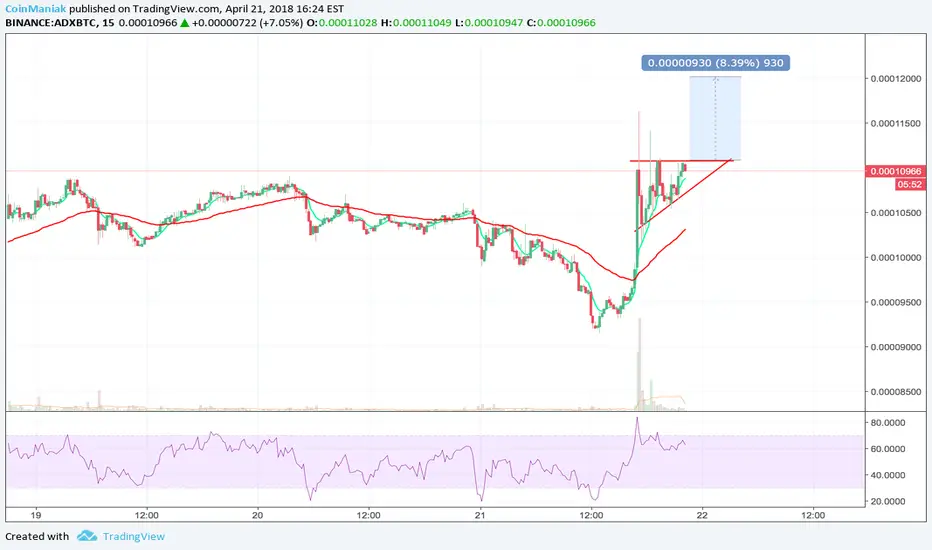
Trading Idea for #AdEx | $ADX | $ADXBTC> AdEx forming an 'Ascending Triangle'.
> StochRSI oscillator looks primed (on multiple timeframes) for a move to the upside.

#ADX ADeX 14k support on dailyADeX #ADX showing strong support at 14k satoshi on the daily chart.
Good buying opportunity if it can hold 14k support. Market is risky, but these are the type of things we need to look for. A lot of coins have lost their support lines and went back into old resistance/support.

Now is the best time to ride AdEx $ADX ADX has just started on wave 3 which shows that it's heading to long term target of $2.5

GGI Pullback- Buy now!GGI experienced a pullback in an up-trending market (Usually 3-4 days of pullback before its next move up).
Try to buy in around 2.90. I am expecting GGI to reach a level of 3.40-3.55.
Stop loss at 2.7 or approximately its trend line.

ADXBTC Bittrex 4H up to 26APR18 Trading Analysis (TA)ADXBTC Bittrex 4H up to 26APR18
4H Chart, also works in 1H, at this time the ADEX (ADX) has been floating on SUPPORT ZONE 2 for a couple of days after RESISTANCE ZONE 1 became into SUPPORT; the 50,100,200 MA indicator already crossed and has been moving into an ascending pattern (Green Arrows), the RSI (Blue Arrow) is moving into an ascending pattern and the MACD is about to cross up (Black Checkmark), if this keeps this way will meet again RESISTANCE ZONE 2 to then move forward, but keep always in mind that also may go down. At this time the Market Cap in hovering the 399 Billions. Good Luck!
4H Chart, también funciona en 1H, en este momento el ADEX (ADX) ha estado flotando en SUPPORT ZONE 2 durante un par de días después de que RESISTANCE ZONE 1 se convirtió en SUPPORT; el indicador MA 50,100,200 ya cruzo y se ha movido hacia un patrón ascendente (Flechas verdes), el RSI (Flecha azul) se está moviendo en un patrón ascendente y el MACD está a punto de cruzar hacia arriba (Checkmark), si esto se mantiene de esta manera se encontrará nuevamente con la ZONA DE RESISTENCIA 2 para luego avanzar, pero tenga en cuenta que también puede bajar. En este momento, el Market Cap está rondando los 399 mil millones. ¡Buena suerte!
"Bitcoin will do to Banks what Email did to Postal Industry / El Bitcoin le hara a los Bancos lo mismo que el Correo Electronico hizo a la Industria Postal"
REMEMBER: I am not a financial adviser nor is any content in this article presented as financial advice. The information provided in this blog post and any other posts that I make and any accompanying material is for informational purposes only. It should not be considered financial or investment advice of any kind. One should consult with a financial or investment professional to determine what may be best for your individual needs. RECUERDE: No soy un asesor financiero y el contenido de este artículo no se presenta como asesoramiento financiero. La información provista en esta publicación de blog y cualquier otra publicación que haga y cualquier material que la acompañe es solo para fines informativos. No debe considerarse asesoramiento financiero o de inversión de ningún tipo. Se debe consultar con un profesional financiero o de inversiones para determinar qué es lo mejor para sus necesidades individuales.


ADXBTC Bittrex 4H up to 23APR18 Trading Analysis (TA)ADXBTC Bittrex 4H up to 23APR18
4H Chart, also works in 1H, at this time the ADEX (ADX) has been floating on SUPPORT ZONE 2 for a couple of days after RESISTANCE ZONE 1 became into SUPPORT; the 50,100,200 MA indicator already crossed and has been moving into an ascending pattern (Green Arrows), the RSI (Blue Arrow) is slightly moving into an horizontal pattern and the MACD even though is crossing down (Orange Alert) we need to keep our eyes open, if this keeps this way will meet again RESISTANCE ZONE 2 to then move forward, but keep always in mind that also may go down. At this time the Market Cap in hovering over the 401 Billions. Good Luck!
4H Chart, también funciona en 1H, en este momento el ADEX (ADX) ha estado flotando en SUPPORT ZONE 2 durante un par de días después de que RESISTANCE ZONE 1 se convirtió en SUPPORT; el indicador MA 50,100,200 ya cruzo y se ha movido hacia un patrón ascendente (Flechas verdes), el RSI (Flecha azul) se está moviendo ligeramente en un patrón horizontal y el MACD aunque está cruzando hacia abajo (Alerta naranja) necesitamos mantener nuestros ojos abiertos, si esto se mantiene de esta manera se encontrará nuevamente con la ZONA DE RESISTENCIA 2 para luego avanzar, pero tenga en cuenta que también puede bajar. En este momento, el Market Cap está rondando los 401 mil millones. ¡Buena suerte!
"Bitcoin will do to Banks what Email did to Postal Industry / El Bitcoin le hara a los Bancos lo mismo que el Correo Electronico hizo a la Industria Postal"
REMEMBER: I am not a financial adviser nor is any content in this article presented as financial advice. The information provided in this blog post and any other posts that I make and any accompanying material is for informational purposes only. It should not be considered financial or investment advice of any kind. One should consult with a financial or investment professional to determine what may be best for your individual needs. RECUERDE: No soy un asesor financiero y el contenido de este artículo no se presenta como asesoramiento financiero. La información provista en esta publicación de blog y cualquier otra publicación que haga y cualquier material que la acompañe es solo para fines informativos. No debe considerarse asesoramiento financiero o de inversión de ningún tipo. Se debe consultar con un profesional financiero o de inversiones para determinar qué es lo mejor para sus necesidades individuales.


ADXBTC. Can he get almost 100% profit?I started to see the ADX chart on March 28th. Today I publish the chart, because it seems to go in the direction I indicated weeks ago.

ADX-BTC Bullish short and long term targets!Coin : ADX-BTC
Exchanges: Bittrex , Binance
Best erea to buy under 0.00009000 but you can buy some now .
Short Sell Targets :
1- 0.00010900
2- 0.00011800
3- 0.00012500
4- 0.00013700
5- 0.00014500
Stop loss : Closing Two candles under 0.00008000 on 4H chart
- LONG TERM TARGETS on the chart may be hit + 0.00023000sat.

AdEx | ADX - Bullish ascending triangleBullish Ascending triangle buy on breakout - target = 12000 sats


ADX -- Up to 30% Profit --Buy: 9200-9400 <===
===> Sell Target 1: 9765 (Profit 5%)
===> Sell Target 2: 10250 (Profit 10%)
===> Sell Target 3: 11350 (Profit 22%)
===> Sell Target 4: 12150 (Profit 30%)
X Stop Loss: 8200 X

Adex VS Bitcoin +630% PotentialAdex is currently trading within the descending channel, although on the last wave up it failed to test the upper trendline of the channel and went down. The decline was stopped at the 10k satoshis, that is a strong psychological support as well as 76.4% Fibonacci retracement level.
While the support is holding it is very likely that ADX/BTC could establish an uptrend, towards 74k satoshis resistance confirmed by two Fibonacci retracement levels. That is 630% growth potential over the Bitcoin.
On a downside, daily break and close below 10k satoshis could extend the consolidation and send price back to 5.5k satoshis support, nevertheless, that price should be far more attractive for buyers.

