500% APY with Low Risk — Fake? Fact!This is not clickbait! This is a real working strategy! Read to the end!
Hello!
My name is Michael Hypov!
I have been trading for 16 years, and during this time I have seen it all: booms, crashes, crises, hype, and long periods of market silence.
My articles on technical and fundamental analysis, as well as my forecasts for Forex currencies and cryptocurrencies, are translated into 20 languages and gather millions of views.
But what I want to share with you today became a turning point in my understanding of trading.
How it all began
In 2019, I moved to Malaysia and entered the Universiti Sains Malaysia (USM) — the second most prestigious university in the country after UM.
I was lucky to get into the Master's program in Data Science and Analytics. It was an intensive course where we deeply studied mathematical analysis, statistics, neural networks, and machine learning — at a time when no one had even heard of ChatGPT yet.
This knowledge literally turned my understanding of trading upside down.
I suddenly saw that many market processes could be explained by strict mathematical laws, and therefore — predicted with high accuracy.
A bit of theory in simple terms
One of the key discoveries for me was the law of normal distribution.
Visually, it is represented by the “Gaussian bell” — a symmetrical curve where most values are in the middle, and extreme values are rare.
To make it clearer, let me give you an example.
Imagine baking muffins
The dough is the same for all, and the oven is the same. But the result is always slightly different:
most muffins turn out average in size
some are slightly smaller or slightly larger
very few are either tiny or gigantic.
If you draw a chart of “how many muffins of what size,” you’ll get that same bell-shaped curve: many in the center, few on the edges.
Examples from real life
We see the same principle everywhere:
uman height — most people are of average height, very short and very tall are rare
school grades — most students have average grades, and extremes are rare
apple weight in an orchard — most are about the same, but there are a few very small or very large ones.
💡 To put it simply: in nature and life, most values are “average,” and extremes are rare.
Why this matters in trading
In trading, the price at any given moment is a random variable.
We cannot know exactly where it will be in a second or an hour, but we can calculate the average value that is most likely to be reached.
If we return to the bell curve, the blue dotted line in the centre is the price the market tends to most often.
For each time frame, you can calculate this average price and use it as a guide.
Box Plot — a chart that says more
The law of normal distribution can be conveniently represented using a Box Plot (“box and whiskers”).
The median = the expected value,
The “box” — the range of 25% deviations,
The “whiskers” — minimum and maximum within 1.5×IQR (where IQR is the size of the box body).
If you plot the asset price along the X-axis and rotate the graph by 90°, the shape will strikingly resemble a Japanese candlestick.
And if you build such “boxes” for different time frames, you get a clear picture of market fluctuations, which in some cases is more informative than a candlestick chart.
Intrabar BoxPlot and two patterns
Recently, TradingView introduced the Intrabar BoxPlot indicator. It builds these “boxes” right on the chart and marks the medians and closing prices.
On the chart, these boxes are displayed with colored dots for the medians of each period and blue dots for the closing price levels.
Comparing the price chart with the BoxPlot, you can identify two patterns:
1/ The market always tends toward the median; therefore, with high probability, if the close for the period was within the box, the candle of the next period will reach the median of the last closed candle.
2/ If the close occurred outside the box, this is a signal for a trend continuation. Moreover, the further the closing point is from the median, the stronger the signal for continued movement.
These patterns work both on 12-month candles and on second-level time frames, which makes it possible to conduct cross-analysis from macro to micro trends and build a trading strategy that delivers excellent results: on large time frames, we identify major trends, and on minute and second charts, we determine entry and exit points on micro-waves within the day.
How it turned into a strategy
Three years ago, I decided to turn this observation into a full-fledged trading system.
At first, I wrote a thesis based on this idea, forecasting Bitcoin’s price.
For three years, I tested and refined the algorithm, brought in a team of programmers who helped me build a custom trading bot from scratch.
Since trading requires a limited set of parameters — closing/opening prices, high/low, as well as box parameters and expected value — the bot’s neural model is well trainable and capable of not only conducting cross-analysis but also identifying patterns and inefficiencies in the market on its own. Moreover, the bot self-learns and improves its trading over time.
Results
We trade on Binance futures, with an average leverage of 0.63x — less than one, which almost eliminates the risk of liquidation.
We don’t use stop-losses: if a trade goes against us, the bot moves to a higher time frame and averages the position.
Maximum leverage — 3x.
Backtest results show returns from 100% to 500% per year, depending on the market cycle. On a bear market, we reduce leverage to lower risks, which also reduces returns.
The strategy has now been trading on a real account for more than a month.
The first month of trading brought +31% to the deposit.
Even giving 50% to the fund, when calculating compound interest (with reinvestment of income), your annual income will approach 500%
Thank you very much for reading to the end!
I will be glad to receive your comments under the posts and questions in private messages
Ai-trading

How to Trade Gold with AI-Powered Algos in 2025📊 How to Trade Gold with AI-Powered Algos in 2025
A practical action plan for serious gold traders
🔍 1. Know Why Gold Requires Custom Algo Tactics
Gold is volatile, news-sensitive, and driven by macro events like Fed policy, geopolitics, and inflation. Generic stock or crypto bots fail here — gold needs precise, event-aware automation.
🧠 2. Use AI-Powered Bots Trained for Gold Volatility
Deploy bots that adapt to real-time data like CPI releases, bond yields, and geopolitical headlines. Use machine learning models that detect gold breakouts, consolidations, and safe-haven flows.
Top AI algos for gold traders: Multiple systems based on MT4/MT5
Fully-automated, AI-based gold bot with breakout detection, precision entries, and built-in risk control.
⚙️ 3. Build or Choose the Right Algo Strategy for Gold
Trend-Following: Use 21/50 EMA crosses on H1 and H4
Mean Reversion: Bollinger Band fades in range-bound sessions
Breakout Algos: Trigger trades on CPI or FOMC event volatility
Volume-Based AI: Analyze volume spikes vs. historical patterns
🧪 4. Backtest Gold-Specific Models
Always test your bot using historical gold data, especially during NFP weeks, Fed meetings, and geopolitical escalations. Use data from 2018 to 2024 for high-volatility periods.
Tools: TradingView for Pine Script testing, MetaTrader 5 for EA deployment
🛡️ 5. Control Risk with Gold-Specific Parameters
Max drawdown: Keep under 15 percent
Stop-loss: Always use hard stops (not just trailing)
Position sizing: 0.5 to 1 percent of capital per trade
Use volatility filters: Avoid entries during thin liquidity hours
🔄 6. Automate Monitoring and Adaptation
Run multiple bots for breakout, momentum, and reversal setups
Use dashboards to track gold-specific metrics like VIX, USDX, DXY, and 10Y Treasury yields Integrate AI that adjusts parameters after major data releases
🚀 7. Prepare for 2025 Market Structure
Gold is increasingly driven by
Central bank digital currency rollouts
USD de-dollarization risks
Global stagflation or recession themes
DeFi and tokenized gold products
Your algo must factor in these macro narratives using real-time data feeds
📌 Gold Algo Trading Success Plan 2025
Use AI bots built for gold volatility
Trade high-probability breakouts post-news
Backtest with gold-specific macro filters
Maintain strict risk limits with max 15 percent drawdown
Monitor global news and macro data with bot triggers
Continuously optimize and adapt
Gold is not just a commodity — it’s a signal of global risk. Automate smartly, manage risk tightly, and use AI to stay one move ahead.

Trading opportunity for FETUSDTBased on technical factors there is a Sell position in :
📊 FETUSDT
🔴 Sell Now
🪫Stop loss 0.540
🔋Target 0.350
📏 R/R 2,3
💸RISK : 1%
We hope it is profitable for you ❤️
Please support our activity with your likes👍 and comments📝

Called the DIP BUY Perfectly, Now we march back to $49+C3.AI - NYSE:AI 🤖
We had a large 16% move higher after earnings yesterday to now 8% down. Lets talk about why and some levels I'm looking at.
First, the H5 and Williams Consolidation Box strategies are still intact and no reason to fret. I'm not making the same mistake after we saw this same volatility after NASDAQ:SOUN earnings.
Second, I believe the move is based on analysts combining to keep this stocks price targets to sub $30 while it's currently high $30's low $40's last few weeks. I believe this could be a fake out and pullback entry point for Wall Street to enter just as they did on Sound Hound AI. Could be destroying short term options as well as we see on most earnings calls.
Finally, I believe we are going to continue higher after some volatility today and this week. They honestly had great earnings with a double beat and raise on guidance. While speaking more on their great new NASDAQ:MSFT partnership.
As you can see on the chart the yellow dotted line is the current pre-market price at $38ish which puts it right at previous support and resistance levels dating back to 2022 and keeps it on the volume shelf. With the H5 and WCB being intact while we are at a key support area I'm going to be a buyer here.
The white box on the chart below is the buy box according to the factors outlined above.
Buy Box: $36-$39
🎯🔜$47
🎯$49
🎯$58
Not financial advice.

FET longFET broke through the descending trendline. Bullish trend is expected to continue and reach the resistance level at $0.8

BNB.X in +5.27% UptrendBNB.X in +5.27% Uptrend, rising for three consecutive days on February 09, 2024
Moving higher for three straight days is viewed as a bullish sign. Keep an eye on this stock for future growth. Considering data from situations where BNB.X advanced for three days, in 245 of 445 cases, the price rose further within the following month. The odds of a continued upward trend are 55%.
Technical Analysis (Indicators)
Bullish Trend Analysis
The Momentum Indicator moved above the 0 level on February 07, 2024. You may want to consider a long position or call options on BNB.X as a result. In 65 of 130 past instances where the momentum indicator moved above 0, the stock continued to climb. The odds of a continued upward trend are 50%.
The Moving Average Convergence Divergence (MACD) for BNB.X just turned positive on February 08, 2024. Looking at past instances where BNB.X's MACD turned positive, the stock continued to rise in 27 of 60 cases over the following month. The odds of a continued upward trend are 45%.
Bearish Trend Analysis
The RSI Indicator demonstrated that the stock has entered the overbought zone. This may point to a price pull-back soon.
The Stochastic Oscillator demonstrated that the ticker has stayed in the overbought zone for 3 days. The longer the ticker stays in the overbought zone, the sooner a price pull-back is expected.
Following a 3-day decline, the stock is projected to fall further. Considering past instances where BNB.X declined for three days, the price rose further in 50 of 62 cases within the following month. The odds of a continued downward trend are 42%.
BNB.X broke above its upper Bollinger Band on February 08, 2024. This could be a sign that the stock is set to drop as the stock moves back below the upper band and toward the middle band. You may want to consider selling the stock or exploring put options.
The Aroon Indicator for BNB.X entered a downward trend on January 30, 2024. This could indicate a strong downward move is ahead for the stock. Traders may want to consider selling the stock or buying put options.

Ford Motor (F, $11.72) (MACD) positive turned , January 31, 2024Ford Motor (F, $11.72) Moving Average Convergence Divergence (MACD) Histogram turned positive on January 31, 2024
This is a Bullish indicator signaling F's price could rise from here. Traders may explore going long the stock or buying call options. A.I. dvisor identified 44 similar cases where F's MACD histogram became positive, and 32 of them led to successful outcomes. Odds of Success: 73%.
F in upward trend: 10-day moving average moved above 50-day moving average on January 31, 2024
The 10-day moving average for F crossed bullishly above the 50-day moving average on January 31, 2024. This indicates that the trend has shifted higher and could be considered a buy signal. In 10 of 13 past instances when the 10-day crossed above the 50-day, the stock continued to move higher over the following month. The odds of a continued upward trend are 77%.
Technical Analysis (Indicators)
Bullish Trend Analysis
The RSI Oscillator points to a transition from a downward trend to an upward trend -- in cases where F's RSI Indicator exited the oversold zone, 20 of 30 resulted in an increase in price. Tickeron's analysis proposes that the odds of a continued upward trend are 67%.
The Momentum Indicator moved above the 0 level on January 29, 2024. You may want to consider a long position or call options on F as a result. In 55 of 82 past instances where the momentum indicator moved above 0, the stock continued to climb. The odds of a continued upward trend are 67%.
The Moving Average Convergence Divergence (MACD) for F just turned positive on January 31, 2024. Looking at past instances where F's MACD turned positive, the stock continued to rise in 31 of 44 cases over the following month. The odds of a continued upward trend are 70%.
F moved above its 50-day moving average on January 25, 2024 date and that indicates a change from a downward trend to an upward trend.
Following a +3.42% 3-day Advance, the price is estimated to grow further. Considering data from situations where F advanced for three days, in 205 of 297 cases, the price rose further within the following month. The odds of a continued upward trend are 69%.
Bearish Trend Analysis
The Stochastic Oscillator demonstrated that the ticker has stayed in the overbought zone for 3 days. The longer the ticker stays in the overbought zone, the sooner a price pull-back is expected.
Following a 3-day decline, the stock is projected to fall further. Considering past instances where F declined for three days, the price rose further in 50 of 62 cases within the following month. The odds of a continued downward trend are 68%.
F broke above its upper Bollinger Band on February 01, 2024. This could be a sign that the stock is set to drop as the stock moves back below the upper band and toward the middle band. You may want to consider selling the stock or exploring put options.
The Aroon Indicator for F entered a downward trend on January 30, 2024. This could indicate a strong downward move is ahead for the stock. Traders may want to consider selling the stock or buying put options.

DOGECOIN FOUNDER SHARES 2024 AI RESOLUTIONSDOGECOIN FOUNDER SHARES 2024 AI RESOLUTIONS
Dogecoin co-founder Billy Markus shares 2024 New Year resolutions centered around AI integration.
Elon Musk’s Grok AI challenges ChatGPT with humor and tackling sensitive topics.
AI tools like ChatGPT and Grok AI are reshaping learning, creativity, and content creation in 2024.
In an unexpected turn of events, Billy Markus, the co-founder of Dogecoin, took to Twitter to share his New Year resolutions for 2024. While his tweet might have surprised many, it sheds light on a growing trend – the integration of artificial intelligence (AI) into various aspects of our lives.
Markus’s AI-centric resolutions:
Billy Markus, one of the minds behind the creation of the iconic cryptocurrency Dogecoin, recently shared his 2024 New Year resolutions on Twitter. With a following of 2.1 million users on the platform, his tweet caught the attention of many. What’s remarkable about his resolutions is that each one is centered around harnessing the power of artificial intelligence (AI).
Among his aspirations, Markus aims to “learn to draw (via ai), learn to code (via ai), write a novel (via ai), write a musical (via ai),” and more. These resolutions underscore a significant shift towards AI integration in various professional and creative endeavors. It appears that Markus is not just sharing his personal goals but is also predicting a trend that is likely to dominate 2024 across various fields.

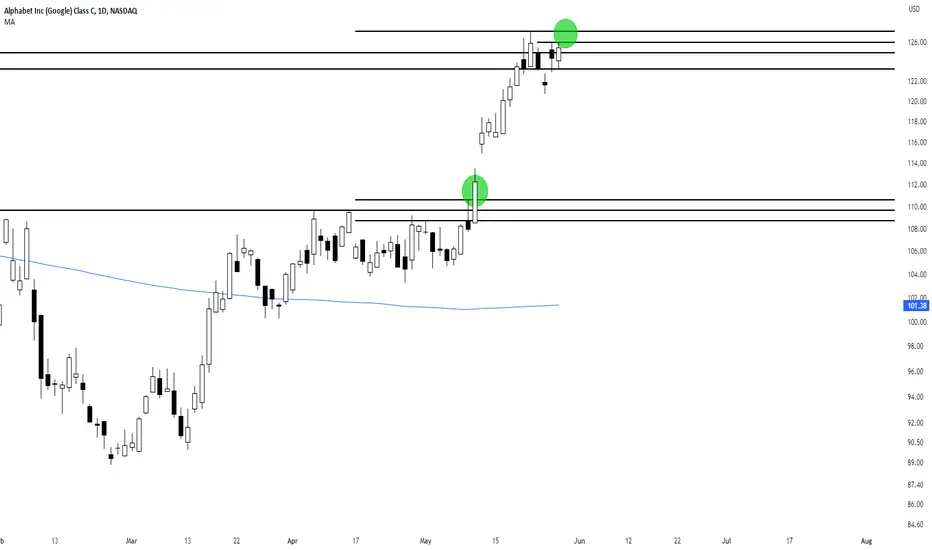
New Google Pivot New long pivot on NASDAQ:GOOG forming around $127. Watch todays price action for confirmation.
Previous move through the pivot saw Google advance from $110 to $127.