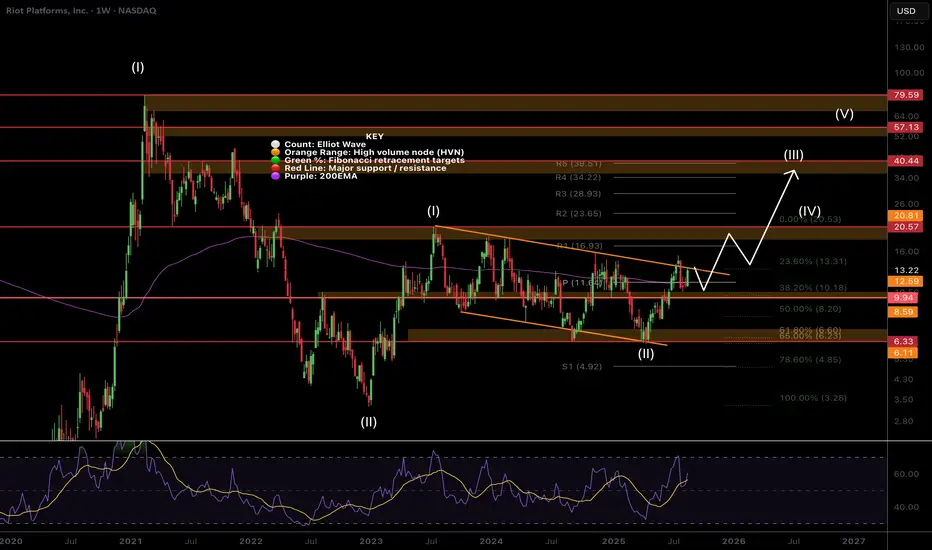
$RIOT Making Moves!NASDAQ:RIOT found support at the areas mentioned last week, the weekly pivot and 200EMA.
Wave (ii) ended at the golden pocket and High Volume node support.
Retesting the descending channel resistance upper boundary again will be the 5th test and a very high probability breakout. This would bring up the first target resistance of the wave (I) swing high and High Volume Node $20.5 followed by $40.
Weekly RSI did hit overbought but this can take months to pay play out and there is no divergence!
Analysis is invalidated below $6.33.
Safe trading
AI
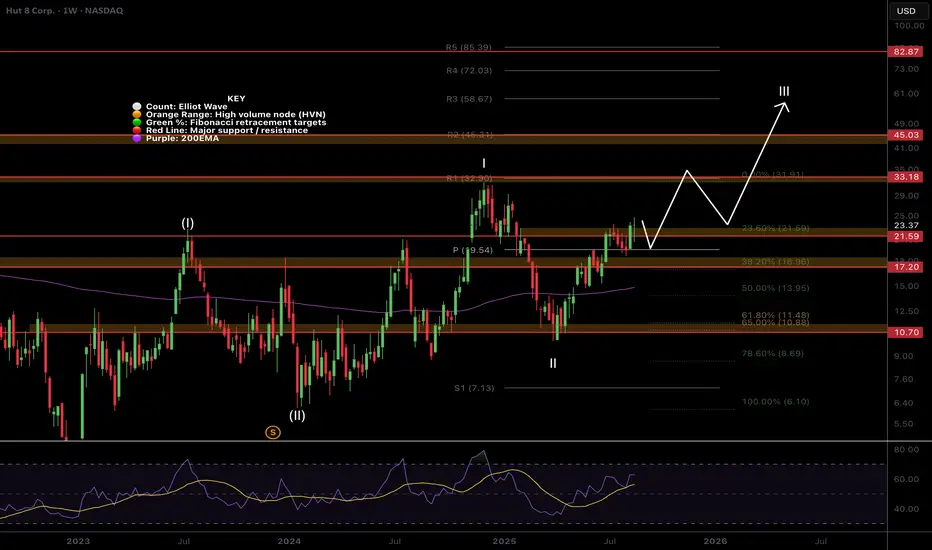
$HUT Clear for take off?NASDAQ:HUT bounced strongly off the weekly pivot retest above the major resistance High Volume Node flipped support.
Path is clear for the weekly R1 pivot target resistance at $33 and a poke above the previous swing high.
Long term cyclical targets remain at the R3 weekly pivot at $61. Weekly RSI is in an uptrend but not yet overbought while weekly RSI is pointing upwards.
Analysis is invalidated below $10.7
Safe trading
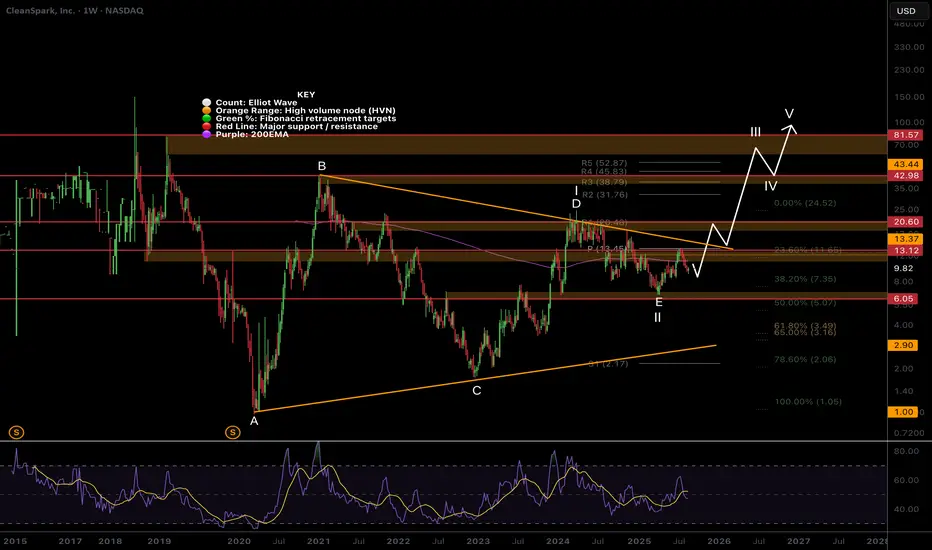
$CLSK Looks like XRP at $0.4 before the move to $3NASDAQ:CLSK is hated right now as much as XRP was when it ranged between $0.4-$0.8 for 4 years before it when ballistic.
CRYPTOCAP:XRP printed a huge macro triangle similar to what I have identified here for CLSK which looks complete at the triangle EQ, where wave E is expected to terminate! This finds confluence with the High Volume Node and 0.5 Fibonacci retracement.
Quadruple resistance lies ahead of the weekly 200EMA, major High Volume Node, weekly pivot point and descending resistance boundary, tested multiple times weakening the point. This built up pressure could provide an explosive move to price discovery.
I have left my alternative motif wave count on their as a secondary count (1-2) with similar targets.
RSI is at the channel EQ so plenty of upside left.
Analysis is invalidated below $6.05.
Safe trading
$BTDR Pressure Building?NASDAQ:BTDR still appears to be in a wave 2 triangle building pressure for a significant wave 3 up into price discovery.
Wave (II) found support a the golden pocket, shallower than the other miners! Price has tested the upper boundary of the triangle and High Volume Node multiple times at $15 and only once at the bottom threshold hinting at a breakout upwards. Each test makes the boundary weaker.
The weekly pivot point at $17 is the first area of resistance to watch followed by the all time high at $25
Analysis is invalidated below $6.44. RSI is only at the EQ so has room to grow.
Safe trading

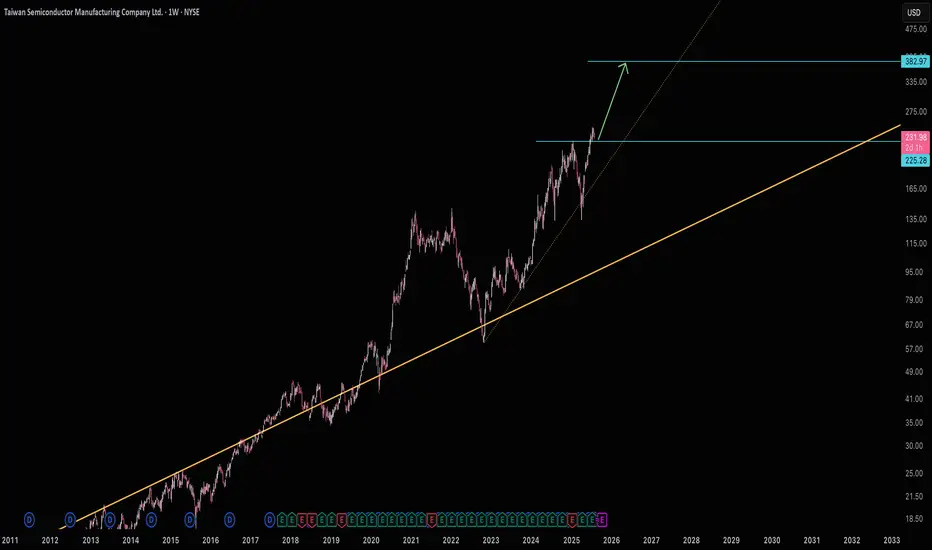
TSM on the way to $380TSM is currently building it's support at $225 and gearing up for $380.
Good luck!
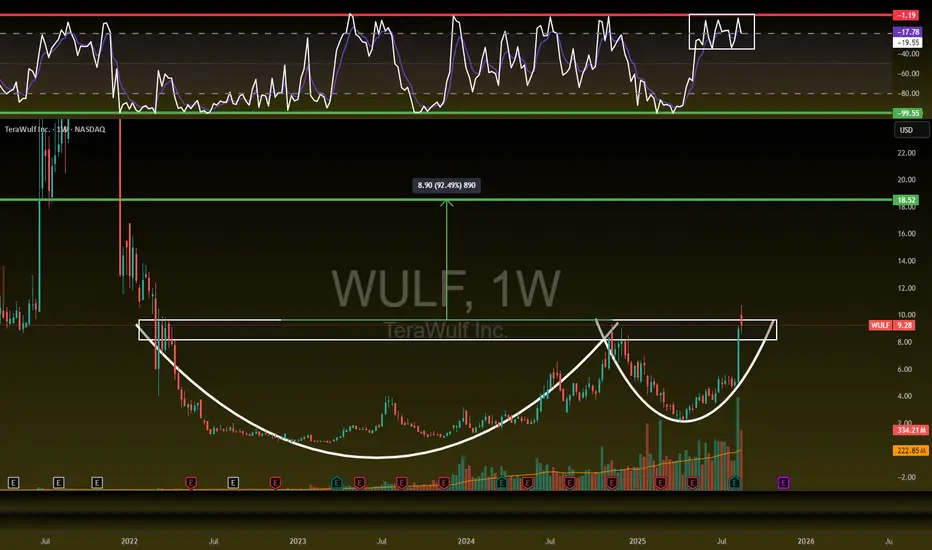
WULF PACK IS READY - 92% UpsideNASDAQ:WULF
CupnHandle Breakout with Retest
Measured move is $18.55
WCB is formed and thriving
New deals landing and Volume is Large.
ALAB $304 After Consolidation Around $180 Resistance/SupportALAB had a big rise today into $180 resistance. This should be an area where a small pullback occurs or a further rise and then pullback into what will be $180 support. (Personally I'm leaning towards pullback above $180 rather than below)
Keep an eye on the major trendline as if ALAB gets too far away it will eventually want back to that trendline.
$304 is the next target. All Information Technology / Computer stocks are in the middle of the a big uptrend so this one has room to run.

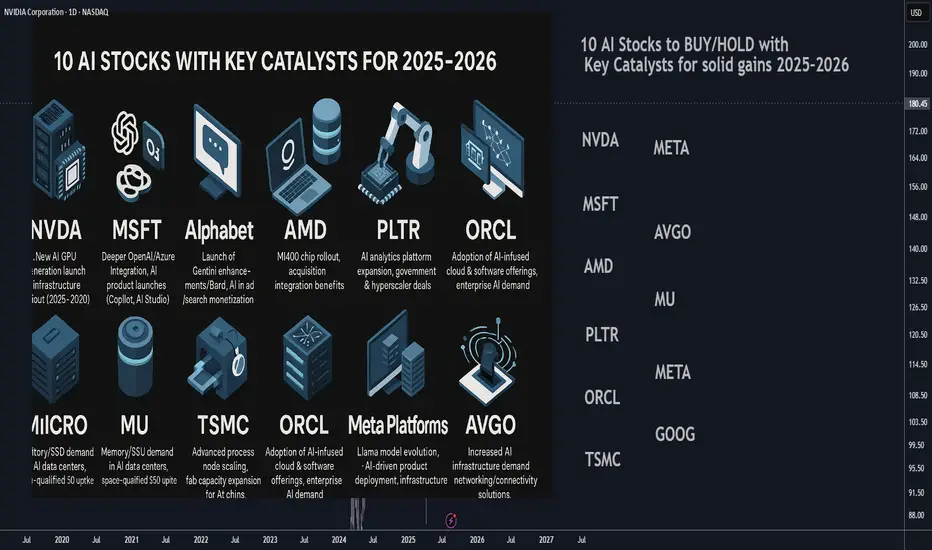
10 AI Stocks to BUY/HOLD with Key Catalysts for solid gains 202510 AI Stocks to BUY/HOLD with Key Catalysts for solid gains 2025–2026
________________________________________
1. NVIDIA (NASDAQ: NVDA)
• Catalyst: Expansion of AI infrastructure via new GPU generations (e.g., Blackwell), continued dominance in AI training/deployment. Regulatory/availability clarity in key markets like China could also drive demand.
• Highlights: Leader in AI GPUs; high analyst upgrades and raised targets; strong global demand from data centers and hyperscale AI deployments.
________________________________________
2. Microsoft (NASDAQ: MSFT)
• Catalyst: Deepening integration of AI across products and services (e.g., Office, Teams), OpenAI partnership further embedded in Azure services, AI product launches (Copilot, AI Studio).
• Highlights: Extensive cloud & enterprise reach; strong balance sheet; strategic positioning as AI infrastructure and application leader.
________________________________________
3. Alphabet (NASDAQ: GOOGL)
• Catalyst: Rollout of key AI products (e.g., Gemini, Bard enhancements), continued monetization of AI in search & advertising, rising AI-related cloud license revenue.
• Highlights: Core AI research leader; growing earnings momentum; sustained institutional inflows and investor confidence tied to AI growth.
________________________________________
4. AMD (NASDAQ: AMD)
• Catalyst: Launch of AI-optimized server chips (e.g., MI400 series), integration of AI functionality in CPUs/GPUs, synergy from Xilinx and Silo AI acquisitions.
• Highlights: Aggressive roadmap in AI compute; acquisitions bringing AI IP and talent; gaining share in AI server ecosystem.
________________________________________
5. Palantir (NYSE: PLTR)
• Catalyst: Expansion of AI-driven government and commercial contracts, rollout of AI-enabled analytics platforms such as Palantir AI suite, new hyperscaler partnerships.
• Highlights: AI-analytics leader with strong public-sector footprint; pivoting toward cloud-based AI; high-margin recurring revenue potential.
________________________________________
6. Micron Technology (NASDAQ: MU)
• Catalyst: Accelerated demand for AI-optimized memory and storage (e.g., HBM, SSDs); uptake of Micron's AI/space-qualified SSDs; expansions into AI data center deployments.
• Highlights: Strong sequential performance in earnings; double-digit growth in AI segments; positioned as non-GPU hardware beneficiary of AI boom.
________________________________________
7. TSMC (NYSE: TSM)
• Catalyst: Scaling advanced process nodes (e.g., N3E, N2) to support AI chips, capacity expansion initiatives, securing AI chip orders from Nvidia, AMD, and other fabless players.
• Highlights: Global leader in semiconductor foundry; high-barrier-to-entry business model; direct beneficiary of AI silicon ramp-up.
________________________________________
8. Oracle (NYSE: ORCL)
• Catalyst: Launch and adoption of Oracle Cloud AI capabilities (OCI AI, embedded ML), AI-driven Oracle Fusion applications, increasing AI-related capex by enterprise customers.
• Highlights: Strong enterprise penetration; AI-infused software suite; renewed investor interest from hedge funds targeting AI exposure.
________________________________________
9. Meta Platforms (NASDAQ: META)
• Catalyst: Continued investment in large-scale AI infrastructure (data centers), Llama 3 and generative AI models, new AI products in social, AR/VR, and enterprise.
• Highlights: Massive AI compute investments; pioneering open models like Llama; turning AI into a core product strategy beyond social media.
________________________________________
10. Broadcom (NASDAQ: AVGO)
• Catalyst: AI-related semiconductor solutions (e.g., networking, connectivity, acceleration) embedded in data center infrastructure, demand from AI workload networking.
• Highlights: Integral player in AI infrastructure as part of the “Fab 4”; diversified exposure across chips critical for AI workloads.
________________________________________
How to Monitor These Catalysts
• Product Launches & Roadmap Updates (e.g., NVDA GPU release events, AMD MI400 launch, META model updates)
• Earnings Calls / Financial Guidance revealing AI revenue — especially with MSFT, GOOGL, ORCL, MU, and AVGO
• Partnership or Contract Announcements — e.g., Palantir industry deals, Oracle enterprise AI deployments
• Capacity & Scaling News — e.g., TSMC fab expansion, Micron memory contracts, Meta data center buildouts
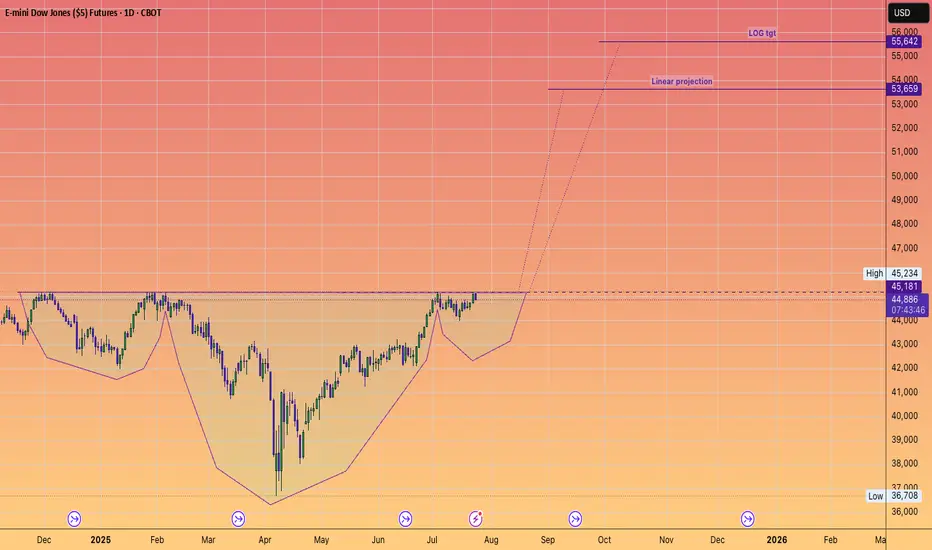
DOW JONES to 55,642#InverseHead&Shoulders
Projects record new highs.
Another stepping stone to our long held forecast of 64,000
Why?
Because AI will significantly contribute to an EXPANDING #GDP
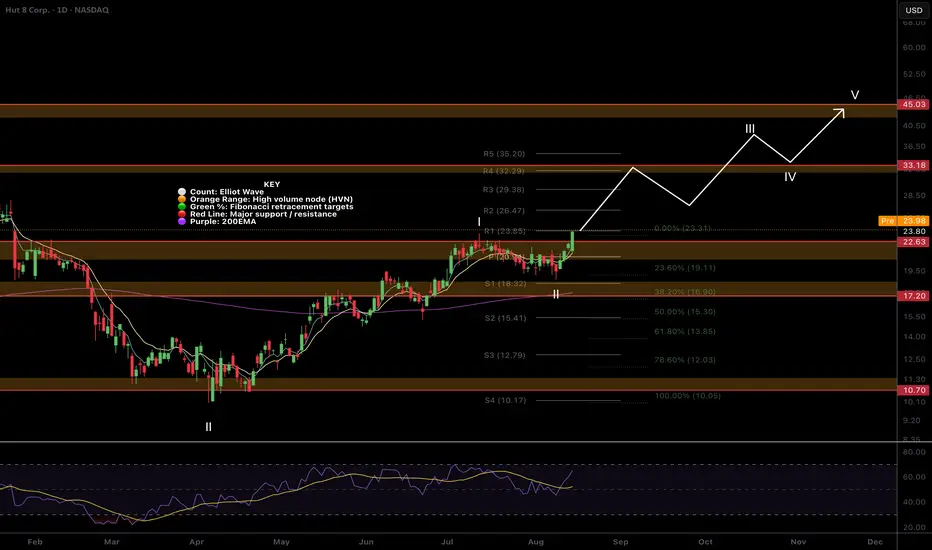
$HUT is Blasting Off Again!NASDAQ:HUT pull backs continue to be shallow making an accurate Elliot wave count difficult but this is a characteristic of a strong wave 3.
The next target is $33 major High Volume Node resistance at the R4 daily pivot.
RSI is printing daily bearish divergence but this will be offset soon if price continues upwards.
Safe trading
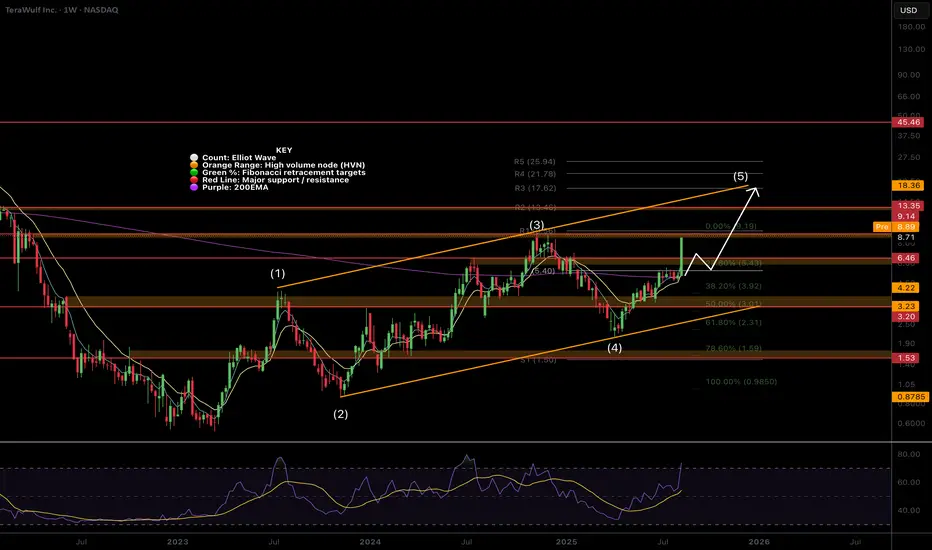
$WULF Continues the path with a 59% candle in one day!NASDAQ:WULF is still locked into the Elliot Wave leading diagonal channel having printed wave 1-4 and now in wave (3) of 5. Leading and ending diagonals do not obey the rules that 'wave 4 can not dip into wave 1'.
Price blasted through the weekly 200EMA and pivot point validating my count. Target remains the R3 weekly pivot at the top of the channel line around $17-18.
Weekly RSI has entered the overbought territory but this is a lagging indicator and price can stay in the upper bullish range for months!
I will be leaving this trade open and letting it run.
Updated signal service 15/08/25:
✅ Bitcoin hit take profit #2 for 2.59RR
✅AAVE (DEMA) hit take profit #1 for 1.45RR
✅New signal added for ONDO (DEMA percentage Band Rule)
✅Updated parameters on NEAR and STRK
✅No stops or invalidations this week
Safe trading
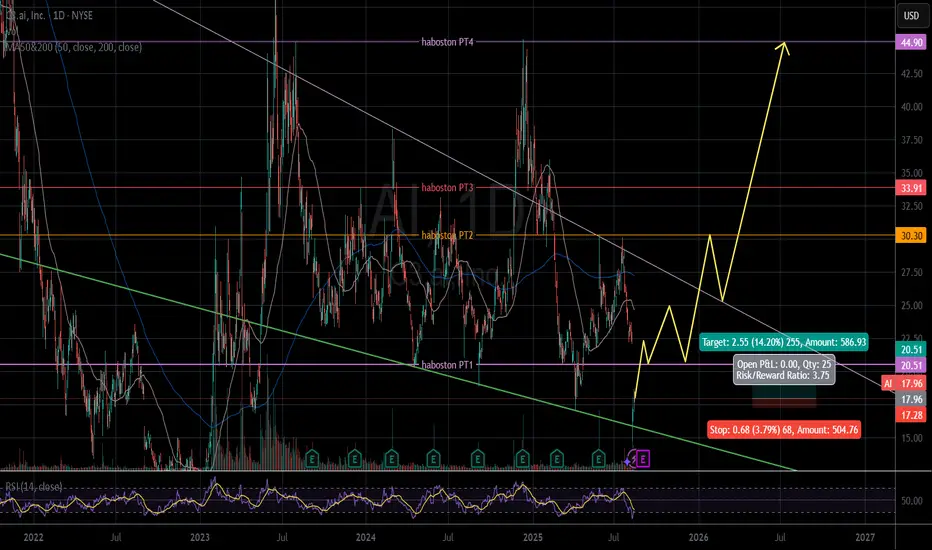
Ai - Falling wedgeThe chart pattern look likes Falling wedge.
After oversold, Ai starts rebounding with multiple targets until 06.2026 in 18 month cycle.
The price closed on Thursday is $17.96 (08.14.2025).
Entry $17.96.
PT1 is $20.51 (14.20%).
Stop loss $17.28 (-3.79%).
R/R: 3.75.
Other target $30.30/ $33.91/ $44.90.
IMO.
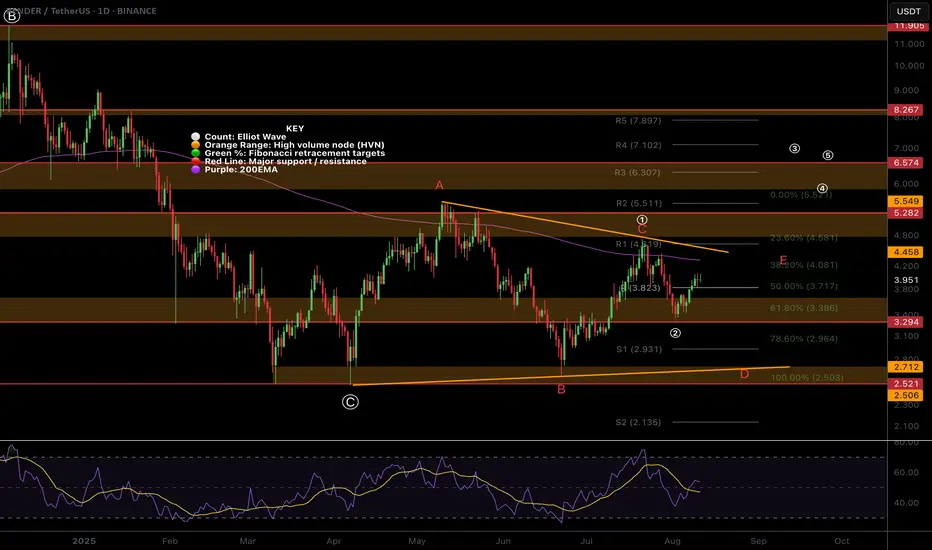
$RENDER bearish triangle or motif wave?I have 2 local Elliot Wave counts for CRYPTOCAP:RENDER the bearish triangle yet to complete wave D which would result in a final thrust down before a new macro uptrend and a (1) (2) with wave (3) started.
The overlapping and slow price action does not suggest RENDER is in a wave as it is not moving impulsively.
Many alts have failed to move from the bottom while others have shined like ETH and XRP etc..
Either this is the new normal behaviour for 'alt season' or we are not actually in alt-season yet with a big move lower around the corner!
Safe trading
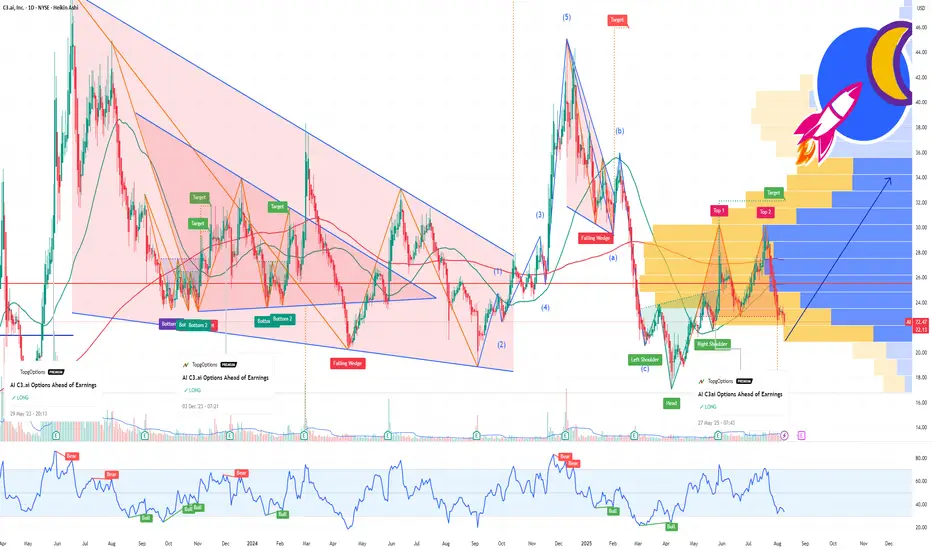
AI Insider Trading Before the Buyout? $5.8Million block of callsOn Friday, after the close, C3. ai announced CEO Thomas Siebel is stepping down, with a new leadership team taking over. The stock dropped almost 14% on the news, slashing its market cap and potentially making it irresistible for a takeover bid. They are looking for a new CEO!
Why this matters:
1. Perfect M&A Timing: C3. ai has proven AI tech, including contracts with the U.S. Department of Defense. The right acquirer could turn this into the next Palantir-style success story. Leadership changes often make buyouts easier.
2. Valuation Reset: The 14% drop gives strategic buyers a cheaper entry point, exactly when they might be circling.
3. Massive Call Buying Before News: Just last week, someone dropped $5.8M on Sept 19 $25 strike calls. That’s a high-conviction, short-dated bet. Nobody throws around that kind of money without expecting a big move, possibly insider knowledge of a deal or major contract.
4. Strategic Fit: Defense contractors or big tech companies could instantly expand their AI footprint by acquiring C3.ai.
Palantir built its empire by combining cutting-edge data analytics with deep government and defense relationships. C3. ai is following a similar blueprint and may be earlier in the curve:
1. Strong Defense Footprint: C3. ai already holds contracts with the U.S. Department of Defense and other government agencies, positioning it in the same secure, high-margin niche that powered Palantir’s growth.
2. Mission-Critical AI Solutions: Just like Palantir’s Gotham and Foundry platforms became embedded in government workflows, C3. ai’s AI suite is designed for enterprise and defense applications that are hard to replace once integrated.
3. Massive TAM (Total Addressable Market): The AI defense and enterprise analytics market is projected to grow exponentially over the next decade, mirroring the macro tailwinds Palantir rode after 2020.
4. Sticky Contracts: Government and defense clients tend to lock in long-term, high-value contracts once a system is deployed, creating predictable recurring revenue streams.
5. Potential for Commercial Expansion: Palantir went from mostly government to a healthy commercial mix. C3. ai could follow the same path, leveraging its defense credibility to win private-sector deals.
6. Strategic Acquisition Target: Big tech and defense primes would love to own a proven AI platform with federal clearance — just as Palantir’s unique positioning has made it a darling of Wall Street and a fortress against competition.
In short: C3. ai today could be where Palantir was a few years ago!
If acquired or scaled correctly, the upside could be just as explosive!
500% APY with Low Risk — Fake? Fact!This is not clickbait! This is a real working strategy! Read to the end!
Hello!
My name is Michael Hypov!
I have been trading for 16 years, and during this time I have seen it all: booms, crashes, crises, hype, and long periods of market silence.
My articles on technical and fundamental analysis, as well as my forecasts for Forex currencies and cryptocurrencies, are translated into 20 languages and gather millions of views.
But what I want to share with you today became a turning point in my understanding of trading.
How it all began
In 2019, I moved to Malaysia and entered the Universiti Sains Malaysia (USM) — the second most prestigious university in the country after UM.
I was lucky to get into the Master's program in Data Science and Analytics. It was an intensive course where we deeply studied mathematical analysis, statistics, neural networks, and machine learning — at a time when no one had even heard of ChatGPT yet.
This knowledge literally turned my understanding of trading upside down.
I suddenly saw that many market processes could be explained by strict mathematical laws, and therefore — predicted with high accuracy.
A bit of theory in simple terms
One of the key discoveries for me was the law of normal distribution.
Visually, it is represented by the “Gaussian bell” — a symmetrical curve where most values are in the middle, and extreme values are rare.
To make it clearer, let me give you an example.
Imagine baking muffins
The dough is the same for all, and the oven is the same. But the result is always slightly different:
most muffins turn out average in size
some are slightly smaller or slightly larger
very few are either tiny or gigantic.
If you draw a chart of “how many muffins of what size,” you’ll get that same bell-shaped curve: many in the center, few on the edges.
Examples from real life
We see the same principle everywhere:
uman height — most people are of average height, very short and very tall are rare
school grades — most students have average grades, and extremes are rare
apple weight in an orchard — most are about the same, but there are a few very small or very large ones.
💡 To put it simply: in nature and life, most values are “average,” and extremes are rare.
Why this matters in trading
In trading, the price at any given moment is a random variable.
We cannot know exactly where it will be in a second or an hour, but we can calculate the average value that is most likely to be reached.
If we return to the bell curve, the blue dotted line in the centre is the price the market tends to most often.
For each time frame, you can calculate this average price and use it as a guide.
Box Plot — a chart that says more
The law of normal distribution can be conveniently represented using a Box Plot (“box and whiskers”).
The median = the expected value,
The “box” — the range of 25% deviations,
The “whiskers” — minimum and maximum within 1.5×IQR (where IQR is the size of the box body).
If you plot the asset price along the X-axis and rotate the graph by 90°, the shape will strikingly resemble a Japanese candlestick.
And if you build such “boxes” for different time frames, you get a clear picture of market fluctuations, which in some cases is more informative than a candlestick chart.
Intrabar BoxPlot and two patterns
Recently, TradingView introduced the Intrabar BoxPlot indicator. It builds these “boxes” right on the chart and marks the medians and closing prices.
On the chart, these boxes are displayed with colored dots for the medians of each period and blue dots for the closing price levels.
Comparing the price chart with the BoxPlot, you can identify two patterns:
1/ The market always tends toward the median; therefore, with high probability, if the close for the period was within the box, the candle of the next period will reach the median of the last closed candle.
2/ If the close occurred outside the box, this is a signal for a trend continuation. Moreover, the further the closing point is from the median, the stronger the signal for continued movement.
These patterns work both on 12-month candles and on second-level time frames, which makes it possible to conduct cross-analysis from macro to micro trends and build a trading strategy that delivers excellent results: on large time frames, we identify major trends, and on minute and second charts, we determine entry and exit points on micro-waves within the day.
How it turned into a strategy
Three years ago, I decided to turn this observation into a full-fledged trading system.
At first, I wrote a thesis based on this idea, forecasting Bitcoin’s price.
For three years, I tested and refined the algorithm, brought in a team of programmers who helped me build a custom trading bot from scratch.
Since trading requires a limited set of parameters — closing/opening prices, high/low, as well as box parameters and expected value — the bot’s neural model is well trainable and capable of not only conducting cross-analysis but also identifying patterns and inefficiencies in the market on its own. Moreover, the bot self-learns and improves its trading over time.
Results
We trade on Binance futures, with an average leverage of 0.63x — less than one, which almost eliminates the risk of liquidation.
We don’t use stop-losses: if a trade goes against us, the bot moves to a higher time frame and averages the position.
Maximum leverage — 3x.
Backtest results show returns from 100% to 500% per year, depending on the market cycle. On a bear market, we reduce leverage to lower risks, which also reduces returns.
The strategy has now been trading on a real account for more than a month.
The first month of trading brought +31% to the deposit.
Even giving 50% to the fund, when calculating compound interest (with reinvestment of income), your annual income will approach 500%
Thank you very much for reading to the end!
I will be glad to receive your comments under the posts and questions in private messages

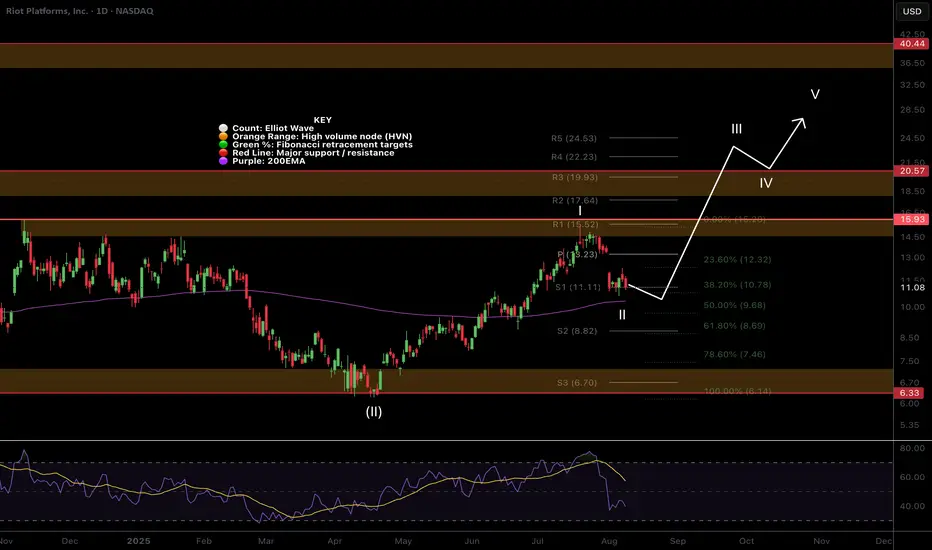
$RIOT retracement near completion?Riot appears to have completed a wave 1 and almost finished its wave 2 retracement with 1 more push lower expected.
Price is just above the daily 200EMA, golden pocket Fibonacci retracement with daily RSI approaching oversold! This are should offer strong support.
Price sitting just below the weekly pivot and 200EMA which offers additional support in this area.
Bitcoin stocks have all had a decent retracement causing me to upgrade my Elliot Wave count to a completed macro wave 1 with wave 2 now underway, suggesting the best returns are still to come over the next months for this category asset class in wave 3!
Analysis is invalidated if we go to new highs above $15.3 or lose $6.18
New long signals are certainly building in the DEMA PBR and Price Action strategies so keep an eye out on the Trade Signals Substack as we have made very good profits lately in these markets!
Safe trading
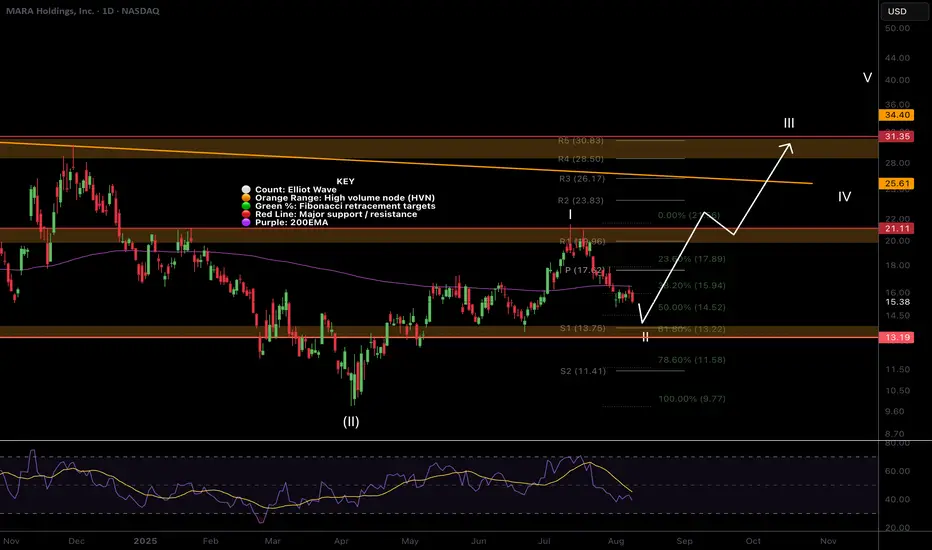
$MARA Setting Up for A Huge Move?This stocks price action has been subdued far too long after they sold shares to investors but should be moving more aggressively alongside Bitcoin, being the second largest holder of BTC in its treasury.
Price appears to have completed an awkward wave 1 potentially a leading diagonal with wave 2 now underway while price is under the daily and weekly 200EMA. Wave 2 target is a little bit lower in the Fibonacci retracement golden pocket and major High Volume Node support $13.19.
Daily RSI has made its way lower currently showing bullish divergence. If the count is right wave 3 should be hard and fast!
Bitcoin stocks have all had a decent retracement causing me to upgrade my Elliot Wave count to a completed macro wave 1 with wave 2 now underway, suggesting the best returns are still to come over the next months for this category asset class in wave 3!
Analysis is invalidated if we go to new highs above $21.5 or lose $9.85
New long signals are certainly building in the DEMA PBR and Price Action strategies so keep an eye out on the Trade Signals Substack as we have made very food profits lately in these markets!
Safe trading
$IREN wave B complete?After its mammoth rally NASDAQ:IREN appears to have completed a wave 1 of 3 with wave 2 underway. The recent push up into the previous all time high resistance appears to be wave b of c in a corrective wave 2.
My initial target for wave 2 is the ascending daily 200EMA and .5 Fibonacci retracement at $10.44. This is also just above the weekly pivot and major High Volume Node support which remains untested.
Weekly RSI has reached oversold, not significantly, but price did have decent retracement the last few times it was reached.
Bitcoin stocks have all had a decent retracement causing me to upgrade my Elliot Wave count to a completed macro wave 1 with wave 2 now underway, suggesting the best returns are still to come over the next months for this category asset class in wave 3!
Analysis is invalidated if we go to new highs above $21.7 or lose $5.08
New long signals are certainly building in the DEMA PBR and Price Action strategies so keep an eye out on the Trade Signals Substack as we have made very food profits lately in these markets!
Safe trading

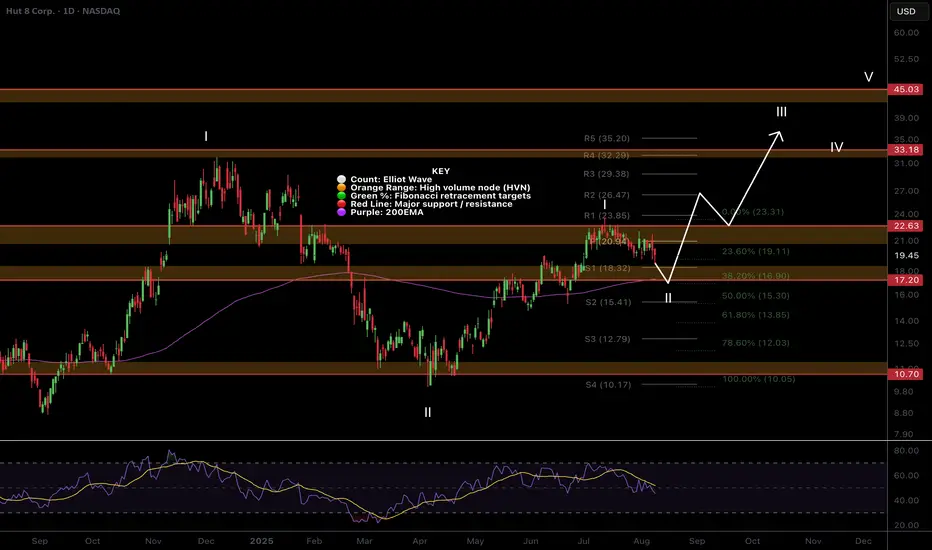
$HUT Pulling back to daily 200EMANASDAQ:HUT appears to have complete a larger degree wave 1 of 3 with wave 2 underway.
Looking at the support below we may have a shallow wave 2 targeting the daily 200EMA, major support High Volume Node at the .382 Fibonacci retracement, $17. A shallow wave 2 often happens in strong trending markets as participants are excited and can't wait to buy!
Daily RSI has plenty of room to fall. $19.5 is also the weekly pivot point where price is also expected to find strong support so we may see a reversal from here at the start of next week but these assets are volatile so i would lean towards lower first.
Bitcoin stocks have all had a decent retracement causing me to upgrade my Elliot Wave count to a completed macro wave 1 with wave 2 now underway, suggesting the best returns are still to come over the next months for this category asset class in wave 3!
Analysis is invalidated if we go to new local highs above $23.46 or lose $9.98.
New long signals are certainly building in the DEMA PBR and Price Action strategies so keep an eye out on the Trade Signals Substack as we have made very food profits lately in these markets!
Safe trading
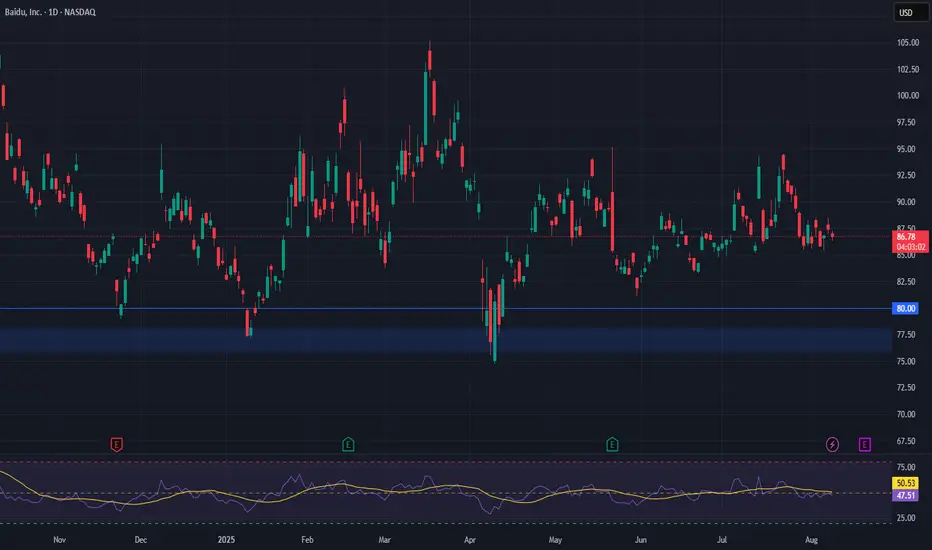
Baidu (BIDU) –AI Upgrades + Open-Source Strategy Powering GrowthCompany Snapshot:
Baidu NASDAQ:BIDU is cementing its position as a top AI platform leader in China, combining core search dominance with cutting-edge AI innovations and strategic open-source moves.
Key Catalysts:
Next-Gen AI Infrastructure ⚙️
Major Qianfan platform upgrades and PaddlePaddle 3.0 launch streamline model training & deployment for China’s AI developer ecosystem.
Reduces barriers to AI adoption, expanding the company’s developer base and ecosystem stickiness.
Open-Source Breakthrough 📂
ERNIE language models released under Apache 2.0 license—mirroring successful U.S. big-tech strategies.
Aims to accelerate adoption, attract global partnerships, and enhance monetization over the long term.
Rising User Engagement 📱
724M MAUs (+7% YoY) on Baidu’s mobile app.
AI-generated content now on 35% of search pages (up from 22% in January), increasing ad monetization potential.
Investment Outlook:
Bullish Entry Zone: Above $76.00–$78.00
Upside Target: $160.00–$165.00, fueled by AI leadership, developer adoption, and rising engagement metrics.
📈 Baidu’s combination of AI innovation, open-source strategy, and a massive user base creates a strong runway for both near-term revenue growth and long-term platform dominance.
#BIDU #AI #PaddlePaddle #ERNIE #OpenSource #ChinaTech #Search #CloudComputing #ArtificialIntelligence #BigData #DigitalTransformation #TechStocks
AGENT $HUSTLE - More than just trading ChatGPTAs I am always on the lookout for good opportunities to invest in small cap cryptos, I came across Agent Hustle some time ago.
Especially nowadays, it is important to me not to buy into something without researching who is behind the project.
In this case, I found out that it is EMBLEM, a company that has been active in the crypto market since 2016 and has revolutionized VAULT and cross-chain technology.
Since AI is an emerging market, I took a closer look at it and followed it closely.
The platform has now evolved from a simple input window similar to “ChatGPT” to a complete AI-supported trading platform including AFK trading.
"Buy xyz when the price falls by 7% and then set a TP at 12% price gain and an SL 3% below the entry price."
One prompt and that's it. The Conditional Engine was created.
These and many more features distinguish Agent Hustle from the competition.
The token used to be called TNSR, but there was another groundbreaking development: the migration of PUMP directly to the SOL blockchain. To this end, the emblem team developed a new platform and the mechanics behind it and carried out a migration. Starting this month, the platform is open to all other teams and projects that want to migrate their tokens to regain full control.
And the best part is that Agent Hustle and Migrate use the same token = $HUSTLE.
Reason enough to take a closer look at the chart. After the successful migration, the mcap rose to 38M within a few days.
The current decline offers a great entry opportunity, especially with the migrations coming this month, including buybacks of $HUSTLE.
Just 2.8x to the ATH
Lower Timeframe H1
In my opinion, the project definitely has the chance to reach and exceed 100M Mcap.
But as always - DYOR!
Good luck!

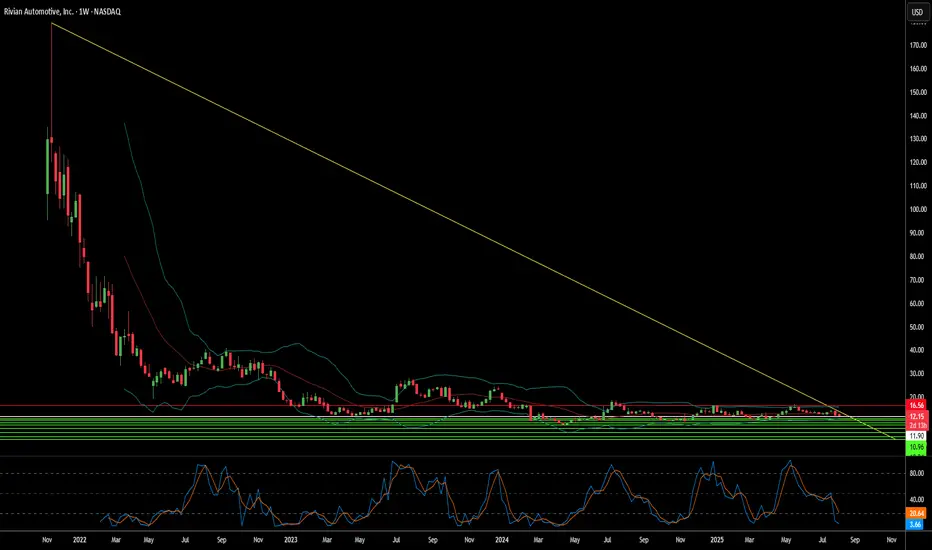
Can Rivian Survive the Perfect Storm of Challenges?Rivian Automotive reported mixed Q2 2025 results that underscore the electric vehicle startup's precarious position. While the company met revenue expectations with $1.3 billion in consolidated revenue, it significantly missed earnings forecasts with a loss per share of $0.97 versus the anticipated $0.66 loss - a 47% deviation. Most concerning, gross profit returned to negative territory at -$206 million after two consecutive positive quarters, highlighting persistent manufacturing inefficiencies and cost management challenges.
The company faces a confluence of external pressures that threaten its path to profitability. Geopolitically, China's dominance over rare earth elements - controlling 60% of production and 90% of processing capacity - creates supply chain vulnerabilities, while new Chinese export licensing rules complicate access to critical EV components. Domestically, the impending expiration of federal EV tax credits on September 30, 2025, combined with the effective end of CAFE fuel economy standards enforcement, eliminates key demand-side and supply-side incentives that have historically supported EV adoption.
Rivian's strategic response centers on three critical initiatives: the R2 model launch, the transformative Volkswagen partnership, and aggressive manufacturing scale-up. The R2 represents Rivian's pivot from niche, high-cost premium vehicles to mainstream, higher-volume products designed to achieve positive gross margins. The $5.8 billion Volkswagen joint venture provides essential capital and manufacturing expertise, while the Illinois plant expansion to 215,000 annual units by 2026 aims to deliver the economies of scale necessary for profitability.
Despite maintaining a strong cash position of $7.5 billion and securing the Volkswagen investment, Rivian's widened EBITDA loss guidance of $2.0-2.25 billion for 2025 and target of EBITDA breakeven by 2027 represent a high-stakes race against time and capital burn. The company's success hinges on flawless execution of the R2 launch, achieving planned production scale, and leveraging its software capabilities and patent portfolio in V2X/V2L technologies to diversify revenue streams beyond traditional vehicle sales in an increasingly challenging regulatory and competitive environment.
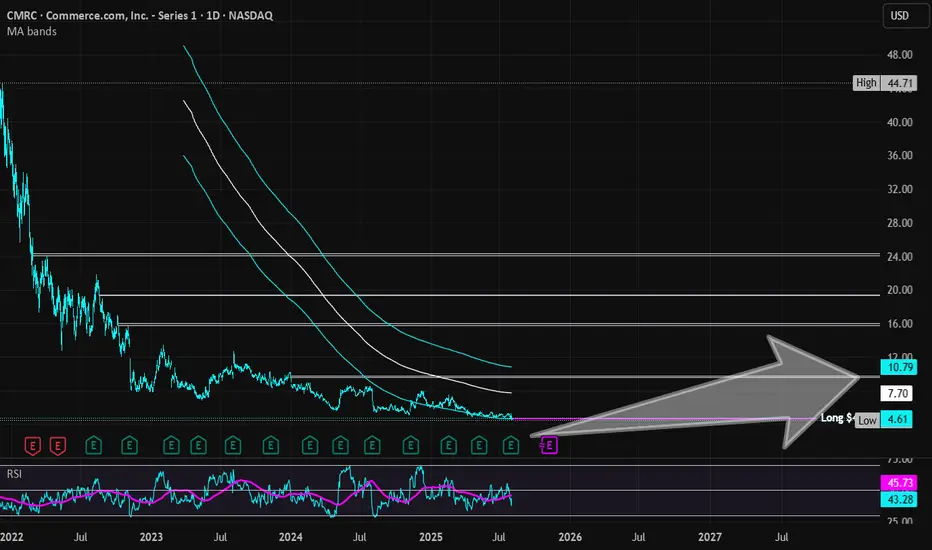
Commerce.com | CMRC | Long at $4.68BigCommerce recently rebranded to Commerce.com NASDAQ:CMRC . Full disclosure: I am an initial stockholder at $7.15, but grabbing more shares below $5 - average current holding is $5.68.
During the most recent earnings call for NASDAQ:CMRC , the company announced AI-driven partnerships with Google Cloud (Gemini) and PROS Holdings to enhance product discovery and pricing. They are now focused on "agentic commerce" (a new paradigm in online shopping where AI-powered agents autonomously handle the entire shopping process, from product discovery to purchase, on behalf of users) and B2B growth (Quick Start Accelerator program). The shift of this company focusing away from standard shopping experiences to new AI-powered ones is a major catalyst for me believing this company can grow significantly. Companies like NASDAQ:URBN , NYSE:TPR , NYSE:DELL , NYSE:VFC use NASDAQ:CMRC and others will surely hop on board if the AI shopping enhances consumer experiences.
However, the economy is VERY shaky right now and consumers are spending less. There is a chance the growth outlook for NASDAQ:CMRC (4.6% annual revenue growth through 2028) may not occur. Thus, this is a **highly speculative** investment. I would not be surprised if the economy flips and this tanks to near or below $1 in the near-term. With that in-mind, this is a long-term position build for me until targets are hit. If I have to hold for years, I am okay with that as long as the major fundamentals do not change. Those without thick skin should stay away...
From a technical analysis perspective, the price has entered and is riding my historical simple moving average area. This usually signifies the accumulation phase of a stock cycle and is what I will be doing - which is why I am adding shares at $4.68.
Targets into 2028:
$7.00 (+49.6%)
$9.50 (+103.0%)