TradeCityPro | FETUSDT Analysis AI Coins Ready to Take Off?🚀 FETUSDT Analysis — Are AI Coins Ready to Take Off? 🤖
Let’s move on to the analysis of FET (Fetch.ai) — one of the leading projects in the AI and data category, which could soon attract significant capital inflow. It’s worth keeping an eye on this one, as momentum might be building up in the AI sector.
🌐 Overview of Bitcoin
Before starting the analysis, let me remind you once again that we’ve moved the Bitcoin analysis section to a dedicated daily report at your request — allowing us to discuss Bitcoin’s trend, dominance, and overall market sentiment in greater detail each day:
📊 Technical Structure (4H Timeframe)
After losing the key 0.5213 support, FET experienced a sharp drop toward the daily support at 0.2037, where it finally found strong buying pressure.
From that level, the coin made an impressive rebound up to 0.3830, followed by a rejection and a pullback to 0.2936, where buyers once again stepped in to defend the zone.
💎 Bullish Scenario (Long Setup):
If price breaks above 0.3830, it would confirm renewed bullish momentum — signaling a potential long entry opportunity, with the main target at 0.5213. This move would indicate that AI-related coins are gaining strength again.
🔻 Bearish Scenario (Short Setup):
While there are better short setups available on coins like SUI and APE, if FET fails to print a higher high and instead breaks below 0.2936, a short-term correctional short trade could still be considered — though with lower conviction compared to other charts.
📈 Summary:
FET is currently showing signs of accumulation after a deep correction, and the AI narrative could fuel the next breakout. Keep an eye on 0.3830 as your early trigger zone — a breakout there might just mark the start of the next leg up for AI tokens.
📝 Final Thoughts
Stay calm, trade wisely, and let's capture the market's best opportunities!
This analysis reflects our opinions and is not financial advice.
AI

TSLA Catalysts Ranking: Q1 2026 Outlook PT 600 USD________________________________________
TSLA: Updated Outlook (Nov-2025)
Here's an updated/revised outlook for TSLA including all the primary
catalyst ranking and analyst ratings and overview of latest developments
this was updated for Q1 2026 with all the viable market data.
________________________________________
🤖 1) Autonomous & Robotaxi Execution — 9.2/10 (↑)
• What changed: Tesla’s invite-only Austin robotaxi pilot kept running through the summer; Tesla also says it launched a Bay Area ride-hailing service using Robotaxi tech (Q3 deck). FSD v14 (Supervised) began rolling out in Oct with broader model upgrades; Tesla claims billions of supervised miles and AI training capacity lifted to ~81k H100-equivalents.
• Offsetting risk: NHTSA opened a fresh probe (Oct-2025) into ~2.9M Teslas over traffic-safety violations when using FSD; investigation cites 58 reports incl. crashes/injuries.
• Why the bump: Real pilots in two metros + visible AI scale-up keep autonomy the center of the bull case—even with elevated regulatory risk.
________________________________________
🌍 2) EV Demand & Geographic Mix — 8.6/10 (↘ )
• What changed: Q3-25 delivered record vehicles and record energy storage deployments, with record revenue and near-record free cash flow. Still, we’re past the U.S. tax-credit pull-forward and China/Europe pricing remains competitive.
• Read-through: Momentum into Q4 looks better than 1H-25, but regional price discipline and mix will matter.
________________________________________
💸 3) U.S. EV Tax Credits & Incentives — 6.0/10 (↘)
• What changed: Federal new/used EV credits ended for vehicles acquired after Sept 30, 2025 under OBBB. Buyers can still qualify if a binding contract + payment was made by 9/30 and the car is placed in service later (“time-of-sale” reporting). This creates a limited after-deadline tail into late ’25/early ’26 but the program has sunset for new acquisitions.
• Implication: Pull-forward demand helped Q3; near-term becomes tougher without the credit.
________________________________________
📉 4) Rates & Credit Conditions — 6.5/10 (↔)
• Rate-cut expectations have eased financing costs M/M, but absolute affordability still binds EV uptake. (Macro-sensitive; no single decisive print.)
________________________________________
🎯 5) Affordable Model / Next-Gen Platform — 8.0/10 (↔)
• Q3 deck emphasized Model 3/Y “Standard” variants to expand entry price points; true next-gen remains staged, with execution risk.
________________________________________
🔋 6) Battery Cost & Margin Levers — 8.3/10 (↑)
• What changed: Q3 total GAAP GM improved vs 1H; energy revenue +44% YoY; free cash flow ~$4.0B. Scale/learning and supply-chain localization called out.
________________________________________
⚡ 7) Energy, AI & Optimus Optionality — 8.7/10 (↑)
• Record storage deployments, Megapack 3 / Megablock unveiled; expanding AI inference/training and a U.S. semi-conductor deal noted. This is the clearest re-rating vector beyond autos.
________________________________________
🛡️ 8) Safety, Regulatory & Governance Risk — 7.5/10 (risk) (↑ risk)
• New NHTSA probe into FSD reporting/behavior escalates headline risk; audit scrutiny persists. Interpret higher score here as more material risk to multiple.
________________________________________
🚩 9) Competition & Global Share — 6.2/10 (↔)
• Competitive intensity in China/EU remains high; Q3 execution improved but pricing power still contested.
________________________________________
🌐 10) Macro & Trade/Policy — 6.5/10 (↑)
• Policy shifts (e.g., OBBB tax-credit sunset; tariff/trade uncertainty) remain a swing factor for cost & demand corridors.
________________________________________
✅ 11) Commodities/Inputs — 5.5/10 (↔)
• Mixed moves across lithium/nickel; no single driver eclipses execution/AI narrative near term.
________________________________________
Updated Catalyst Scorecard (ranked by impact)
1. Autonomous & Robotaxi Execution — 9.2
2. Energy, AI & Optimus Optionality — 8.7
3. EV Demand & Geographic Mix — 8.6
4. Battery Cost & Margin Levers — 8.3
5. Affordable Model / Next-Gen — 8.0
6. U.S. EV Incentives — 6.0
7. Rates & Credit — 6.5
8. Macro/Trade — 6.5
9. Competition/Share — 6.2
10. Safety/Reg/Gov Risk — 7.5 (risk flag)
11. Commodities — 5.5
(Key Q3 facts from Tesla’s deck; probe/tax-credit items from NHTSA/IRS reporting.)
________________________________________
📊 Analyst Rankings & Price Targets
• Street consensus (near-term 12-mo): ~$391 average target; consensus rating: Hold across ~46 firms.
• Bull camp: Wedbush (Dan Ives) $600 PT (reiterated Nov-5; Street-high; thesis = embodied-AI/robotics optionality + robotaxi). Benchmark $475 Buy (post-Q3).
• Cautious/negative: UBS $247 Sell (raised from $215 but still bearish on deliveries/margins).
• Tape-check from Tesla: Q3-25 revenue $28.1B, non-GAAP EPS $0.50, record FCF, record deliveries & storage. (EPS miss vs some expectations; revenue beat.)
________________________________________
🔍 Headlines that moved the needle
• NHTSA opens new FSD probe (scope ~2.9M vehicles).
• FSD v14 (Supervised) broad rollout; AI capacity to ~81k H100-eq; Bay Area robotaxi ride-hailing noted (Q3 deck).
• OBBB EV tax credits sunset 9/30/25; binding-contract/time-of-sale guidance enables limited post-deadline claims.
• Q3 print: record deliveries, record energy storage, record FCF; EPS light vs some models but narrative shifts to AI/energy.
________________________________________
🧭 Technicals: Levels & Structure (weekly focus)
Primary structure: since late-2022, TSLA’s traded inside a contracting wedge, with noteworthy compression into 2H-2025—typical of late-stage accumulation before a decisive break. Momentum divergences are improving on weekly frames even as price consolidates.
________________________________________
Key levels (spot-agnostic):
• Support: $360–$370 (prior breakdown area/weekly shelf); $330–$345 (multi-touch base/pivot); $310–$320 (cycle risk zone).
• Resistance: $405–$420 (range top & supply), $450–$475 (post-robotaxi pop zone / analyst PT cluster), $500 (psych), then $600–$650 (LT measured target band).
• Roadmap Expect one more downside probe into $310–$320 in Q1-2026 to complete the wedge, then trend break and resume bull leg toward $600/$650 over the subsequent cycle (≈ ~100% off the projected low).
• Risk markers: sustained weekly closes < $305 would postpone the “final low” timing and force a re-mark to the 200-week MA cluster; weekly closes > $475 accelerate the upside timing toward the $500/$600 handles.
________________________________________
Cases unchanged framework
• Bull: Robotaxi expands to more metros, regulators settle into a supervised-AV regime, energy/AI scale continues; market re-rates to $475–$600 (Benchmark/Wedbush anchors).
• Base: Solid execution across autos + energy, FCF stays healthy, autonomy rolls out cautiously under oversight; stock tracks Street $350–$400 band.
• Bear: Delivery softness post-credit-sunset, tougher pricing in China/EU, or adverse NHTSA actions; retest of $300–$330 zone before trend resolution.
________________________________________
What to watch next (60–90 days)
1. NHTSA probe path and any software/recall remedies.
2. Robotaxi geographic expansion cadence and any shift from safety-monitor to remote-assist ops.
3. Energy bookings & Megapack 3/Megablock ramp against utility RFP calendars.
4. Delivery run-rate post-credit sunset and mix of Standard trims.
________________________________________

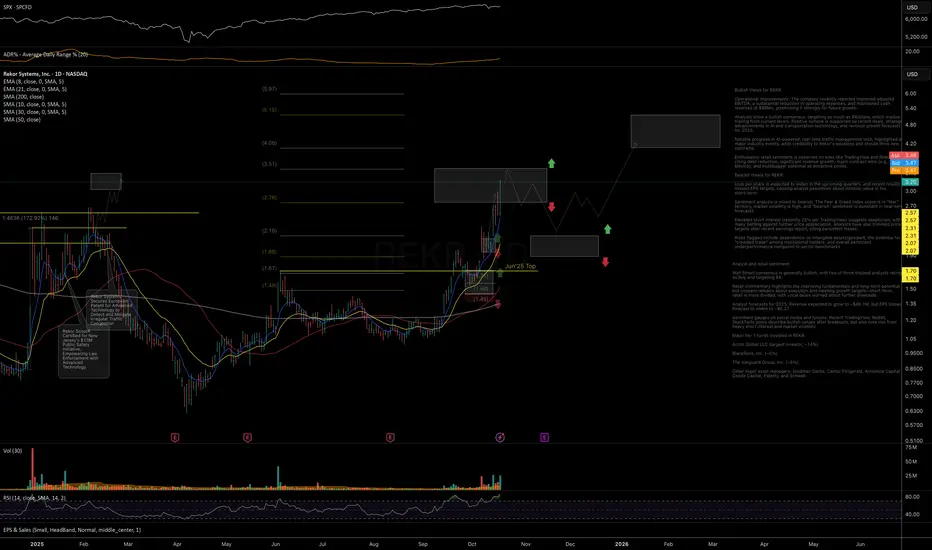
REKR: price reached resistance level. Watching for pullback Strong follow-through into the next resistance zone since the previous October updates. Watching for potential selling pressure to start building and for price to pull back toward rising EMAs.
As long as price remains above the 2.20–1.90 support zone, the trend structure continues to suggest further upside potential toward the 4.00–5.15 resistance area after a new base formation.
Chart:
Previously:
• On upside potential (Oct 14):
www.tradingview.com
• On support zone (Oct 7):
see weekly review:
• On bullish trend structure (Oct 1):
www.tradingview.com
Understanding AI in Trading: How Machines Actually TradeWhat if you were one solid AI model away from the life you pictured, the dream house, and that shiny Lambo in the garage?
Can AI really level the playing field so retail traders operate like pros, or is it quietly widening the gap between individuals and institutions?
Let’s strip the hype, keep the power, and see how machines actually hit the market.
From Concept to Application
An AI trading system, or more precisely a machine learning system, learns from data. It processes massive historical datasets with hundreds of variables, indicators like RSI, MACD, or Bollinger Bands, as well as macro data such as interest rates, employment figures, or even alternative data. If it’s a number, the model can read it.
It works across different time horizons, from sub minute intraday data to decades of monthly charts. That range depends on the model’s design and the kind of patterns it is built to detect.
Once the data and time frames are defined, the machine uses math, linear algebra and optimization, to uncover relationships that humans usually miss. Whether it is a simple regression, a computer-vision network that “reads” price charts, or a multi-agent setup that delegates tasks between bots, the foundation is always the same: matrices and optimization. That’s how machines think.
Broadly speaking, machine intelligence is based on reproduction, not prediction. It doesn’t see the future; it measures the past and projects tendencies forward.
A Machine Learning Tool in Practice
Let me show you how this looks in real life through a model that completely reshaped how I trade. It's simple enough for any retail trader to use, yet solid and rigorous at its core.
For a better understanding, see the model chart here:
1. Discovering True Market Structure
The model builds what I call a main channel, a living corridor that learns how price naturally moves. The slope of this channel instantly shows if the market mood is bullish or bearish, while its angle reveals the strength behind that move.
The width of the channel speaks the language of risk. It shows how far price can deviate from its mean before breaking the pattern recognized by the machine. In simple terms, it measures how much turbulence the market can handle before the trend truly changes.
Think of it as Bollinger Bands on steroids: self-adjusting, smoother, and far more adaptive.
Around the price, you’ll see pale white dots, the model’s built-in risk sensors. They turn volatility into a visual map that shows where normal movement ends and real danger begins.
As long as price stays on one side of the dots, the trend remains intact. When it pushes through and the dots flip sides, that’s your early alert that a counter-move is coming, even if the main trend is still valid.
Those dots also serve as smart stop-placement guides. They adapt faster than the main channel, letting you protect profits without reacting to noise. It’s like having a smaller, agile pilot inside a bigger, steady aircraft.
When price crosses from below to above the dots, strength returns; when it drops below, momentum fades. That’s where AI logic meets classic technical analysis, confirming what your eyes sense and your instincts suspect.
2. Checking Sentiment in Motion
Below the chart, a lower panel acts like the emotional dashboard of the market. It shows not just what prices are doing, but what traders are feeling.
The histogram works as a health monitor. When it stays green, buyers dominate and the market is healthy. When it turns red, sellers take over and caution becomes the smart play.
Then comes the red line, the true heartbeat of machine intelligence. This is where AI shows its edge. The model constantly scans for contradictions within the trend, searching for anomalies that human eyes often miss.
When that red line suddenly collapses, it is the machine whispering that something unusual is forming, often signaling that a move is running out of steam and a sharp countertrend swing is near. Those moments are pure gold for taking profits or positioning early for a reversal, often with massive reward-to-risk potential.
For instance, in the chart attached, the red line collapsed just one day before BINANCE:BTCUSDT reached its all-time high. While price action was euphoric and traders were celebrating new records, the model flashed a silent warning. Days later, the market unraveled, triggering the largest liquidation event in crypto history.
3. Measuring the Health of the Phase
To simplify reading conditions, every candle on the chart is color-coded to match the current market phase:
Green means bullish momentum is on your side.
Yellow or orange signals transition, time for patience.
Red marks bearish pressure, a moment for defense.
These colors intentionally react slower than price, filtering out emotional whiplash. They confirm when a move is genuine and warn when enthusiasm is fading.
This visual layer gives you something most traders lack: context. In one glance, you can tell if the market is confident, cautious, or fearful, and align your decisions accordingly.
Can AI Really Close the Gap Between Retail and the Pros
The example above shows what happens when machine learning is used with intention. It doesn’t replace judgment; it amplifies it. It adds depth, color, and precision to analysis, turning raw data into clear, confident action.
Still, every trader wonders the same thing: is AI the holy grail everyone’s been chasing?
Here’s the truth. AI excels at spotting patterns in stable, predictable environments, that’s why your phone finishes your sentences and why ChatGPT feels almost magical. It operates in a world where rules rarely change.
The market is the opposite. It breathes, shifts, and reinvents itself daily. That constant change is what makes it fascinating, and what makes it hard for machines to predict with precision.
A trading model must relearn often. It adapts, forgets, and learns again. Its accuracy will never match that of a chatbot or an image generator because markets are alive. That’s where human judgment becomes essential. Only a person can see context, interpret uncertainty, and decide when a model has lost its edge, needs recalibration, or belongs in the trash bin.
This is why large institutions employ entire teams of quants to monitor and update their systems. Machine learning is not a one-time task; it’s a continuous process of evolution.
Bottom Line
AI in trading isn’t a crystal ball. It’s a mirror that reflects how markets behaved and projects those patterns into the near future. It doesn’t think or feel, but it can see relationships most traders miss.
Used correctly, AI gives retail traders access to capabilities once reserved for hedge funds and prop desks. You can now detect patterns hidden deep in the noise without needing a lab or a team of quants.
The key is to keep the roles clear. Let the machine handle the data. Let you handle the decisions. Use AI to frame probabilities, manage risk, and act with discipline. That’s how a retail trader turns AI hype into a real, measurable edge.

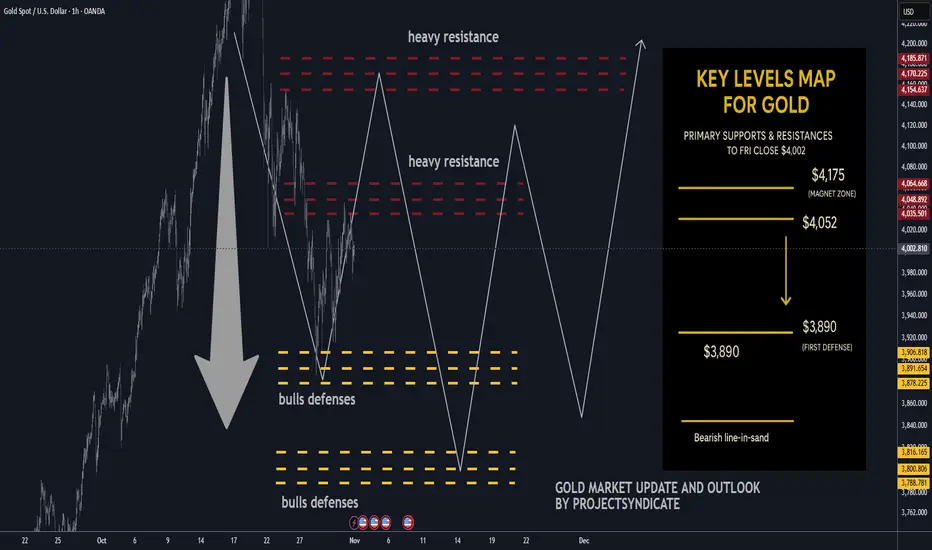
Gold next week: Key S/R Levels and Outlook for Traders🔥 GOLD WEEKLY SNAPSHOT — BY PROJECTSYNDICATE
🏆 High/Close: $4,024.9 → ~$4,003 — sellers faded upticks; weekly close soft but back above the round $4k.
📈 Trend: Neutral / mild correction inside range; not expecting immediate new highs while <$4,080–4,120.
🛡 Supports: $3,950 → $3,900 → $3,850 — pivotal shelves for bears’ take-profit and control.
🚧 Resistances: $4,040 / $4,080 / $4,120 — repeated supply zones; first taps favored for fades.
🧭 Bias next week: Short sells into $4,040–$4,120; TP $3,950 then $3,850 (your plan). Invalidation on sustained reclaim > $4,120–$4,175; loss of $3,850 risks extension lower.
🌍 Macro tailwinds/headwinds (this week’s tape):
• Narrative tone: Kitco flagged “razor’s edge” near $4,000 with mixed views (bubble vs. consolidation), while another Kitco piece framed the stall as a “healthy pause.”
• WSJ flow: Headlines oscillated between “slips below $4,000” and modest up-days; net read is consolidation around $4k with quick two-way trade.
• Levels: Spot finished the week essentially on $4k; intrawEEK high couldn’t clear early-week $4.02–4.03k cap.
🎯 Street view: After last month’s print above $4,000 (first ever), WSJ tone shifted to digestion; rallies still attract supply until a decisive reclaim of upper resistance.
________________________________________
🔝 Key Resistance Zones
• $4,040 — immediate ceiling; weekly high proximity, likely to cap first tests.
• $4,080 — secondary supply ledge from recent failures.
• $4,120 — upper band; acceptance above here starts to neutralize the correction.
🛡 Support Zones
• $3,950 — first defense / first TP.
• $3,900 — round-number shelf; loss invites momentum probes.
• $3,850 — critical structural base and second TP; break risks downside acceleration.
________________________________________
⚖️ Base Case Scenario
Compression within a rising-wedge-like structure, ranging $3,850–$4,120. First pushes into $4,040–$4,120 are sellable for rotations toward $3,950 → $3,850 while the market respects weekly lower highs.
🚀 Breakout / Breakdown Triggers
• Bull trigger: Sustained acceptance > ~$4,120–$4,175 turns the tone constructive again and reopens $4,200+.
• Bear trigger: Daily close < $3,900 increases odds of full $3,850 test; failure of $3,850 risks momentum spill.
💡 Market Drivers to watch
• Fed path / real yields (rate-cut odds vs. sticky inflation narrative in WSJ copy).
• USD swings (no broad USD weakness → upside attempts stall).
• ETF/CB flows (Kitco interviews highlight split sentiment; dip-buyers active, momentum players cautious).
• Event risk (headline sensitivity remains high; quick squeezes into resistance possible).
🔓 Bull / Bear Trigger Lines
• Bullish above: $4,120–$4,175 (sustained).
• Bearish below: $3,900 → $3,850 (risk expands under $3,850).
🧭 Strategy for this week
Short from resistance: Scale in around $4,040 → $4,080 → $4,120;
TP #1: $3,950; TP #2: $3,850;
Risk: Hard stop on a daily close above $4,120 (or intraday breach that holds on retest). Consider trimming if a news-driven squeeze tags $4,175 and fails.
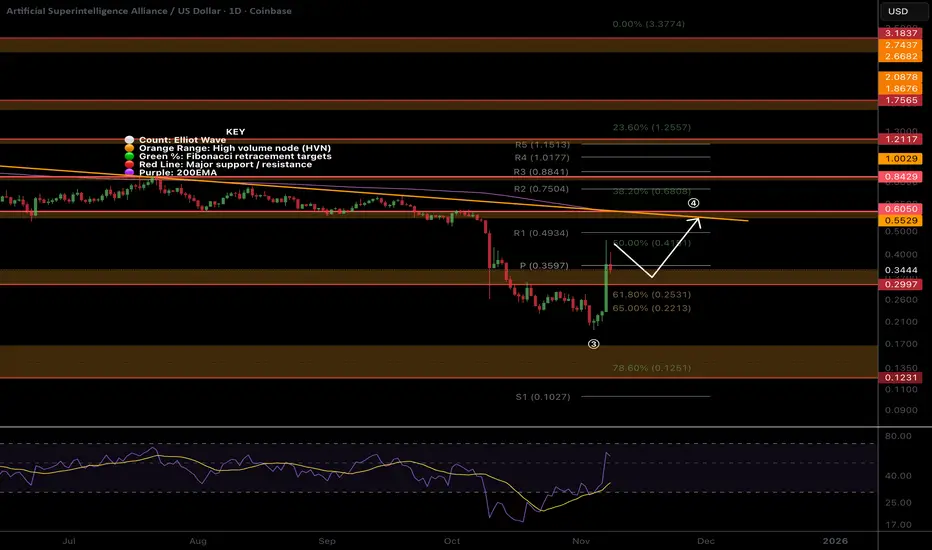
FET, Pump and dump?NYSE:FET Price bounced with a one day candle of 70% recovering the High Volume Node resistance and daily pivot from the golden pocket Fibonacci retracement.
Chasing candles higher is what’s on the cards of naive investors now. Greed and FOMO immediately took over socials with much gloating. This is a recipe for lower, humbling them.
📈 Daily RSI went too high, too fast, and now has bearish divergence in a bear market, a strong signal.
👉 Continued upside has a target of the daily 200EMA and High Volume Node resistance at $0.6.
Safe trading
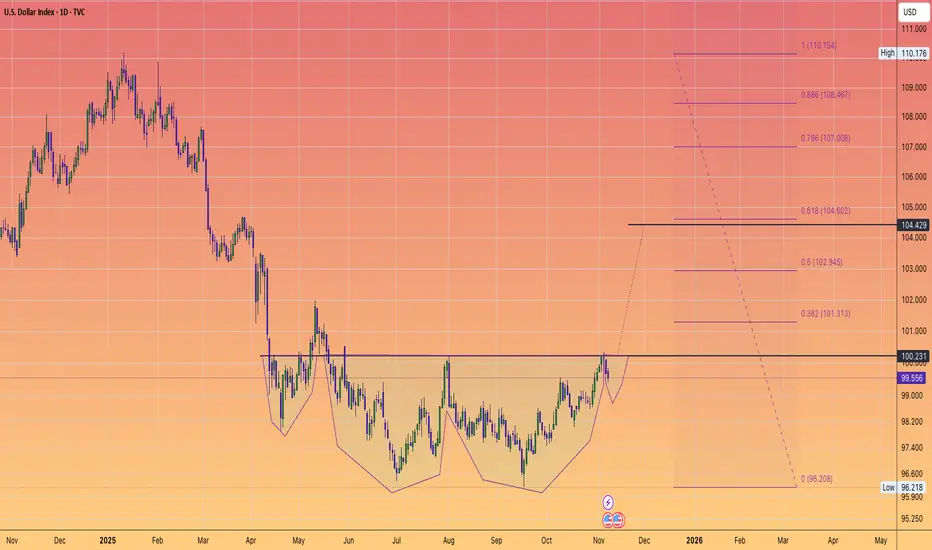
$DXY eye a 5 point move. RISK OFF.The dollar index is reversing course.
And I believe highly likely to trigger this complex inverse head and shoulder's.
A swift move to the 105 region
lines up with a expected downside move in #BTC
A corrective move in the #PreciousMetals
and further profit taking on the #AI trade.
I believe this all could play by Xmas.
So the odds of a #SantaRally are slim given current price action that we are seeing across the board.
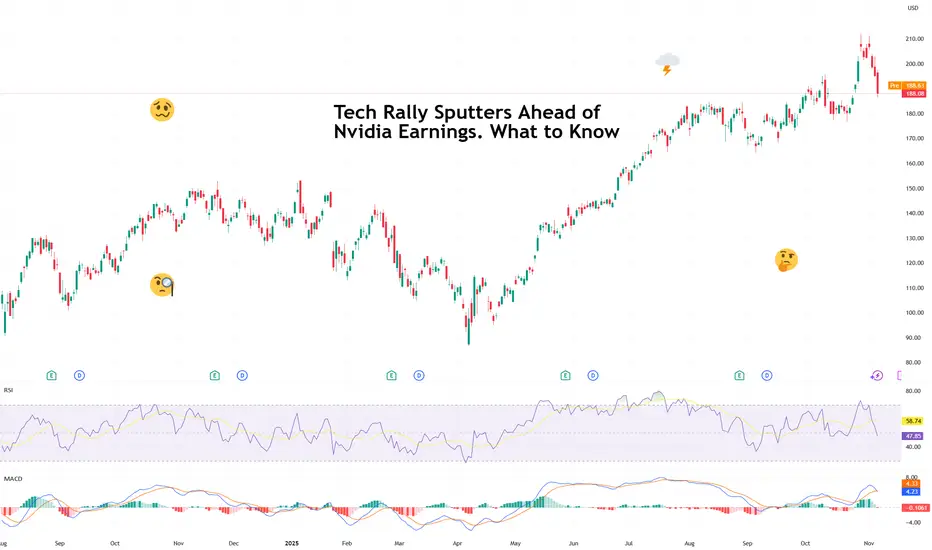
Tech Rally Sputters Ahead of Nvidia Earnings. What to KnowIs the powerful AI sector finally out of breath? With valuations that stretched, some investors fear if we all took it too far.
After months of seemingly unstoppable gains, the tech trade is finally showing signs of fatigue. Stocks are back in the red this week, with technology — the sector that’s carried the entire market on its silicon shoulders — leading the declines.
The S&P 500 SP:SPX , up more than 35% since its April lows and boasting 36 record closes this year, has been powered almost entirely by a handful of tech heavyweights.
The Magnificent Seven now make up nearly 40% of the index’s market value and roughly a third of its earnings.
But now, investors are wondering if the rally’s run too far, too fast. The question echoing across trading desks: Is AI finally out of breath?
💸 The Price of Perfection
It’s not that tech earnings have been bad — in fact, they’ve been stellar. Microsoft NASDAQ:MSFT , Amazon NASDAQ:AMZN , Meta NASDAQ:META , and Alphabet NASDAQ:GOOGL all beat expectations last week and promised even more AI spending next year. Translation: more orders for Nvidia’s chips, more data centers, more server farms, more everything.
But good news isn’t moving the needle right now. When valuations stretch this far, even “great” can start to look “meh.” Investors are realizing that the higher you climb, the thinner the air gets.
The entire AI complex — from semiconductors to cloud computing — now trades at multiples that assume not just perfection, but sustained, exponential perfection. And that’s a tough sell when rates are still relatively high, inflation is sticky, and the Fed remains data-deprived thanks to a looming government shutdown (now the longest in history).
🧠 Nvidia: The Market’s Favorite Crystal Ball
Which brings us to Nvidia NASDAQ:NVDA — the stock that can save the day. The chipmaker reports fiscal third-quarter earnings on November 19, and it’s shaping up to be a defining moment for the entire market.
Expectations are sky-high: analysts see earnings per share of $1.25, up from $0.81 a year ago , and revenue of $54.6 billion, a jaw-dropping 56% increase from last year’s $35 billion.
If Nvidia delivers (again), it could reignite the rally and remind investors why they fell in love with AI in the first place. But if there’s even a hint of deceleration — a cautious forecast, a whisper of supply constraints — the selloff could accelerate.
Simply put: as goes Nvidia, so goes the market. Fast fact: Nvidia washed out more than $450 billion from its valuation in just the last three days .
🔌 The Waiting Game
With two long weeks until Nvidia’s report, traders are stuck in a sort of limbo. Without a fresh catalyst, the market could decide to churn sideways — or drift lower — as profit-takers cash in on their massive gains.
The uncertainty isn’t helping either. A government shutdown delays key economic data, leaving the Fed flying in the dark just as investors are trying to gauge when rate cuts might actually arrive.
That means more guesswork, less conviction, and a good chance of exaggerated market swings.
So don’t be surprised if volatility ticks higher before Nvidia’s big reveal — the gem of the earnings calendar .
Off to you : How do you see the next two weeks unfolding? And, more importantly, are you bullish or bearish on Nvidia’s earnings report?
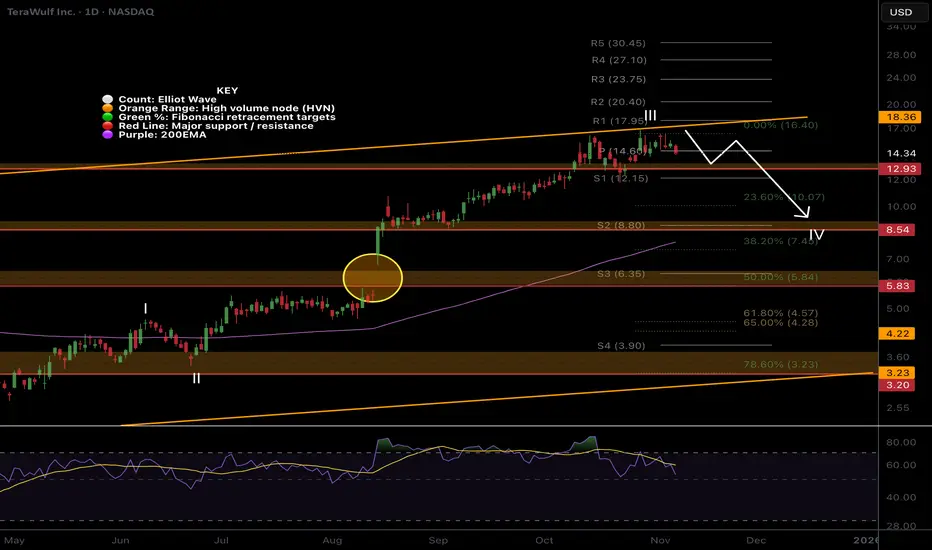
WULF pullback on the cards!Price is struggling at the trend-line boundary on bearish divergence suggesting wave III is complete and wave IV is soon underway.
Due to the size of the rally wave IV could be deep. The usual 0.382 target is down at $8 where it would meet the daily 200EMA.
Daily RSI has printed bearish divergence in overbought.
breaking out above the trend-line could be extremely bullish.
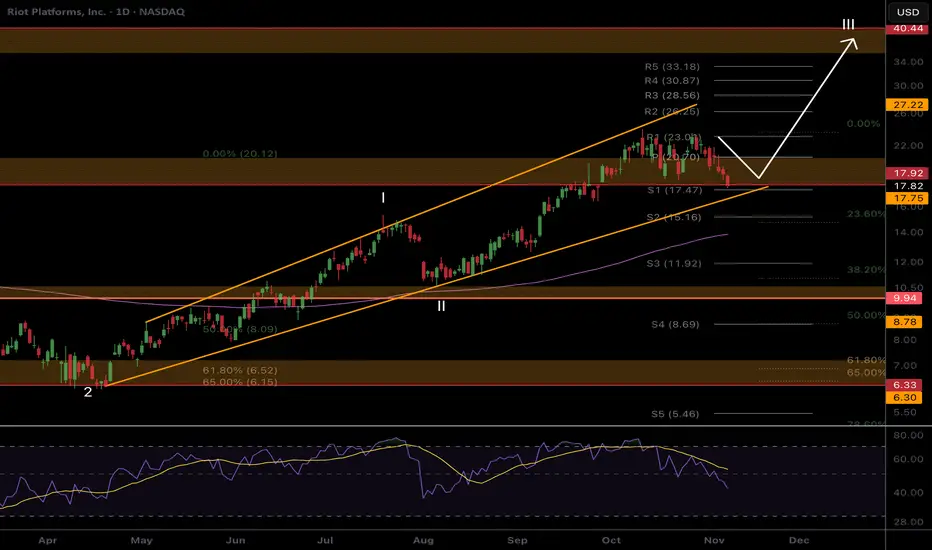
RIOT Respecting the boundariesPrice remains in its uptrend channel demonstrating shallow pullbacks as is characteristic of wave III.
Price is consolidating above support which could lead to a break down below but still within the boundaries of the channel. Daily 200EMA is ascending to meet price and support lines.
Daily RSI has printed unconfirmed bullish divergence at the EQ.
Continued upside has a $40 target at the next High Volume Node.
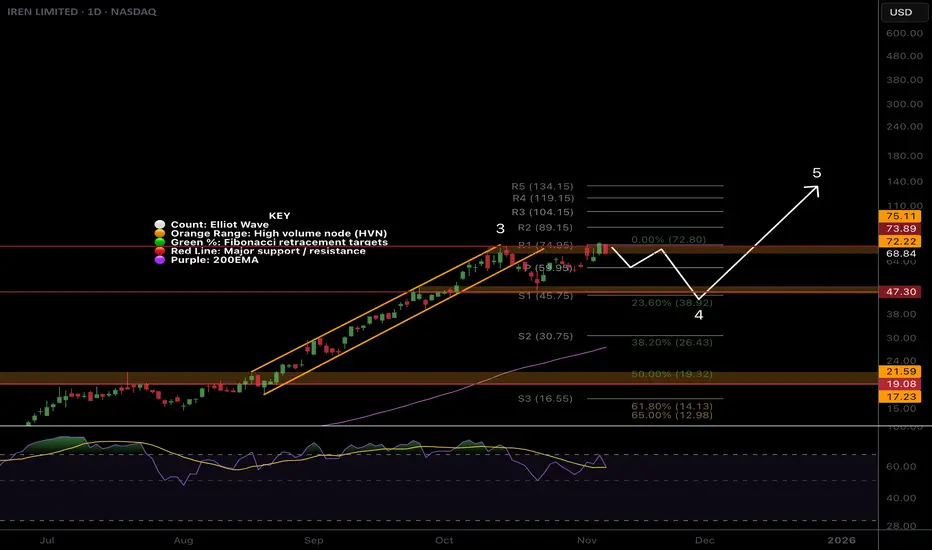
IREN pullback on the cardsNASDAQ:IREN is breaking out again on huge candle spread, though I am skeptical of continued rally from here without a pullback first. For now the trend is up.
Price has broken out of its momentum channel and formed a range so I am expecting the excitement to trap late comers and traders with a swift reversal in wave 4. Initial downside target is $47 at the High Volume Node and .0236 Fibonacci retracemenet. Stronger downside momentum could test the rising daily 200EMA at the 0.382 Fibs.
Daily RSI has printed unconfirmed bullish divergence at the EQ.
Continued upside keeps us looking at the pivot targets.
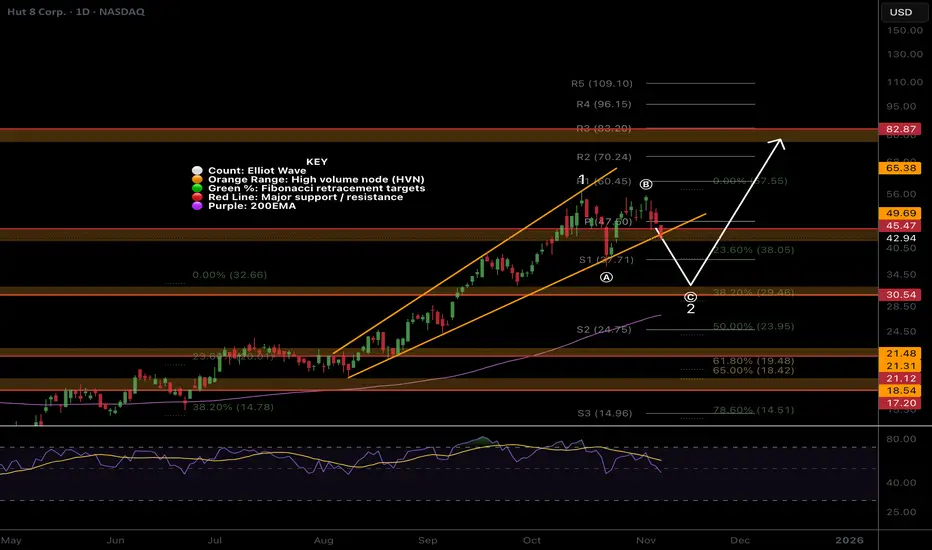
HUT Within channel boundary, all fine locallyNASDAQ:HUT Wave 1 appears complete at the channel upper boundary on bearish divergence.
For now the probability is to the upside and the trend is in tact. However, wave (B) of 2 looks complete. Wave C is expected to be strong and scary, capitulating many. Price is expected to terminate at the 0.382 Fibonacci retracement, High Volume Node support and rising daily 200EMA.
Daily RSI has printed bearish divergence from overbought but also bullish divergence at the EQ. This is ambigous.
Continued upside has a target os the $82 High Volume Node resistance.
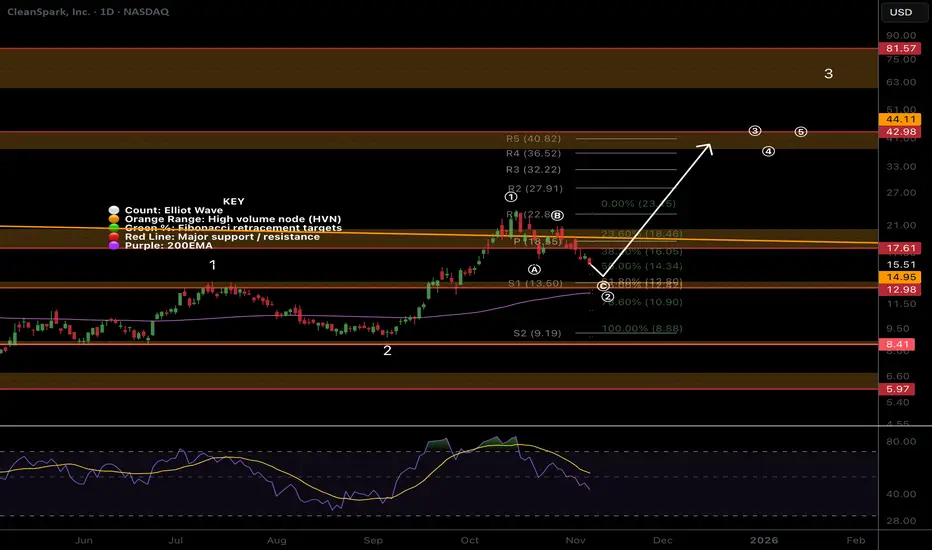
CLSK Local analysis, pullback does not violate larger trendNASDAQ:CLSK Price is pulling after a failed breakout falling back into the macro triangle. Behaviour appears to be a textbook corrective ABC which should end with one more thrust down to the S1 pivot before continuation to the upside.
Wave © can be strong and powerful, often where investors capitulate. The target is the High Volume Node support, rising daily 200EMA, Fibonacci golden pocket and S1 pivot.
Daily RSI has room to fall.
Breaking above wave (B) would suggest the correction is over.
CIFR Pullback time?NASDAQ:CIFR Locally, price continues into price discovery with big jumps suggesting wave 3 is still going Wave (5) of 3 appears to be underway which could end at any moment. I am still expecting a retracement to test the previous all time high and punish late investors who are chasing prices up, trapping them into capitulation later.
Wave 4 has a downside target of the 0.236 Fibonacci retracement, High Volume Node support + the trend-line retest, $14. This may also meet the ascending daily 200EMA.
Daily RSI has a series of bearish divergence from overbought which a strong signal for a reversal.
Continued upside could run the daily pivots to $38.

BTDR Consolidation below support often leads to a breakoutNASDAQ:BTDR Locally, price is struggling at the expected High Volume Node resistance but without a major rejection. Consolidation below resistance often leads to a breakout
Wave (3) characteristics are being followed with shallow pullbacks so far. The target for a stronger downwards move is the golden pocket and S1 pivot at $17 which would meet the rising daily 200EMA, adding confluence to a local bottom. This would be normal and should be expected.
Daily RSI has printed unconfirmed bullish divergence at the EQ.
Continued upside would flip $25 resistance into support.

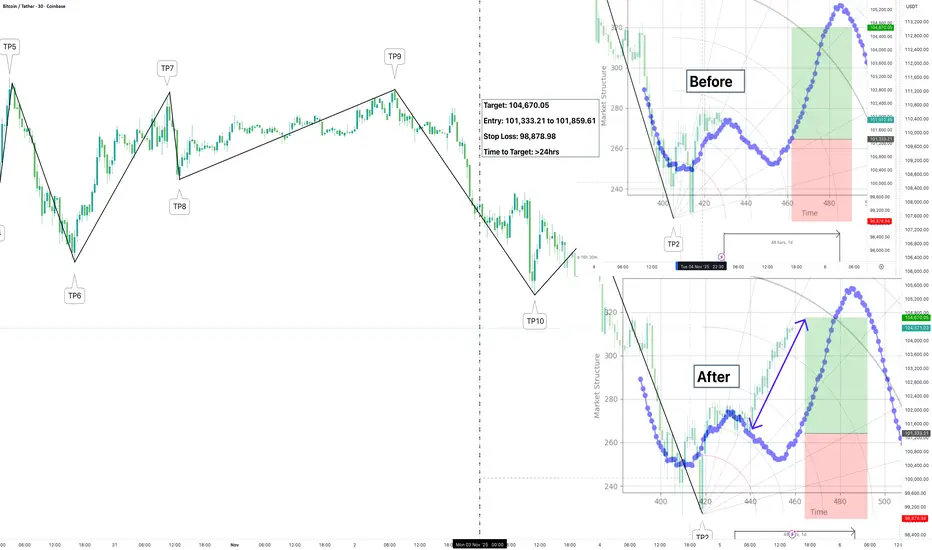
Wow! Back-to-back accuracy – it did it again!Check out this before-and-after on BTC/USDT (or similar pair). In the "Before" chart, we had a clear setup with Entry at 101,333.21 to 101,859.61, Target up to 104,670.05, and Stop Loss at 98,878.98. Time to target: >24hrs. The structure was pointing to potential downside continuation, but watch how it flipped.
Fast forward to "After": Price smashed through TP9 and TP10 like clockwork, with precise hits marked. From the initial downtrend, it reversed sharply into green territory, validating the levels spot-on. This indicator's consistency is unreal – nailing multi-TP runs in volatile markets.
If you're trading crypto or forex, you need this edge.
#TradingView #CryptoTrading #TechnicalAnalysis #BTCUSDT #TradingSignals
Gold Bull Market Update and Outlook Q4 2025 / Q1 2026📌 Executive Summary
• Base case (60%): The current pullback is a normal retracement within the primary bull trend. We expect consolidation through late Q4-2025 and potentially into January 2026, followed by a resumption of the uptrend in Q1/Q2-2026.
• Drivers remain intact: Persistent central-bank accumulation, reserve-diversification dynamics, and episodic macro/geopolitical risk keep the structural bid under gold.
• Positioning stance: Maintain core long exposure, add tactically on weakness into the $3.8k–$4.0k zone spot equivalent with tight risk controls, and ladder call spreads into Q2-2026.
• Risk skew: Near-term pullback risk persists position shakeouts, macro data surprises. Structural bearish risks are low unless central-bank demand materially softens.
________________________________________
🧭 Market Context & Recent Price Action
• Gold printed successive record highs into mid-October; front-month futures traded above $4,170/oz before easing. Headlines framed the rally as policy and safe-haven led, with year-to-date gains exceptionally strong.
• Central-bank demand continues to underpin the move: WGC and sell-side coverage highlight accelerating official-sector buying and diversification away from FX reserves; banks forecast higher prices into 2026.
• The current setback aligns with prior bull-market pauses (e.g., Apr–Jul 2025 and Sep 2024–Dec 2024 pullbacks), consistent with the user-stated pattern of multi-month consolidations before trend resumption.
What’s new in headlines late Oct–Nov 2025:
• Pullback is “technical and temporary,” with buy-the-dip framing from UBS; next tactical target cited around $4,200.
• Official-sector flows: Korea & Madagascar exploring reserve increases; PBoC extended buying streak into September.
• WSJ coverage stresses gold’s role in erosion of trust in fiat/central banks and the reserve-diversification theme.
________________________________________
🔑 Structural Bull Case 2025-2026
1. Official-Sector Accumulation:
o Multi-year build in central-bank gold holdings (EM-led) as a sanctions-resilient reserve asset; this remains the single most important marginal buyer narrative.
2. Reserve Diversification & Financial Geopolitics:
o Evidence that gold’s share of global reserves has risen while some institutions reassess currency composition.
3. Macro Volatility & Policy Trajectory:
o Periodic growth scares, policy pivots, and real-rate uncertainty sustain hedging demand. Street targets for late-2026 (e.g., ~$4,900 GS) anchor upside convexity.
4. Market Microstructure:
o Thin above prior highs and crowded shorts on pullbacks can fuel sharp upside re-accelerations when macro catalysts hit data, geopolitics, policy hints.
________________________________________
📊 Technical Map Top-Down
• Primary trend: Up. The sequence of higher highs/higher lows since 2024 remains intact; current move is a trend-within-trend consolidation.
• Pullback anatomy: Prior bull pauses (Apr–Jul 2025; Sep–Dec 2024) lasted 2–4 months, with troughs forming on volatility compression and momentum washouts—a template for now.
• Key tactical zones spot-equiv.:
o $3,800–$4,000: First reload area prior breakout shelf / 50–61.8% of the last leg.
o $4,200–$4,250: First resistance / re-acceleration trigger retests of breakdown pivots.
o $4,350–$4,400: High congestion; decisive weekly close above here re-opens ATH extension.
________________________________________
🗓️ Scenario Pathing Q4-2025 → Q2-2026
• Base Case 60% — “Consolidate then resume”:
o Sideways-to-lower into late Q4/Jan 2026 as positioning resets; range $3.8k–$4.2k.
o Breakout resumption in Q1/Q2-2026 as macro and official flows re-assert.
• Bullish Extension 25% — “Shallow dip, quick reclaim”:
o Softer real yields / risk flare trigger swift recapture of $4.2k–$4.4k and new highs earlier in Q1-2026.
o Catalysts: heavier central-bank prints, geopolitical shock, or earlier policy-easing rhetoric.
• Bear-Risk 15% — “Deeper flush, trend intact”:
o Hawkish macro surprise or forced deleveraging drives $3.6k–$3.7k probes; structure holds unless official-sector demand meaningfully fades
________________________________________
🧪 What to Watch High-Signal Indicators
• Official-Sector Data: Monthly updates from WGC, IMF COFER clues, and PBoC reserve disclosures. Continuation of EM purchases = green light for the bull.
• Rates & Liquidity: Real-rate direction and dollar liquidity conditions around data and policy communications.
• Microstructure: CFTC positioning inflections, ETF out/in-flows a lagging but useful confirmation when they finally turn.
• Asia Physical/Policy: China/Japan retail and wholesale dynamics; policy/tax headlines can create short-term volatility.
________________________________________
🎯 Strategy & Implementation
1) Core:
• Maintain strategic long allocation consistent with mandate e.g., 3–5% risk budget; avoid pro-cyclical reductions during orderly pullbacks.
2) Tactical Adds
• Scale-in buy program within $3.8k–$4.0k
• Optionality: Buy Q2-2026 call spreads (e.g., 4.2/4.8) on dips; fund via selling Q1-2026 downside put spreads around $3.6k–$3.7k where comfortable with assignment.
3) Risk Controls 🛡️:
• Hard-stop any tactical adds on weekly close < ~$3.6k or if credible evidence emerges of official-sector demand reversal.

$GOOG | Alphabet Google | The Everything Tech CompanyAlphabet NASDAQ:GOOG is the everything tech company. Do your future self a favor and get some. Yes, it will crater as soon as you buy it. Your short-term future self will cry and whine and throw a fit and try to panic sell. But your far future self will appreciate it.
Robots? Had backflipping robots years ago
Internet? Been scraping that for decades.
AI? We summoned the great prompter into existence.
Nvidia GPUs? Pshhh... We've got TPUs bruv
Gold teeth? Check.
Performance enhancing drugs? Check the squats broh
You winning son? Close the door dad. I'm busy buying NASDAQ:GOOG
We buyin dips. We buyin corrections. We buyin crashes.
Check the target for our first add level.

Singapore release 2020Singapore model AI governance framework focused on
internal governance structure and measure
human involvement in AI augmented decision making
operation management
shareholders interaction and communication
JAPAN FROM 2019
Japan social principle of human centric AI Include
human centric
Education/literacy
privacy protection
ensuring security
fair competition
fairness accountability and transparency
innovation
OECD update 2024
The OECD principle on intelligence cover
Inclusive growth sustainable development and Will being
Human rights and democrats value including fairness and PRIVACY
Transparency and safety
Accountability UNESCO set out in 2021
Proportionally and do no harm
Safety and security
Sustainability
Right to PRIVACY and data protection
Human oversight and determination
Transparency and explainability
Awareness and library
Muilti shakeholder and adaptive governance and collaboration
Enhancing citizen experience using chatGPT in the Tokyo metropolitan government
In 2023 the Tokyo metropolitan government (TMO) embarking on series of pilot looking at using chatGPT for text creation idea generations and other clerical work, significantly the TMG also release four foundation guidelines to aid staff in their approach to using genAI with thanks to apolitical a sosial learning network to government for writing up these finding we know the principles were
Don't input highly confident information
Don't general text that infringes copyright
Always verify response given by AI independtly
If you directly response generated by AI indicate these response were created using AI

META Buy Opportunity – KZDZ ModelMETA Game Plan – KZDZ Model
📊 Market Sentiment
On 29/10, the FED lowered rates by 25BPS, as expected. However, Powell’s remarks added uncertainty around further cuts in December, stating that future decisions will be data-dependent.
One FED member dissented, preferring no cut this cycle — a notable shift from September’s unanimous decision.
Following this, rate-cut expectations dropped from 95% to 68%, sparking short-term bearish sentiment as traders took profits and hedged exposure.
Despite this volatility, the mid-to-long term outlook remains bullish given the broader liquidity cycle and easing policy stance.
📈 Fundamental
META earnings missed expectations, triggering a sharp sell-off. While short-term sentiment is bearish, the long-term outlook remains supported by ongoing AI development initiatives.
📈 Technical Analysis
1-Hit oversold RSI on the daily timeframe.
2-Retraced to the 0.5 Fibonacci equilibrium zone (≈ $640).
3-Tested a major HTF Key Zone around $625, signaling potential accumulation.
📘 Model in Use – Key Zone with Discount Zone (KZDZ Model)
The KZDZ Model identifies areas where discounted Fibonacci levels align with strong HTF liquidity zones, offering high-probability reversal opportunities.
1️⃣ Identify HTF Key Zone
2️⃣ Align with Discount Zone (0.5–0.75 range)
3️⃣ Look for confirmation structure on LTF
4️⃣ Execute and manage risk accordingly
📌 Game Plan
Scenario 1 (Black Path): Watch for price to hit $625 and close above $640 (daily). Upon confirmation, plan to buy C640 options targeting $680–$700.
Scenario 2 (Red Path): If price fails to reclaim $640, monitor for a deeper move to $560, then look for weekly rejection above that zone. Entry via C560 options, targeting $620–$700.
🎯 Setup Trigger
Scenario 1 → Daily close above $640 after retesting $625.
Scenario 2 → Weekly close above $560 zone.
📋 Trade Management
Scenario 1: Buy C640 Calls → take profits at $680–$700.
Scenario 2: Buy C560 Calls → partial profits $620–$640, rest at $680–$700.
Move stop to breakeven after first target is hit.
💬If this META breakdown supports your outlook, like, comment, and follow.
For deeper sentiment and strategy updates, subscribe to my Substack free access available.
⚠️ This analysis is for educational purposes only and does not constitute financial advice. Always conduct your own research before trading or investing.

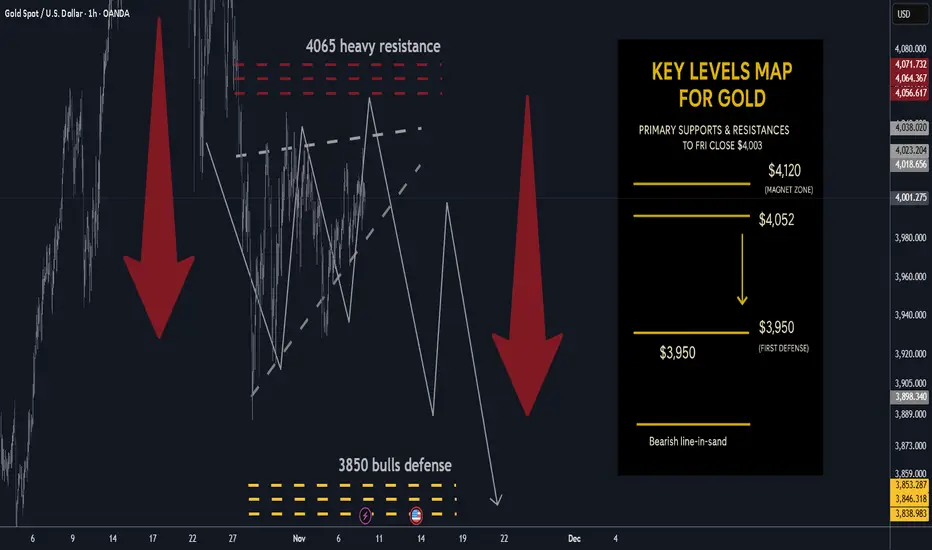
Gold next week: Key S/R Levels and Outlook for Traders🔥 GOLD WEEKLY SNAPSHOT — BY PROJECTSYNDICATE
🏆 High/Close: $4,108 → ~$4,002 — sellers defended overhead; weekly close soft within range.
📈 Trend: Neutral / correction mode still ON; not expecting new highs near term.
🛡 Supports: $3,890 → $3,800 — pivotal shelves for downside containment.
🚧 Resistances: $4,052 / $4,175 — magnet zones for supply / fade attempts.
🧭 Bias next week: Prefer short sells into $4,052–$4,175 with take-profit toward $3,890 → $3,800. Invalidation on sustained reclaim > $4,175; failure of $3,800 risks extension lower.
🌍 Macro tailwinds/headwinds :
• Rates: Real yields stable-to-firm keep upside contained; any dovish surprise could spark squeezes into resistance.
• FX: DXY mixed—lack of broad USD weakness limits impulse follow-through.
• Flows: CB/ETF demand supportive on deep dips but tepid near highs.
• Geopolitics: Event risk provides intermittent bids; not a trend driver this week.
🎯 Street view: Medium-term bullish narratives reserve diversification, policy easing into 2026 remain, but near-term tape favors mean-reversion lower under resistance.
________________________________________
🔝 Key Resistance Zones
• $4,052 — immediate ceiling; prior supply pivot likely to cap first tests
• $4,175 — upper resistance; acceptance above flips tone from corrective to constructive
🛡 Support Zones
• $3,890 — first defense; loss invites momentum probes
• $3,800 — critical structural base; break risks downside acceleration
________________________________________
⚖️ Base Case Scenario
Range-to-soft trade within $3,800–$4,175. Rallies into $4,052–$4,175 are sellable; expect rotations back toward $3,890 with scope to $3,800 if sellers press.
🚀 Breakout Trigger
Only a sustained acceptance > ~$4,175 negates the correction and opens $4,200+ pathing; conversely, firm rejection at $4,052 with a daily close < $3,890 increases odds of a $3,800 test.
💡 Market Drivers
• Fed path & real-yield drift
• USD index swings
• ETF/CB flow tone on dips vs. rips
• Risk sentiment headlines (geopolitics/trade)
🔓 Bull / Bear Trigger Lines
• Bullish above: $4,175 correction phase likely over if held
• Bearish below: $3,890 → risk expands under $3,800
🧭 Strategy
Short-sell from overhead resistances ($4,052 → $4,175).
Scale profits into $3,890 then $3,800; keep stops tight above trigger levels. Stand aside on fresh longs until sustained reclaim above $4,175 reasserts momentum.
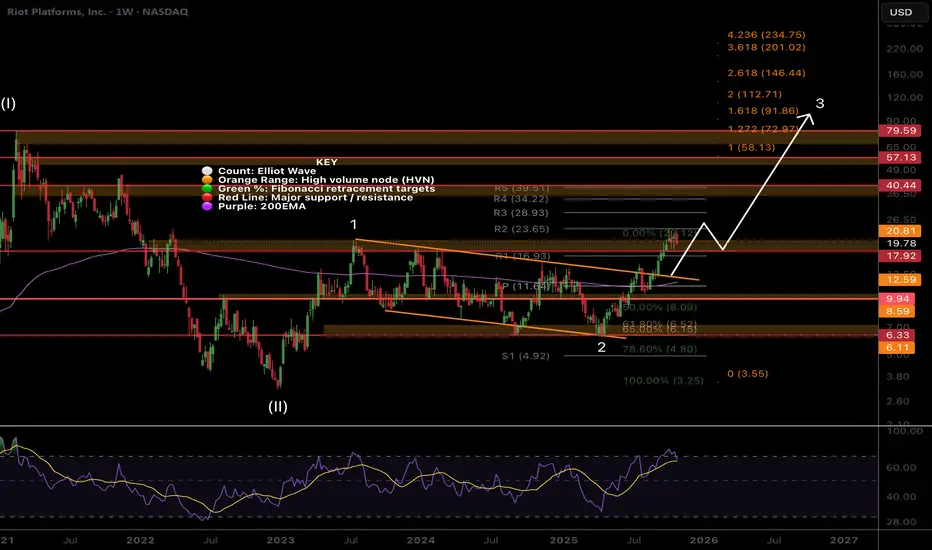
RIOT, nothing changed, Higher...Riot is another low cap volatile asset that keeps people afraid with its wild swings as I am seeing panic in my comments across platforms.
Price remains in momentum breaking out of the channel in a wave 3 with a minimum target of the 1.618 Fibonacci extension at $91, a 4x from here. Wave 2 completed at triple support- Fibonacci golden pocket, High Volume Node and channel boundary before quickly overcoming the weekly pivot and 200EMA. Breaking out above wave 1 is a show of strength.
Price should stall at the High Volume Nodes as supply comes in; $21, $40 and $57 but ultimately they should be overcome.
🎯 Terminal target for the business cycle could see prices as high as $112 based on Fibonacci extensions
📈 Weekly RSI is oversold with no divergence and can remain here for months as price keeps increasing.
👉 Analysis is invalidated if we close back below $9
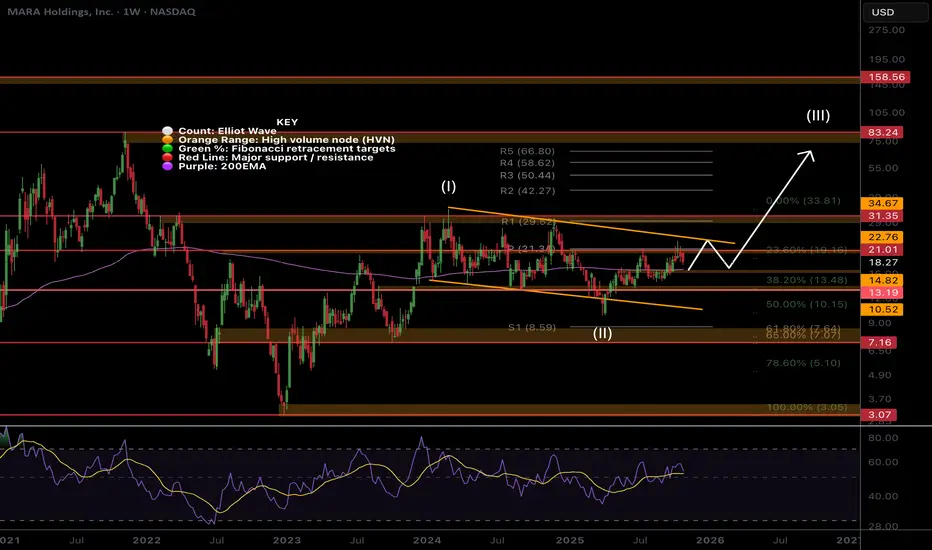
MARA boring... Investors cant waitMara has the potential for a strong move alongside Bitcoin but has ultimately been boring. Investors struggle the most with boredom and see is as negative and bearish. This is not the case and it could just be accumulating towards a strong breakout.
Price is stalling at the weekly pivot as expected but is above the 200EMA- a great buy spot. Wave (II) appears complete at the 0.5 Fibonacci retracement with a swing below the lower boundary trend-line. Wave 3 of (III) appears to be underway so I am looking for an aggressive breakout to the upside once we clear the current resistance. The R1 pivot is the first target at $30 where the last bit of major resistance is. Wave (III) has a target of $83 at the next major High Volume Node resistance, just above the R5 pivot.
🎯 Terminal target for the business cycle could see prices as high as $80 based on Fibonacci extensions and High Volume Nodes
📈 Weekly RSI is at the EQ.
👉 Analysis is invalidated if we close back below wave 2 at $9.50.