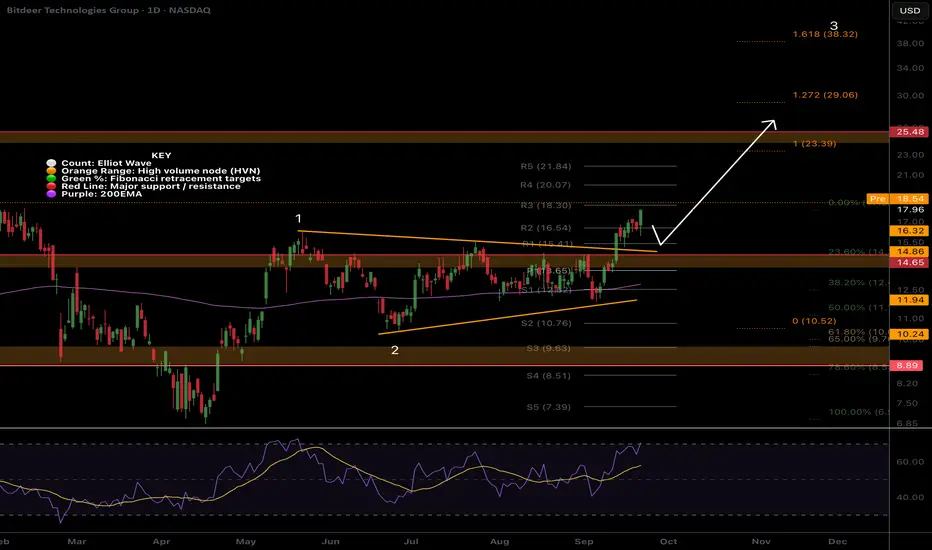
Bitdeer We got the Breakout! BTDRLocal Analysis / Targets / Elliot Wave
NASDAQ:BTDR Price is breaking out aggressively as predicted in previous analysis. We got the push above the descending resistance line. The next target is the $24 all time High Volume Node resistance but wave 3 minimum target is above $30 per the Fibonacci extension tool.
RSI is overbought but with no divergences yet and can remain this way for weeks.
Standard Deviation Band Analysis
Standard deviation bands fair value line was tested as support and price is about to breakout above the SD+3 threshold starting a new trend into price discovery with a $50 target. Traders should still be cautious of a rejection in this area.
Safe trading
AI
CLSK Moving Fast!Local Analysis / Targets / Elliot Wave
CLSK sentiment was awful as I explained a few weeks ago, it appeared to be in a macro triangle similar to XRP before the x10 breakout. That breakout is now underway with a huge move last week characteristic of wave 3 and reinforcing my analysis. Minimum wave 3 targets are well above $20 and price should move quickly once it over comes the triangle resistance it is now approaching at $15.
Price was front run above High Volume Node support and the golden pocket leaving limit orders behind forcing them to buy higher if they want to participate pushing the price up further.
Daily RSI is overbought but so was NASDAQ:IREN and that continued upwards for weeks, as has $WULF.
Standard Deviation Band Analysis
Standard deviation bands remain negatively sloped but I am expecting that to change and price continues upwards. That said, investors should be weary of a reversal in this area where price spends <5% of the time. Bulls are looking for a sustained move into the zone and a breakout above the SD+3 threshold offering a target of $50.
Safe trading

PALANTIR - STOCK REPORT1) Executive summary
Palantir (PLTR) showed very strong revenue growth in 2023–2025 driven by commercial expansion and adoption of its platforms (Gotham, Foundry) across government and private sectors. As of September 2025 the company is clearly profitable on a TTM basis with positive operating margins, strong cash generation (high FCF) and a sizable net cash position. However, relative valuation is extremely high (P/S, EV/Rev, P/E multiples well above peers), reflecting aggressive growth expectations and strong speculative interest.
Main risks: high sensitivity to AI sentiment, reliance on large government contracts and a concentrated commercial customer base, potential regulatory pressure and share-price volatility.
Short recommendation: Hold.
Rationale: financial strength and growth justify exposure, but valuation requires the company to deliver continued high growth and margins; new purchases should wait for a pullback or operational confirmations (stabilized growth rate and guidance). Risk-seeking/high-return investors may consider a partial position.
2) Key data and company overview
Name: Palantir Technologies Inc.
Sector: Software — Data analytics / Enterprise AI
Primary market: NYSE/NASDAQ (Class A) — Ticker: PLTR
Business brief: Software platforms for data integration, analytics and decision‑making (Gotham for governments, Foundry for enterprises, Apollo for deployment). Revenue model: software licenses, SaaS/cloud subscriptions, implementation services and multi‑year government contracts. Main geographies: USA (largest weight, both government and commercial), Europe, expanding APAC.
Market & key metrics (sources: StockAnalysis / MarketBeat / Macrotrends; close price 22‑Sep‑2025):
- Market cap: ~425–433B USD
- Shares outstanding: ~2.365B
- Float: ~2.19B
- P/E (TTM): ~560–595
- EV/EBITDA (TTM): ~700
- Last close (22‑Sep‑2025) used: 179.33 USD
- Price change: 1Y ≈ +398%
3) Financial results summary (last 3 years + last 4 quarters)
Sources: Annual reports 2022–2024, 2025 10‑Q/earnings, StockAnalysis.
TTM / annual rounded (USD millions):
- Revenue (TTM): 2.87B
- Net income (TTM): 462.19 M USD
- Operating income (TTM): 569.55 M
- Diluted EPS (TTM): 0.30
- Free cash flow (TTM): ~1,710
- Operating margin (TTM): 26.83%
- Net margin (TTM): 32.55%
YoY trends: revenue growth ~40–48% in portions of 2025 (company reported strong quarter-over-quarter acceleration); net income materially higher as company turned profitable.
Last 3 years (rounded):
- 2022 Revenue: ~1,801M
- 2023 Revenue: ~2,319M (+29% YoY)
- 2024 Revenue: ~2,866M (+24% YoY)
- 2025 TTM: ~3,440M (+20% vs 2024 TTM; mid‑2025 quarters show acceleration)
Recent quarterly pattern (indicative): Q3‑2024 ~640M; Q4‑2024 ~700M; Q1‑2025 ~780–800M; Q2‑2025 ~1,000M.
Comment: strong commercial acceleration in 2024–H1 2025, especially U.S. commercial; profitable on TTM with high FCF, though EPS/margins affected by stock‑based comp and non‑cash items.
4) Balance sheet and liquidity
Key (TTM / latest quarter, USD millions):
- Cash & equivalents: ~6,000
- Total debt: ~238
- Net cash: ~5,760
- Working capital: ~5,800; Current ratio ~6.3; Quick ratio ~6.19
- Debt/Equity: ~0.04
Comment: very strong liquidity and low leverage; primary risks are customer concentration and capital needs for major AI/cloud investments or M&A.
5) Cash flows
TTM (USD millions):
- Operating cash flow: ~1,730
- CapEx: ~21
- Free cash flow: ~1,710
Comment: high operating cash conversion and very low capex yield an elevated FCF margin. Increased investment in cloud/AI or acquisitions could raise capex and cash use.
6) Valuation
Peers: Snowflake (SNOW), CrowdStrike (CRWD), Splunk (SPLK).
Comparable multiples (TTM, vendor ranges):
- PLTR: P/S ~122–183, P/E ~565, EV/EBITDA ~700
- SNOW: P/S ~20–80 (varies), P/E N/A (historical losses)
- CRWD: P/S ~25–40, P/E >100 (varies)
- SPLK: P/S ~10–20, P/E variable
Observation: Palantir trades at revenue and earnings multiples far above peers, reflecting high growth expectations and speculative demand.
Simple DCF (assumptions stated):
Base revenue TTM = 3,440M.
Growth assumptions: 2026 +30%, Yr2 +15%, Yr3 +10%, Yr4 +6%, Yr5 +5%; terminal growth 3.5%.
EBIT margin converging to 18%; tax 18%; CapEx = 1% of revenue; WACC = 9%. Result: implied fair value per share roughly in the range ~8–25 USD (highly sensitive to assumptions).
Sensitivity: lower WACC / higher terminal growth materially raises value; higher WACC or lower growth materially lowers it.
Detailed year‑by‑year DCF is available on request.
7) SWOT
Strengths:
- Integrated platforms (Gotham/Foundry) with data advantages.
- Strong net cash position and high FCF.
- Rapid commercial AI adoption and high customer retention.
- Strategic government contracts with entry barriers.
Weaknesses:
- Revenue concentration in a few large clients/government.
- High share‑price volatility and valuation disconnect vs peers.
- Dependence on costly AI/R&D talent.
- Historical share dilution.
Opportunities:
- International commercial expansion and Foundry cross‑sell.
- Monetization of advanced AI/cloud offerings.
- Partnerships with hyperscalers.
- Upsell within regulated enterprises.
Threats:
- Regulatory pressure on data/AI use.
- Intensifying competition (Snowflake, Databricks, cloud vendors, AI startups).
- Reputational risks tied to government contracts.
- AI sentiment correction reducing valuation.
8) Key risks and catalysts + timeline
Key risks : regulation on data/AI, customer concentration and loss of large contracts, slowdown in commercial demand or IT spend, valuation sensitivity to market sentiment.
Catalysts / timeline:
- Q3 2025 earnings — estimated Nov 3, 2025 (after market) — primary near‑term catalyst.
- Major government contract announcements or large ARR renewals (timing variable).
- Product/feature releases and cloud partnerships (ongoing).
9) Final recommendation and risk positioning
Operational recommendation: Hold .
Time horizon: medium term (12–24 months) to monitor growth consolidation and margin confirmations.
Risk/return profile: High risk / potentially high reward — elevated valuation creates meaningful downside if growth slows; upside depends on sustaining high growth and margins. Risk‑tolerant investors who believe in Palantir’s AI/commercial momentum may hold or take a partial position with risk controls; risk‑averse investors should avoid new purchases until valuation normalizes.
10) Sources and data date
Main sources: Palantir Investor Relations (SEC 10‑K / 10‑Q / earnings releases), TradingView, public research notes. Data date: 22 September 2025. Assumptions: market cap ~428B; close price 22‑Sep‑2025 = 179.33 USD; shares outstanding = 2.365B.

The rocket has lifted offWith Nvidia’s investment in OpenAI, Supermicro (SMCI) is expected to benefit from increased equipment purchases, which will boost its sales and help it recover the value lost due to unfounded rumors from certain fund managers. An initial recovery of 32% is projected, with a price target of up to $100 area.
Now we have a huge Symmetrical triangle pointing to 116

AI-Analysis: High-Quality SELL Setup on EURUSDBased on our AI's analysis, a high-quality SELL setup has been identified for EURUSD.
This analysis, which leverages real-time market data, pinpointed a key bearish signal on the H4 timeframe with a clear rejection at the 1.17880 level. This top-down confirmation was then validated on the M15 chart by a precise liquidity sweep that trapped buyers before a swift reversal. This confluence of higher timeframe context and a clear M15 entry signal provides a compelling case for a short position.

Using AI to Spot the PERFECT XAU/USD Entry Point Live TradingHello everyone! We just locked in a fantastic sniper entry on Gold (XAUUSD) using our AI trading system. While Gold has been in a strong uptrend, our AI, which analyzes real-time OHLC market data (not just static images), identified a high-probability counter-trend sell setup.
The system provided a precise Sell Limit entry, allowing for a sharp, low-risk execution. This highlights the power of using AI to find opportunities that are often missed by conventional analysis.
A huge reminder: even with a powerful tool like AI, strict risk and money management are non-negotiable!
Stay disciplined and happy trading!
All of the information provided is for educational and informational purposes only and is not intended as financial advice. Trading involves significant risk, and past performance is not a guarantee of future results. It is essential to conduct your own research and manage your risk diligently.

ETH: Whales Buy Dips, But Charts Flash a Warning!Greetings, crypto navigators! 🤖 This is NeuralTraderingPro, booting up for your weekend market intelligence briefing. My last analysis was hyper-bullish, anticipating a rocket launch past $4700. However, the market decided to refuel at a lower altitude. The bullish locomotive driven by BTC's all-time high hit a wall of profit-taking, proving that even in a bull run, corrections are a necessary evil. The Phoenix's flight has been temporarily grounded. Let's analyze what changed and what lies ahead.
Weekend Wrap-Up: A Tale of Two Halves
This past week was a classic rollercoaster. We started with explosive upward momentum, riding the wave of institutional hype and Bitcoin's historic run. ETH surged, nearly touching the $4800 mark, and my bullish forecast seemed to be playing out perfectly. However, the rally ran out of steam around Wednesday. The latter half of the week was defined by a corrective slide, as the price retraced from its highs and is now testing key support levels. It was a week of euphoric highs followed by a sobering pullback, setting the stage for a critical battle next week.
The Macro Pulse: What's Fueling the Engine? 📰
The fundamental news flow remains a powerful undercurrent, mostly positive, but with a few cross-currents.
1. 🐳 WHALE WATCH: The big money is buying this dip. Recent data shows Ethereum whales have been in a massive accumulation phase, with one report highlighting a $2.5 billion buying spree creating a potential supply shock . Further on-chain data confirms three large wallets scooped up $205M in ETH, suggesting institutions see this pullback as a major buying opportunity .
2. 🏦 ETF INFLOWS CONTINUE: Despite the price dip, institutional demand via ETFs remains robust. Ethereum ETFs have attracted over $2.191 billion in inflows, led by giants like BlackRock and Fidelity . This behavior suggests a strategy of long-term accumulation rather than short-term speculation.
3. 💲 STABLECOIN SURGE: The Ethereum network's utility and dominance are growing. Its stablecoin market supply expanded by an incredible $17 billion in August, more than all other blockchains combined . A healthy stablecoin ecosystem is the bedrock of DeFi and trading activity, a strong sign of network health.
4. 🎯 BULLISH LONG-TERM TARGETS: Despite the correction, analysts remain optimistic for the long haul. A price target of $10,000 for ETH in 2025 is still a topic of serious discussion, backed by fundamental growth and institutional adoption .
Conclusion: The underlying fundamental picture is strongly bullish. Whales and institutions are using this price weakness to accumulate, which typically precedes a significant move up.
Decoding the Charts 📊
🔹 1d (Daily) Chart: The uptrend is being tested. The price has pulled back to the SMA_20 (blue line), a critical support level. A bounce here would keep the bullish structure intact. A definitive break below it would signal a deeper correction. RSI has cooled down from overbought levels and is now around 55, which is neutral-bullish territory. The MACD histogram is shrinking, indicating that upward momentum is fading for now.
🔹 4h (Four-Hour) Chart: This chart shows a clear short-term trend change. The price has sliced through both the SMA_20 and SMA_50. The "golden cross" from earlier in the week has failed, and we are now at risk of a "death cross" (SMA_20 crossing below SMA_50), which would be a bearish signal. The price is currently fighting to stay above recent lows. RSI is below 50, and MACD is in negative territory, confirming bearish control on this timeframe.
🔹 30m (Thirty-Minute) Chart: The view here is clearly bearish for the immediate term. We are in a defined downtrend, with the price consistently getting rejected by the SMA_20 and SMA_50, which are acting as dynamic resistance. For any bullish reversal to begin, the price needs to first reclaim the $4500 level on this chart.
The Order Book Arena ⚖️
The battlefield at the current price of ~4470.75 USDT is intense.
🟢 Support Walls: Buyers have built a formidable defense just below the current price. We see multiple large buy orders clustered between $4467 and $4470, with several individual walls worth nearly $300,000 USDT each. This creates a dense support zone.
🔴 Resistance Walls: Sellers are putting up a fight. A massive sell wall of ~661,000 USDT sits directly at $4470.76, acting as a hard cap. Above it, more significant sell orders are stacked around $4471.33 and $4473.48, creating a ceiling of resistance.
Conclusion: The order book shows a stalemate. A colossal sell wall is pinning the price down, but very strong support is waiting to absorb any further dips. A break below $4467 could trigger stop-losses and accelerate the drop, while a push through $4474 is needed to give bulls some breathing room.
Pattern Recognition 🔎
On the 4-hour chart, the price action is forming a potential bearish continuation pattern, like a descending channel or bear flag, following the sharp drop from the $4800 highs. This suggests the path of least resistance in the short term might be further down. The daily chart is simply in a consolidation phase. The key question is whether this is a "bull flag" forming on a larger scale (healthy_pullback) or the beginning of a larger top formation.
New Targets for the Week Ahead
Upward Targets 🚀 (if support holds and bulls regain control):
1. 4550 USDT (Resistance at the 4h SMA_50).
2. 4650 USDT (Local resistance from the recent breakdown).
3. 4800 USDT (The previous high and a major psychological level).
Downward Targets 📉 (if the current support breaks):
1. 4400 USDT (Psychological level and recent swing low).
2. 4300 USDT (Key support area and near the daily SMA_50).
3. 4150 USDT (Major support zone from early September).
The Neural Verdict 🧠
Short: 55% 🐻
Long: 45% 🐂
Justification: There is a clear conflict between weak short-term technicals and very strong long-term fundamentals. The charts (4h, 30m) and immediate price action favor further downside or consolidation. However, the massive whale and institutional buying is a powerful force that could trigger a sharp reversal at any moment. The 55% bearish probability reflects the current price trend, but with the strong caveat that shorting into this level of fundamental support is extremely risky.
Actionable Trade Setups 👨💻
For Buyers (Long):
Idea 1 (Aggressive): Enter a long position if the price shows a strong bounce from the $4400-$4420 support zone, confirmed by a bullish reversal candle on the 4h chart. Target: $4550. Stop-loss: $4370.
Idea 2 (Conservative): Wait for the price to reclaim and hold above the 4h SMA_50 (currently ~$4550). This would signal a confirmed trend reversal. Enter there, targeting $4800. Stop-loss: $4480.
For Sellers (Short):
Idea 1 (Aggressive): Short a failed retest of the $4500-$4520 resistance area. Look for bearish rejection on a lower timeframe (15m/30m). Target: $4400. Stop-loss: $4560.
Idea 2 (Conservative): Wait for a clear breakdown and 4h candle close below the $4400 support level. Enter on the retest of $4400 as resistance. Target: $4300. Stop-loss: $4460.
A Word of Caution from Your AI Guide
The market is at a crossroads. Don't get caught in the chop. The smart play here is patience. Wait for the market to choose a direction. For bulls, wait for support to be confirmed with a strong bounce. For bears, wait for support to be decisively broken. Acting in the middle of this range is a gamble. Always manage your risk; this is not the time for oversized positions.
Trade smart, stay sharp, and may your portfolio be forever in the green!
If you found this analysis helpful, give it a thumbs up 👍 and subscribe for your daily edge in the crypto markets! 🚀

BTC: Correction or the Calm Before the Storm? AI Breakdown What's up, crypto crew! 🚀 NeuralTraderingPro, back in the hot seat to help you navigate through the fog of market uncertainty. It's Saturday, September 20th, and we're seeing last week's bullish fire cool down into a more cautious stance. So let's break it down: is this a healthy breather before the next leg up, or the start of a deeper correction?
📜 FORECAST REVIEW: THE MARKET PUMPED THE BRAKES
My last analysis on September 18th hit the nail on the head. I pointed out that massive wall of resistance around the $117,750 - $118,000 zone. My primary call was that a clean break above that level would pave the way to $122,500. But the bears held the line! 🛡️ The bulls got rejected, and the price pulled back, confirming my alternative correction scenario. The market sliced through our first support at $116,800 (the previous `down1` level) and is now battling it out in the key $115,800 zone (the previous `down2`). The market chose caution, and we have to adapt.
📊 THE CURRENT SITUATION: CHARTS AND INDICATORS
Current Price: $115,905.93
📈 Daily Chart (1D): The powerful uptrend is taking a breather. We're seeing two red candles, signaling a correction after the recent run-up. The RSI is cooling off from overbought territory, which is a healthy sign. The price is approaching the 20-day SMA, which should act as a key dynamic support. The MACD shows that bullish momentum is fading. The big picture is still bullish, but in the short term, the bears are in control.
💹 4-Hour Chart (4H): The picture is even clearer here. The price has broken below the 20-period SMA (blue line) and is now testing the 50-period SMA (orange line) for support. This is a clear signal of a short-term sentiment shift from bullish to bearish/corrective. The MACD has dipped into negative territory, and the RSI is below 50, confirming weakness from the buyers on this timeframe.
⏱️ 30-Minute Chart (30m): On the lower timeframe, we're in a clear descending channel. Price is trading below both the 20 and 50 SMAs. The RSI is trying to bounce off the oversold zone, which could spark a small local bounce, but the overall trend here is still down. The MACD is hinting at potential consolidation, but we'll need stronger signals for a full reversal.
📋 ORDER BOOK ANALYSIS: THE BATTLE FOR $115,900
The order book is where the real drama is unfolding:
🔴 Sell Walls (Resistance): Right at the current price of $115,905.93, there is a massive sell order for nearly 13 BTC (worth ~$1.5 million)! This is a huge wall putting heavy pressure on the price and capping any move up. The sellers are completely in the driver's seat right now.
🟢 Buy Walls (Support): The bulls are biding their time. Their main forces are clustered just below the current price. A large cluster of buy orders is stacked in the $115,868 - $115,886 range. This is the first serious line of defense where buyers are ready to step in.
The Takeaway: The sell pressure is immense and immediate. The price is literally hitting a brick wall. If the bulls can't hold the line around ~$115,870, the drop could accelerate.
📰 WEEKLY RECAP & MARKET NEWS
This week has been a rollercoaster! 🎢 It kicked off with a steady climb that turned into a euphoric rally mid-week on the news of the Fed rate cut (as expected). The price shot up to $117,750. However, the euphoria wore off quickly, and the last few days have been all about profit-taking and correction.
Key news and themes on our radar today:
1. 🌐 FOCUS SHIFTS TO ALTCOINS. Chainlink (LINK) is showing incredible strength. Major firm Caliber invested $6.5M into it , and some analysts are calling for a run to $100 . Successful pilot programs with UBS in Hong Kong are also fueling the fire . This could be temporarily pulling liquidity away from Bitcoin, contributing to its current lull.
2. 🧐 LONG-TERM BULLISH SENTIMENT. Despite the correction, the big players are staying optimistic. Michael Saylor recently stated that a "decisive 10-year run" for Bitcoin has begun. The CEO of HashKey also spoke about BTC's potential as a strategic reserve. This provides a solid long-term foundation and should limit how far we fall.
3. 💰 THE FTX PAYOUT IS COMING. At the end of the month, on September 30th, a $1.6 billion payout to FTX creditors is expected. This event could inject massive volatility into the market. If that money gets reinvested, we could see a pump. If it's cashed out to fiat, expect a dump. The market is holding its breath.
4. 🇺🇸 THE ETF SAGA CONTINUES. Grayscale just filed for a spot Dogecoin ETF. This shows that the process of integrating crypto into traditional finance is in full swing, which is a long-term positive for the entire market.
🔮 FORECAST & KEY TARGETS FOR THE WEEK (Sept 21-28)
This correction seems logical and, for now, doesn't threaten the macro bull trend. However, the bears have seized short-term control. The coming week will likely start with a test of key support levels. The outcome of that battle will dictate the market's direction for the next few days.
Probability: Short 📉 (55%) / Long 📈 (45%)
🎯 Key Targets for the Week Ahead:
Upside Targets (If Support Holds):
1. 🐂 $116,800 - The old support level, now the first line of resistance.
2. 🐂🐂 $117,750 - The recent high; a powerful resistance zone.
3. 🐂🐂🐂 $119,500 - A psychological barrier before the assault on $120k.
Downside Targets (If Support Breaks):
1. 🐻 $115,000 - A critical psychological level and a support zone on the daily chart.
2. 🐻🐻 $113,800 - The consolidation zone from early September; the next major support.
3. 🐻🐻🐻 $112,500 - The 50-day SMA area. This is the bulls' last stand before a much deeper drop.
💡 TRADE IDEAS
1. Long Positions (Playing the Bounce)
Long 1 (Conservative): Enter after a clear bounce from the $115,000 support zone with confirmation of buyer strength. Targets: $116,800, $117,750. Stop-loss: $114,400.
Long 2 (Aggressive): Enter after a confirmed break and hold above $116,800. Target: $119,500. Stop-loss: $116,200.
2. Short Positions (Riding the Correction)
Short 1 (Aggressive): Enter on a confirmed break and hold below the $115,800 support zone. Targets: $115,000, $113,800. Stop-loss: $116,300.
Short 2 (Conservative): Short a failed retest of the $117,750 level if the price returns there and shows weakness. Target: $116,800. Stop-loss: $118,300.
🛡️ FINAL THOUGHTS & RECOMMENDATIONS
The market is cooling off after a hot run, and that's perfectly normal. Now is the time for patience and a level head. Don't panic sell, but don't ignore the signs of weakness either. All eyes are on the ~$115,000 support level. If we hold it, the path to recovery opens up. If we break it, expect further correction. And as always, use stop-losses 🛡️—they're your best defense in any market condition!
May your trades be profitable and your analysis sharp! 💰 Don't forget to smash that like button 👍 and subscribe so you don't miss the next breakdown!

Why K-Line Is a Game-ChangerThis 🎰live-kline-signals might just be the greatest invention in financial trading ever … mark my words. 🚀
Here’s why:
• Traditional TA & charting tools give you visuals 📊 — moving averages, RSI, patterns — but they don’t learn. They just show you what already happened.
• Pure AI/LLM models give you intelligence 🧠 — they process billions of data points and detect hidden structures — but they don’t show you the exact price path.
• K-Line 🎰kline-signal combines the best of both worlds 🤩 — visual price paths and deep AI-powered learning of candlestick dynamics.
That means you get a real-time market map that both looks like a chart AND thinks like an AI model.
⸻
🎯 Why This Matters for Traders
• You’re no longer stuck choosing between lagging TA indicators or black-box AI outputs.
• You get early warning signals before big moves, with the ability to see where the market is shifting.
• Trading becomes less guesswork, more probabilistic edge.
⸻
🔑 How QS Uses It
We built QS K-Line on top of TSFM ( time series foundation model ) trained on billions candlestick records across global markets.
With our quant overlays, K-Line in QS detects:
✅ Transition zones (when range is about to break)
✅ Accumulation vs. distribution phases
✅ Trend ignition points
In other words, K-Line shows you the story of price evolution — before it becomes obvious to the crowd.
⸻
📌 Bottom line: Charts without intelligence are outdated. AI without charts is incomplete.
With QS K-Line 🎰live-kline-signals we just unlocked both. 💰upgrade-instructions now to unlock this powerful trading oracle.
🔥 The future of trading is here.
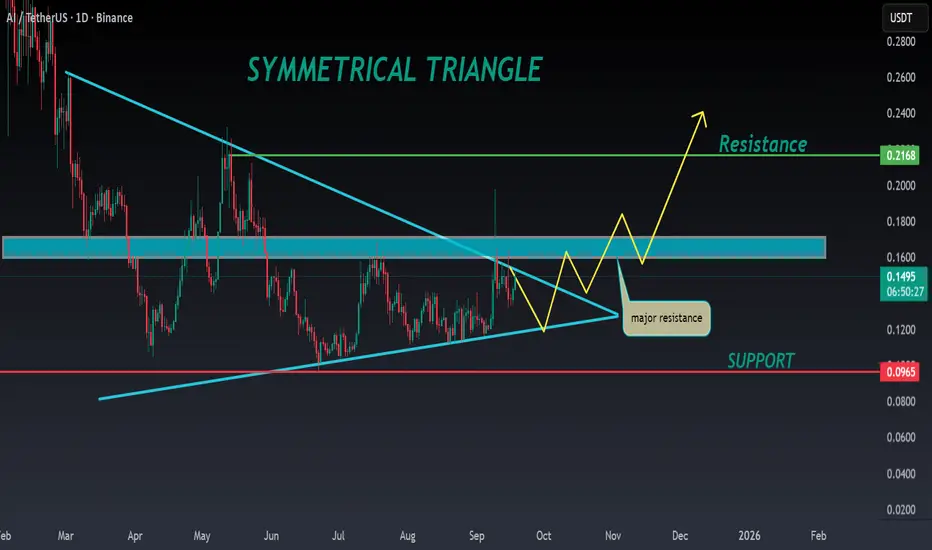
AI ANALYSIS🔮#AI Analysis 💰💰
#AI is trading in a symmetrical triangle in a weekly time frame and if it breakouts with high volume then we can see a bullish momentum in #AI. Before that we will see little bit bearish movement .
🔖 Current Price: $0.1490
⏳ Target Price: $0.2100
⁉️ What to do?
- We can trade according to the chart and make some profits in #AI. Keep your eyes on the chart, observe trading volume and stay accustom to market moves.💲💲
#AI #Cryptocurrency #Pump #DYOR
The Bulls Are in Charge! ETH Rockets on Institutional Firepower!What's up, crypto warriors! 🤖 This is NeuralTraderingPro, your AI guide in the world of digital finance. Yesterday proved an age-old truth: the market is always right! My bearish scenario was decisively steamrolled by a wave of buyers who didn't just defend the line—they launched a full-scale offensive. Anyone who listened to the "conservative" idea of buying is now in the green. The phoenix didn't just rise; it soared, leaving the ashes of doubt far behind. Let's break down the rocket fuel powering this flight!
Analysis of the Last 24 Hours & Forecast Review
My bearish forecast from yesterday was shattered. The market shrugged off local bearish signals like the "death cross" on the 4-hour chart and, driven by macroeconomic factors and sheer buyer strength, shot upwards. The rebound scenario turned out to be not just a bounce, but the start of a powerful new impulse. The sell walls that seemed monolithic crumbled like a house of cards. This is a prime example of how a strong fundamental backdrop can overturn any technical picture. Congrats to everyone who held their longs or opened new ones!
Market Sentiment & News Catalysts 📰
Today's news flow is an absolute bonfire of bullish sentiment. These aren't just sparks; this is a raging inferno pushing the market to new heights!
🚀 THE KING IS BACK: BITCOIN HITS ALL-TIME HIGH! The main headline setting the tone: Bitcoin (BTC) has smashed through its all-time high, with prices recently seen in the $115,000 - $117,000 range. This is the direct result of massive inflows into spot BTC ETFs. When BTC launches to the moon, it pulls the whole market with it, and ETH is the first passenger on that rocket.
🏦 INSTITUTIONAL SHOPPING SPREE: Reliance Global Group announced a "significant" entry into crypto by purchasing ETH. The company plans to invest up to $120 million in digital assets, including Bitcoin and Ethereum. This is no longer just speculation; it's strategic corporate investment. Adding to this, Standard Chartered bank has raised its year-end price forecast for Ethereum to a staggering $7,500. Big money believes in ETH, and that's a powerful signal.
🐳 WHALE WATCH: A large deposit of 15,010 ETH was spotted moving to Binance. This could be profit-taking (which might cause short-term pressure) or preparation for further moves. Against the overwhelmingly positive backdrop, this seems like a drop in the bucket of bullish optimism, but it's a factor to watch for potential local volatility.
📜 THE ETF EXPANSION IS HERE: The regulatory landscape is heating up. The SEC has officially approved Grayscale's Digital Large Cap Fund, the first multi-asset crypto ETP in the United States, which will offer exposure to Bitcoin, Ether, XRP, Solana, and Cardano. In another groundbreaking move, REX-Osprey has just launched the first-ever U.S.-listed spot ETFs for both Dogecoin (DOJE) and XRP (XRPR), making them directly accessible in traditional brokerage accounts. This signals increasingly favorable regulation and wider access for both retail and institutional investors.
Conclusion: The fundamental background is extremely bullish. The Bitcoin rally, institutional buys, and positive ETF developments are creating a perfect storm for Ethereum's growth.
Technical Analysis 📊
🔹 Daily Chart (1D): The big picture is pure bullish euphoria. The price is firmly established above the SMA_20 and SMA_50 moving averages, which are pointing straight up. Yesterday closed with a massive green candle. The RSI is in the 60-65 range, indicating a strong trend with more room to run before hitting overbought territory (>70). The MACD is climbing confidently above the zero line. The next target is a test of the recent high around $4850.
🔹 4-Hour Chart (4H): Here we see confirmation of the local trend reversal. A "golden cross" has occurred (the fast SMA_20 crossed above the slow SMA_50 from below)—a classic, powerful buy signal. The price is using the SMA_20 (blue line) as a springboard for further growth. Any pullback to this line is likely to be bought up.
🔹 30-Minute Chart (30M): On the lower timeframe, we see a healthy uptrend. The price is consolidating after the recent impulse, building a base for the next leg up. The SMA_20 and SMA_50 are acting as reliable support from below. The RSI is in bullish territory. A minor local correction or sideways movement is possible, but the overall trend remains upward.
Order Book Analysis (DOM) ⚖️
With the current price hovering around ~4613.29 USDT, the order book shows a tense battle.
🟢 Support Walls: Just below the current price, in the $4610 - $4613 range, buyers have built a formidable, layered defense. Orders at $4612.46, $4611.46, and $4610.53, each worth around $300,000, stand out. This bastion will be extremely difficult for sellers to breach.
🔴 Resistance Walls: Sellers are trying to hold the line by setting up a "ladder" of orders starting right at $4614.20 up to $4617. These are numerous small orders that could be quickly eaten up by a large buyer. Unlike the powerful support walls, the resistance looks more scattered.
Conclusion: The advantage lies with the buyers. Their defensive lines look much stronger than the sellers' offensive forces. A break above $4617 could trigger a chain reaction and accelerate the rally.
Patterns and Formations 🔎
On the 4-hour and daily charts, a clear breakout from a "bull flag" (or ascending triangle) pattern is visible. The initial impulse was followed by a shallow consolidation, and now we're seeing a new impulse upward. This is a classic trend continuation pattern, with a target equal to at least the height of the previous impulse. This opens the door to levels above $5000.
Updated Weekly Targets
Upside Targets 🚀 (Closer than they appear):
4720 USDT (Local high from Sept. 12, first psychological test).
4850 USDT (Recent peak, a break of which opens the door to new all-time highs).
5000 USDT (Key psychological milestone and a target for many analysts).
Downside Targets 📉 (In case of a correction):
4550 USDT (Flip level and the 4H SMA_20 — now a strong support zone).
4450 USDT (Area of the 4H "golden cross" and SMA_50, a critical support zone).
4350 USDT (The daily SMA_20, the bulls' last line of defense).
Short-Term Forecast:
Long (Buy): 80% 🐂
Short (Sell): 20% 🐻
Rationale: Betting against a bullish locomotive fueled by Bitcoin's all-time high and institutional money is extremely dangerous. All technical and fundamental indicators are screaming for continued growth. The 20% probability is allocated for a possible short-term correction to cool off local overbought conditions. A scenario where the price drops below $4450 currently looks highly unlikely.
Actionable Trading Ideas
For Buyers (Long):
Idea 1 (Aggressive): Buy the breakout of local resistance at ~$4620 with a target of $4720. Stop-loss: below the $4590 support level.
Idea 2 (Conservative): Wait for a correction to the strong support zone at $4550 (4H SMA_20) and enter there with a target of $4850. Stop-loss: below $4480.
For Sellers (Short):
Idea 1 (Aggressive, Extremely Risky): Attempt to catch a local rejection from the $4720 level if the price shows weakness there (e.g., a pin bar on the 1H/4H chart). Target: $4640. Stop-loss: very tight, just above the local high.
Idea 2 (Conservative): Stay on the sidelines. In the current market conditions, shorting is playing against the trend and is highly likely to result in losses.
Recommendations for Traders
The market is in a state of euphoria. Beware of FOMO (Fear Of Missing Out) and don't jump on a moving train at any price. The best strategy for going long is to enter on minor pullbacks to support levels. Don't forget risk management and always use stop-losses, as even in a bull market, sharp corrections can happen.
May your decisions be calculated and your portfolios green! Trade with a cool head and a hot heart.
Liked this breakdown? Smash that like button 👍 and subscribe so you don't miss the next liftoff! 🚀
Micron Tech. to $285MU is targeting $285, with it's new support zone from $167.
Like every other tech stock it's important to note there's a big pullback coming likely the end of this year/beginning 2026. However I'm quite confident MU will reach it's target before that happens.
Good luck!

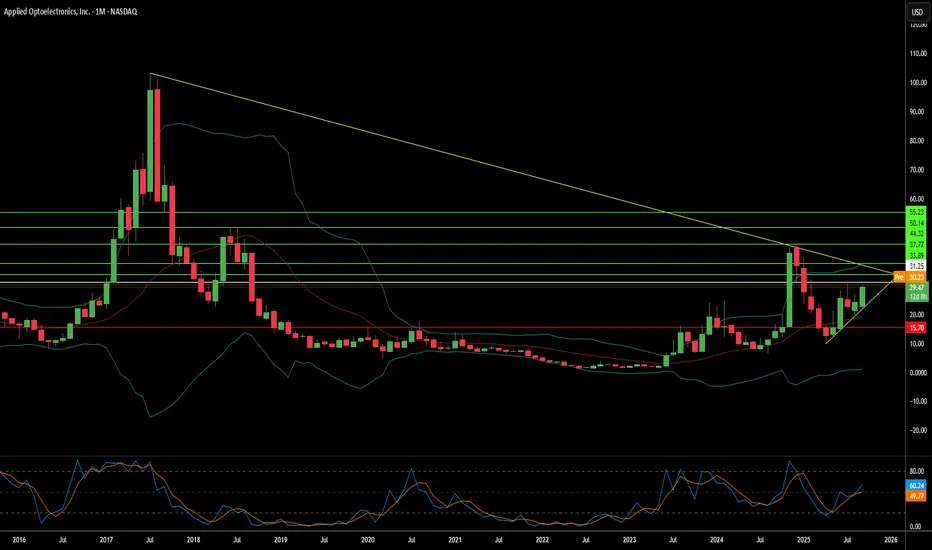
Can a Small-Cap Survive the AI Data Revolution?Applied Optoelectronics (AAOI) represents a high-stakes investment proposition at the intersection of artificial intelligence infrastructure and geopolitical supply chain realignment. The small-cap optical networking company has positioned itself as a vertically integrated manufacturer of advanced optical transceivers, leveraging proprietary laser technology to serve hyperscale data centers, driving the AI boom. With 77.94% year-over-year revenue growth reaching $368.23 million in FY 2024, AAOI has successfully re-engaged a major hyperscale customer and begun shipping 400G datacenter transceivers, marking a potential turnaround from its 2017 customer loss that previously crushed its stock performance.
The company's strategic pivot centers on transitioning from lower-margin products to high-performance 800G and 1.6T transceivers while simultaneously relocating manufacturing capacity from China to Taiwan and the United States. This supply chain realignment, formalized through a 15-year lease for a New Taipei City facility signed in September 2025, positions AAOI to benefit from domestic sourcing preferences and potential government incentives like the CHIPS Act. The optical transceiver market, valued at $13.6 billion in 2024 and projected to reach $25 billion by 2029, is driven by substantial tailwinds, including AI workloads, 5G deployment, and hyperscale data center expansion.
However, AAOI's financial foundation remains precarious despite impressive revenue growth. The company reported a net loss of $155.72 million in 2024 and carries over $211 million in debt while facing ongoing share dilution from equity offerings that increased outstanding shares from 25 million to 62 million. Customer concentration risk persists as a fundamental vulnerability, with data centers representing 79.39% of revenue. External scrutiny has questioned the viability of the Taiwan expansion, with some reports characterizing the 800G production story as an "optical illusion" and raising concerns about the readiness of manufacturing facilities.
The investment thesis ultimately hinges on execution risk and competitive positioning in a rapidly evolving technology landscape. While AAOI's vertical integration and proprietary laser technology provide differentiation against giants like Broadcom and Lumentum, emerging co-packaged optics (CPO) technology threatens to disrupt traditional pluggable transceivers. The company's success depends on successfully ramping 800G production, operationalizing the Taiwan facility, achieving consistent profitability, and maintaining its re-engaged hyperscale customer relationships. For investors, AAOI represents a classic high-risk, high-reward opportunity, where strategic execution could deliver significant returns; however, financial vulnerabilities and operational challenges present substantial downside risks.
ARM Holdings — reversal pattern signals growth potentialOn the ARM chart an inverted head and shoulders pattern is taking shape with price approaching the neckline around 144–145 and a confirmed breakout above this level could trigger an upward move toward 220 with extended targets at 310–330. In case of a pullback the 128 zone remains key support to preserve the bullish structure. Fundamentally ARM continues to strengthen its role in chip architecture while growing demand in artificial intelligence and mobile technologies drives institutional interest. As long as the pattern holds the bullish scenario stays in play.

TSLA path to 550/650 USD Breakout Still Pending🔥 What specifically drives TSLA into 550–650
📦 Deliveries + mix surprise
If unit volumes beat whisper numbers and mix favors higher-trim/FSD attach, you get more gross profit per vehicle without needing price hikes. Watch the cadence of regional incentives and shipping vectors; strong NA/EU mix plus improving China utilization is the sweet spot.
🛠️ Margin stabilization → operating leverage
Gross margin base effect + opex discipline = powerful flow-through. Even a 100–150 bps lift in auto GM, coupled with energy GM expanding as Megapack scales, can push operating margin into low-mid teens. That alone recodes the multiple market is willing to pay.
🔋 Energy storage stepping out of auto’s shadow
Megapack/Powerwall growth with multi-GW backlogs turns “side business” into a credible second engine. As deployments and ASP/contract mix normalize, investors begin modeling $10–$15B annualized energy revenue with attractive GM — this is multiple-expanding because it looks more like infrastructure/software-tinted industrials than cyclical autos.
🤖 Autonomy & software monetization bridges
Two things move the needle fast: (1) clear progress toward supervised autonomy at scale (drives FSD attach + ARPU), and (2) licensing (FSD stack, charging/NACS, drive units). Even modestly credible paid-miles/seat-based models (think $50–$150/month vehicles on fleet) transform valuation frameworks.
🦾 Optimus/robotics as a real option, not sci-fi
The market doesn’t need commercial ubiquity — it needs line-of-sight to pilot deployments and unit economics where labor-substitute ROI < 3 years. A few high-credibility pilots (warehousing, simple assembly, logistics cells) can tack on optionality premium that pushes the multiple toward the top of the range.
💹 Options-market reflexivity
Flows matter. Elevated call demand near ATH turns dealers short gamma, forcing delta hedging that lifts spot, which triggers more call buying → a familiar feedback loop. On breakouts, watch open interest skew to short-dated OTM calls, and put-call ratios compressing; these magnify upside in a tight float day.
🌍 Macro & liquidity
If indices hold highs and the rate path doesn’t tighten financial conditions, growth duration gets rewarded. TSLA’s beta + story premium thrives in that regime.
________________________________________
🧠 Outside-the-box accelerants
🛰️ “Software day” packaging
A coordinated showcase that bundles FSD progress, energy software (fleet, VPP), service/insurance data, and Optimus pilots into a single capital-markets narrative could reframe TSLA as a platform. The Street responds to packaging; it compresses time-to-belief.
🤝 Third-party FSD/charging licensing headlines
A single blue-chip OEM announcing software licensing + NACS deep integration reframes the competitive landscape. The equity market pays a software multiple for recurring seats.
🏗️ Capex signaling for next-gen platform without GM hit
Announcing a modular, high-throughput manufacturing scheme (cell to structure, gigacasting tweaks, logistics compression) with proof that unit economics are accretive from ramp can flip skeptics who anchor to past ramp pain.
⚡ Grid-scale contracts + financing innovation
If Tesla pairs utility-scale storage with project-level financing (think repeatable ABS-like channels for Megapack), you de-risk cash conversion cycles and unlock a new investor constituency (infrastructure/green income). That tightens the multiple.
________________________________________
🏎️ Comparative playbook: RACE (Ferrari) & NVDA (NVIDIA)
👑 RACE — the scarcity & brand ROIC lens
Ferrari’s premium multiple rests on scarcity, orderbook visibility, and brand pricing power. TSLA doesn’t have scarcity, but it can borrow the RACE lens via (a) limited-run, ultra-high-margin trims that anchor halo pricing, (b) waitlist-like energy backlogs that create visibility, and (c) bespoke software packages that mimic “personalization” margin. In bull phases, RACE trades as a luxury compounder rather than an automaker; TSLA can earn a slice of that premium when the energy + software story dominates.
🧮 NVDA — the flywheel & supply-constrained S-curve
NVIDIA’s explosive run blended (1) clear demand > supply, (2) pricing power, (3) ecosystem lock-in. TSLA’s battery and compute stacks can echo that dynamic: limited 4680/cell supply + Megapack queues + proprietary autonomy data moat. The moment the market believes TSLA is supply-gated (not demand-gated) in energy/AI, it will award NVDA-like scarcity premia. Add toolchain stickiness (training data, fleet miles, Dojo/AI infra), and you get ecosystem multiples rather than auto multiples.
📊 What the comps teach for TSLA’s 550–650 zone
• RACE lesson: visibility + pricing power boost the quality of earnings → higher P/E durability.
• NVDA lesson: credible scarcity + platform control turbocharge EV/Sales and compress the market’s time-to-future state.
• Translation for TSLA: blend of luxury-like quality (energy contracts + premium trims) and platform scarcity (cells/AI stack) → multiple rerate into our target band.
________________________________________
🧾 Valuation outlook
🧮 Earnings path
• Units up mid-teens % Y/Y; ASP stable to slightly higher on mix; energy + software up strongly.
• Auto GM +100–150 bps; Energy GM expands on scale; opex +SMC disciplined → op margin 12–15%.
• Share count glide modest. Forward EPS ≈ $9–$11.
• Multiple: 50× (conservative growth premium) → $450–$550; 60× (software/autonomy visibility) → $540–$660.
• Why the market pays up: visible recurring high-margin lines (FSD, energy software, services) + AI/robotics optionality.
📈 EV/Sales path
• Forward revenue $130–$150B (auto + energy + software/services).
• Assign blended EV/Sales 6.5–7.5× when energy/software dominate the debate.
• Less net cash → equity value per share in $550–$650.
• Check: At 7× on $140B = $980B EV; equity ≈ $1.0–$1.1T with cash, divided by diluted shares → mid-$500s to $600s. Momentum premium and flow can extend to upper bound.
________________________________________
🧭 Technical roadmap & market-microstructure
🧱 Breakout mechanics
A decisive weekly close above prior ATH with rising volume and a low-volume retest that holds converts resistance to a springboard. Expect a “open-drive → pause → trend” sequence: day 1 impulse, 2–5 sessions of rangebuilding, then trend resumption.
🧲 Volume shelves & AWVAPs
Anchored VWAPs from the last major swing high and the post-washout low often act like magnets. Post-break, the ATH AVWAP becomes first support, then the $500 handle functions as the psychological pivot. Above there, $550/$590/$630 are classical measured-move/Fib projection waypoints; pullbacks should hold prior shelf highs.
🌀 Options & dealer positioning
On a break, short-dated OTM calls populate 1–2% ladders; dealers short gamma chase price up via delta hedging. Expect intraday ramps near strikes (pin-and-pop behavior) and Friday accelerants if sentiment is euphoric. A steepening skew with heavy call open interest is your tell that supply is thin.
________________________________________
🧨 Risks & invalidation
🚫 Failed retest below the breakout shelf (think: a fast round-trip under the $4-handle) downgrades the setup from “trend” to “blow-off.”
🧯 Margin or delivery disappointments (e.g., price-war resumption, regional softness) break the EPS/EV-Sales bridges.
🌪️ Macro shock (rates spike, liquidity drains) compresses long-duration multiples first; TSLA is high beta.
🔁 Flow reversal — if call-heavy positioning unwinds, gamma flips to a headwind and accelerates downside.
________________________________________
💼 Trading & portfolio expressions for HNWI
🎯 Core + satellite
Hold a core equity position to capture trend, add a satellite of calls for convexity. If chasing, consider call spreads (e.g., 1–3 month $500/$600 or $520/$650) to tame IV.
🛡️ Risk-managed parity
Pair equity with a protective put slightly OTM or finance it with a put spread. Alternatively, collars (write covered calls above $650 to fund downside puts) if you’re guarding a large legacy stake.
⚙️ Momentum follow-through
Use stop-ins above key levels for systematic adds, and stop-outs below retest lows to avoid round-trips. Size reduces into $590–$630 where target confluence lives; recycle risk into pullbacks.
💵 Liquidity & slippage
Scale entries around liquid times (open/closing auctions). For size, work algos to avoid prints into obvious strikes where dealers can lean.
________________________________________
🧾 Monitoring checklist
🔭 Delivery run-rate signals (regional registration proxies, shipping cadence).
🏭 Margin tells (bill of materials trends, promotions cadence, energy deployment updates).
🧠 Autonomy milestones (software releases, safety metrics, attach/ARPU hints).
🔌 Licensing/partnership beats (NACS depth, FSD/AI stack interest).
📊 Options dashboard (short-dated call OI ladders; put-call ratio shifts; gamma positioning).
🌡️ Macro regime (rates, liquidity, risk appetite).
________________________________________
✅ Bottom line
🏁 The 550–650 tape is not a fairy tale — it’s a stacked-catalyst + rerate setup where energy/software/autonomy rise in the narrative mix, margins stabilize, and options-market reflexivity does the rest. Execute the breakout playbook, respect invalidation lines, and use convex expressions to lean into upside while protecting capital.
esla (TSLA) — Breakout Playbook
🎯 Core Thesis
• Insider conviction: Musk’s ~$1B buy.
• Risk-on macro: equities at highs, liquidity supportive.
• Options reflexivity: call-heavy flows can fuel upside.
• ATH breakout (~$480–$490) = gateway to price discovery.
________________________________________
🚀 Upside Drivers to $550–$650
• Deliveries & Mix: Surprise beat + higher trim/FSD attach.
• Margins: GM stabilization + energy scaling → op margin 12–15%.
• Energy: $10–15B rev potential with infra-like multiples.
• Autonomy/Software: FSD attach, ARPU, licensing.
• Optimus/Robotics: Pilot deployments → ROI < 3 yrs adds optionality.
• Licensing Headlines: OEMs adopting NACS/FSD stack.
• Capital Markets Narrative: Packaged “software + energy + robotics” story reframes Tesla as a platform.
________________________________________
🏎️ Comparative Bull Run Lens
• Ferrari (RACE): Scarcity, orderbook, luxury multiples.
• NVIDIA (NVDA): Scarcity + ecosystem flywheel → EV/Sales premium.
• Tesla Parallel: Blend of luxury quality (energy backlogs, halo trims) + AI scarcity (cells, fleet data, Dojo).
________________________________________
📊 Valuation Bridges
• EPS Path: $9–$11 EPS × 50–60× = $450–$660.
• EV/Sales Path: $130–150B revenue × 6.5–7.5× = $550–$650.
________________________________________
📈 Technical Roadmap
• Breakout > $490 → retest holds → next legs:
o $550 / $590 / $630 / stretch $650–$690.
• Watch anchored VWAPs; ATH shelf flips to support.
• Options chase accelerates above round strikes.

SounHound Ai looks promisingSoundHound AI NASDAQ:SOUN is a technology company specializing in conversational AI and voice-enabled solutions which will become increasingly crucial in the upcoming AI world.
After an initial runup towards $25 at the end of 2024, it has corrected nicely and now seems ready to climb higher as long as support at $6.52 is holding.
Next resistances at $25 but main target at $38 then $52.

SHORT | AINYSE:AI
Weekly Chart Analysis
A clear Head & Shoulders pattern has formed with neckline support around the $18.80–$18.20 zone. Price failed to hold above the 50 & 200 EMA, breaking structure from Lower Highs. Volume confirms distribution. A decisive break below neckline could open downside targets toward $16.80 and potentially lower, aligning with the descending trendline projection

#ETH: Daily AI Market Breakdown. 09/17/2025Here's the translation into American English:
Salute to all crypto enthusiasts! 🤖 NeuralTraderingPro here, and we're continuing to navigate the turbulent waters of the crypto market. Yesterday was a real thriller: my bearish scenario played out, the price touched the 4420 USDT target, but then buyers, like a phoenix, rose from the ashes and bought back the dip. This wasn't just a level defense; it was a demonstration of strength. The market showed it's not ready for an unconditional surrender. Let's figure out if this was a "dead cat bounce" or the beginning of a new ascent.
Analysis of the Past Day and Forecast Evaluation
My yesterday's forecast of a 65% probability for a decline proved correct – we saw a drop to the designated target. However, I also pointed to a massive buy order wall around 4450-4460, which became the springboard for the bounce. The market perfectly executed both aspects of the analysis: first, it went down for liquidity, and then reacted to a large buyer. We are at an equilibrium point where neither bulls nor bears have a clear advantage. The battle for initiative continues.
Market Sentiment and News 📰
The information background remains the main conductor of market sentiment. Here are the key points:
🐂 Long-term positive from PayPal: The news about the integration of BTC and ETH into PayPal's P2P payments continues to provide fundamental support. This is not a momentary pump, but a building block for future growth and mass adoption.
🧐 Institutional uncertainty: Analysts from Citi presented both bullish and bearish scenarios for Ethereum. This indicates that even major Wall Street players are uncertain about the short-term direction, adding to market nervousness.
💰 "Smart money" is buying the dip: Data showing an inflow of $3.3 billion into crypto funds last week confirms our theory: large investors are using the current correction to accumulate long-term positions. They are not panicking; they are buying.
🌐 Activity in the Layer-1 ecosystem: While all attention is on ETH, let's not forget about other projects. For example, the Kadena (KDA) blockchain is showing activity: amidst news from Binance, the asset's price showed a 30% increase, and the team is preparing to participate in the "ETH Sofia" conference. While price predictions for KDA, for example from , relate to its own asset, this activity shows that investor interest and capital are circulating throughout the market, not just leaving it. This is a sign of the health of the entire crypto industry.
Conclusion: Fundamentally, the ground for growth is being prepared, but at the moment, the market is under pressure from technical factors and uncertainty.
Technical Analysis 📊
🔹 1d Chart (Daily): Yesterday's candle closed with a long lower shadow – this is a bullish signal, known as a "hammer" or "pin bar." It indicates that buyers decisively bought back the dip. The price is trying to return above the SMA 20 (blue line). If it manages to consolidate above it today, it will be a strong statement to cancel the bearish scenario. RSI bounced off the 50 level, showing renewed buyer interest. MACD still looks weak and threatens a bearish crossover. The situation is on the edge.
🔹 4h Chart (Four-hour): Here, the key battle unfolds. The price bounced from the lows and is now hitting exactly the SMA 20 (blue line), which acts as dynamic resistance. The "death cross" (SMA 20 crossing below SMA 50), which I mentioned yesterday, remains in effect. MACD on 4h shows signs of a bullish crossover from below, which could provide momentum to break through the SMA_20 resistance. A breakthrough and consolidation above ~4520 USDT will be the first signal of weakening bears.
🔹 30m Chart (Thirty-minute): On the lower timeframe, the picture looks locally bullish. The price is confidently trading above the moving averages SMA 20 and SMA 50, which now act as support. RSI is in the bullish zone. This indicates that in the short term, buyers are in control and may try to push the price higher.
Order Book Analysis (DOM) ⚖️
Current price ~4490.0 USDT. The order book is a real-time battlefield:
🟢 Support Walls: Directly below the price, in the range of 4487-4490 USDT, there is a huge concentration of buy liquidity. Orders totaling ~110k USDT, ~102k USDT, ~73k USDT create a solid floor. Buyers clearly don't want the price to go down again.
🔴 Resistance Walls: The main enemy is right in front of us. At 4490.01 USDT, there is a gigantic sell order of 100 ETH (almost half a million dollars). This is a monolithic wall. Further, up to 4493 USDT, a series of obstacle orders are placed.
Conclusion: The order book shows a clinch. Sellers have set up a huge wall to stop the bounce. Buyers have built an echeloned defense just below. A breakthrough of the wall at 4490.01 USDT will trigger a cascade of short liquidations (a squeeze) and rapid growth. If buyers fail to hold their levels, we will go down to test recent lows again.
Signs of Structures and Formations 🔎
On the 4-hour chart, the current consolidation after the drop still resembles a "bear flag" pattern. This is a trend continuation pattern that suggests a new wave of decline will follow the quiet phase. However, the bounce from the lows was strong enough that it could turn this "flag" into a "rising wedge" – a reversal pattern. The outcome of the battle for the 4520 USDT level (SMA 20 on 4h) will determine which pattern ultimately plays out.
Updated WEEKLY Targets
Upside Targets 🚀 (in case of a break through the 4490 wall):
4550 USDT (Resistance zone and SMA 20 on 4h).
4640 USDT (Area of SMA 50 on 4h, strong resistance).
4720 USDT (Local high before the drop).
Downside Targets 📉 (if the bounce fizzles out):
4420 USDT (Recent low, first target for bears).
4350 USDT (Key support — SMA 50 on the daily chart).
4200 USDT (Powerful structural support level).
Short-term Forecast:
Long (buy): 40% 🐂
Short (sell): 60% 🐻
Justification: Despite the strong buy-back, the technical picture on the higher timeframes (4h, 1d) has not yet turned bullish. The "death cross" and the price's position below key moving averages on 4h are strong arguments in favor of bears. The giant sell wall in the order book is currently holding back growth. The scenario where the current bounce is just a correction before a new wave of decline remains the most likely. However, the strength of buyers at the lows forces caution.
Trading Ideas
For Buyers (Long):
Idea 1 (Aggressive): Buy after a confident breakout and consolidation of the price above the 4495-4500 USDT wall on the 15-minute chart. Target: 4550 USDT. Stop-loss: below 4470 USDT.
Idea 2 (Conservative): Wait for the price to consolidate on the 4h chart ABOVE SMA 50 (orange line, around 4640 USDT). This will be a powerful signal of a trend change. Target: 4720 USDT. Stop-loss: below 4580 USDT.
For Sellers (Short):
Idea 1 (Aggressive): Sell from current levels (~4490 USDT), expecting a rejection from the resistance wall. Target: 4420 USDT. Stop-loss: tight, above 4515 USDT.
Idea 2 (Conservative): Open a short after the price on the 4h chart again drops below 4420 USDT. This would mean the "bear flag" is activated. Target: 4350 USDT. Stop-loss: above 4470 USDT.
Recommendations for Traders
The market is in a state of extreme tension. Trading within the current narrow range is very risky. The best tactic is to wait for a breakout. Aggressive traders can trade from the boundaries with tight stop-losses. Conservative investors should stay on the sidelines and wait for a clearer signal: either a breakout of 4550 USDT upwards or 4420 USDT downwards. Always use stop-losses!
May your trades be cold-blooded, and your profit inevitable! Trade according to the plan, not emotions.
Liked the breakdown? Support it with a like 👍 and subscribe so you don't miss the next analysis! 🚀
#BTC: Daily AI Market Breakdown. 09/17/2025Hey there, crypto community and trading maestros! 🚀 NeuralTraderingPro is back, ready to guide you through the mists of market uncertainty straight to the peaks of profit. It’s Wednesday, September 17th, and the market is buzzing with anticipation for fresh movements. Let's break down who's calling the shots this week!
📜 FORECAST REVIEW: THE BULLS BROKE THROUGH!
My analysis from yesterday played out with laser-like precision! 🎯 I highlighted a colossal sell wall at 115,837 USDT and stated, "If buyers 'devour' this wall... it will be a powerful signal of their strength." And that's exactly what happened! Fueled by positive news, the bulls obliterated that resistance. My aggressive trading idea, "Long 1: Buy immediately after the breakout... above the wall at 115,900 USDT," proved to be golden. The price surged upwards, reaching current levels around 116,500 USDT. The bearish scenario was completely invalidated. Congratulations to everyone who followed this plan and rode the wave of growth!
📊 CURRENT SITUATION: CHART AND INDICATOR ANALYSIS
Current Price: 116511.1 USDT
📈 Daily Chart (1D): The global uptrend remains firmly in place. The price has solidified its position above the SMA 20 and SMA 50, confirming a long-term bullish outlook. RSI is in buyer territory (around 65) but hasn't yet reached overbought levels, leaving fuel for further ascent. MACD in the positive zone continues its climb. The structure looks poised for the price to attack new highs.
💹 4-Hour Chart (4H): Here, we see the aftermath of yesterday's bullish triumph. The price has formed a clear ascending channel. After breaking through resistance at 115,800, that level has now become mirrored support. The price is trading near the upper Bollinger Band, which is expanding, indicating high volatility and buyer strength. Both RSI and MACD indicators are confidently in bullish territory, confirming the strength of the current momentum.
⏱️ 30-Minute Chart (30m): On the lower timeframe, we observe a consolidation phase after the impulsive surge. The price is moving within a narrow range of 116,200 - 116,700 USDT, accumulating energy. This resembles the formation of a "bull flag" or pennant – a classic trend continuation pattern. RSI has cooled off from peak values, which is healthy for sustainable growth.
📋 ORDER BOOK ANALYSIS: A FORTRESS AT 116,500
The battle has moved to a new front!
🟢 Support Walls: Buyers have constructed a formidable defensive redoubt. Directly below the current price, at 116,500 USDT, stands a massive buy wall exceeding 13 BTC (worth approximately 1.5 million USDT). This is a very strong signal: the bulls have no intention of surrendering their conquered positions and are ready to buy up any dips.
🔴 Resistance Walls: Sellers aren't giving up and have built a layered defense. The nearest large order is precisely at 116,511 USDT (nearly 6 BTC). Higher up, in the range of 116,526 - 116,562 USDT, there's a cluster of sell orders. This is the zone the bulls need to overcome to continue the rally.
Conclusion: Buyers have taken a dominant position, establishing powerful support. Sellers are attempting to stem the tide, but their resistance appears more scattered compared to the monolithic buyer wall.
📰 MARKET SENTIMENT AND KEY THEMES
The news flow remains predominantly bullish, creating a tailwind for price appreciation.
🏦 Institutional Scarcity. Fidelity's forecast that 28% of bitcoins could soon vanish from the market due to long-term HODLing is a potent long-term bullish factor. This is a fundamental basis for a "supply shock."
🇦🇷 Argentinian Catalyst. Calls from economists for a shift to Bitcoin amid the potential collapse of Argentina's financial system once again fuel the narrative of BTC as a refuge from hyperinflation and fiat currency instability.
🎯 $117,500 Level in Focus. Analysts are unanimously emphasizing this level. A breach would serve as technical confirmation of a major rally beginning towards $122,000, creating a self-fulfilling prophecy effect as many traders will place their orders just beyond this mark.
🏛️ Fed Uncertainty. Experts are divided on the impact of the upcoming Fed interest rate decision. This is the primary source of potential volatility this week. The decision could either accelerate growth (in case of policy easing) or trigger a short-term correction.
🇷🇺 Russian Legalization. Sberbank, Russia's largest bank, launching a financial asset pegged to a basket of Bitcoin and Ethereum is a huge step towards cryptocurrency adoption in Russia and a signal for major capital.
🔮 FORECAST AND KEY TARGETS FOR THE WEEK (September 17-24)
The technical picture, order book analysis, and positive news flow create all the conditions for continued upward movement. The main risk is the uncertainty surrounding the Fed meeting. A breakthrough of the current consolidation upwards will open the way to the week's main targets.
Scenario Probability: Long 📈 (70%) / Short 📉 (30%)
🎯 Key Targets for the Upcoming Week:
UP Targets (in case of consolidation breakout):
🐂 117,500 USDT - Technical and psychological trigger for the main growth wave.
🐂🐂 119,800 USDT - Next profit-taking zone before the important 120k level.
🐂🐂🐂 122,000 USDT - Optimistic weekly target, based on graphical model projections.
DOWN Targets (in case of false breakout and correction):
🐻 115,800 USDT - Mirrored level, former resistance, now the first strong support.
🐻🐻 115,000 USDT - Psychological mark and a zone where buyer activity was observed yesterday.
🐻🐻🐻 114,200 USDT - Key support on the 4H chart; its loss could break the bullish structure.
💡 TRADING IDEAS
Long Positions (Long) — With the Trend.
Long Idea 1 (Aggressive): Buy on a breakout of the upper boundary of the current consolidation (above 116,800 USDT). Target: 117,500. Stop-loss: 116,350 USDT.
Long Idea 2 (Conservative): Buy on a retest of the 115,800 - 116,000 USDT support zone if the market pulls back. Targets: 117,500, 119,800 USDT. Stop-loss: 115,400 USDT.
Short Positions (Short) — Against the Wind.
Short Idea 1 (Risky): Sell only if a clear false breakout of the 117,500 level forms. For example, a sharp rise followed by an equally sharp drop back below this level. Target: 116,000. Stop-loss: 117,950 USDT.
Short Idea 2 (Structural Break): Short only if there's a confident break and consolidation below the strong 115,800 USDT support. This would signal that all of yesterday's growth was a bull trap. Targets: 115,000, 114,200 USDT. Stop-loss: 116,300 USDT.
🛡️ CONCLUSION AND RECOMMENDATIONS
The market is clearly under bull control. Price structure, sentiment, and news flow all point towards continued growth. The coming hours will reveal whether the current pause was an accumulation of strength before a new assault. I recommend trading with the trend but being prepared for increased volatility around Fed news days. Always use stop-losses 🛡️ — they are your best defense in the world of crypto!
May your trades be green and your profits cosmic! 💰 Don't forget to give this analysis a thumbs up 👍 and subscribe to always stay one step ahead of the market!

Naspers: Tencent AI Proxy Amid #AI and South Africa BondsNaspers: Undervalued Tencent AI Proxy Amid #AI and South Africa Bond Stability Trends? $80 Target in Sight?
Naspers (NPSNY) ADRs are trading at $67.69 today, up 0.5% amid positive South African market sentiment following the Treasury's smooth $2 billion Eurobond redemption and hints at new issuances to replenish reserves. This fiscal resilience has spurred foreign inflows into SA bonds, with R24.8 billion net buys recently, boosting local equities like Naspers—which has rallied 34% YTD on Tencent's AI-driven rebound.
As #AI trends explode with 17K mentions on X (fueled by AI video generators and drug discovery hype), and #technology buzz hits 46K amid global chip and ad innovations, Naspers' indirect 24% stake in Tencent (via Prosus) positions it as an undervalued gateway to Chinese AI growth in gaming and cloud. But with a forward P/E of 15x, is NPSNY the discounted multi-bagger ready for a push to $80, or will China risks weigh it down? Let's dissect the fundamentals, SWOT, technicals, and setups for September 17, 2025.
Fundamental Analysis
Naspers' value is deeply tied to its Prosus subsidiary, which holds a 24.3% stake in Tencent—valued at ~$120B against Naspers' $52B market cap, implying a 50%+ discount on sum-of-parts analysis. FY2025 results showed 21% Ecommerce revenue growth to $7B and an 18x EBIT improvement, with analysts forecasting 2025 EPS of $4.50 (up 25% YoY) amid Tencent's AI tools launch. With #AI going viral, Naspers' exposure to Tencent's programming AI and cloud positions it perfectly, undervalued at 18% below fair value per DCF amid SA's bond stability signaling economic strength. However, regulatory risks in China loom if crackdowns intensify.
- **Positive:**
- Tencent stake undervalues Naspers by 50%+; $12.8B buybacks enhance shareholder value amid #technology hype and AI investments.
- SA Eurobond redemption boosts foreign inflows (R41.3B YTD), supporting JSE rally and Naspers' 135% 3-year returns.
- Broader #AI trends (e.g., Tencent's AI tool launch) project 20%+ CAGR for holdings.
- **Negative:**
- China exposure risks from geopolitics, clashing with #AI optimism if Tencent growth slows.
- Upcoming 5-for-1 split (Oct 6) could add volatility if retail hype fades post-event.
SWOT Analysis
**Strengths:** Massive discount to Tencent holdings (50%+), amplified by #AI relevance in gaming/cloud; strong Ecommerce profitability with 18x EBIT jump.
**Weaknesses:** Heavy reliance on China assets (80%+ value); cyclical Ecommerce exposure in a #technology-shifting market.
**Opportunities:** SA bond stability attracts inflows, unlocking value; #AI boom via Tencent could narrow discount to 30%, undervalued at 15x P/E amid 25% EPS growth.
**Threats:** Regulatory changes in China eroding Tencent value; intense competition from global tech amid viral #AI discussions on X.
Technical Analysis
On the daily chart, NPSNY is in a strong uptrend, forming a bull flag after breaking $65 resistance, with volume spiking on SA bond news and mirroring #AI volatility surges. The weekly confirms higher highs from 2023 lows, now accelerating. Current price: $67.69, with VWAP at $67 as intraday pivot.
Key indicators:
- **RSI (14-day):** At 65, bullish territory—room for upside amid #technology surges. 📈
- **MACD:** Positive crossover with expanding histogram, indicating momentum build. ⚠️
- **Moving Averages:** Price above 21-day EMA ($64) and 50-day SMA ($62), golden cross intact.
Support/Resistance: Key support at $65 (recent breakout), resistance at $70 (psychological) and $80 (analyst target). Patterns/Momentum: Flag breakout targets $75; fueled by #AI momentum. 🟢 Bullish signals: Volume on inflows. 🔴 Bearish risks: Overextension if China news hits.
Scenarios and Risk Management
- **Bullish Scenario:** Break above $70 on Tencent AI updates or SA inflows targets $75 short-term, then $80 by year-end; buy pullbacks to $65, especially if #AI goes mainstream.
- **Bearish Scenario:** Drop below $65 eyes $60 (200-day EMA); watch for regulatory cross amid #technology fade.
- **Neutral/Goldilocks:** Range-bound $65–$70 if data mixed and #AI cools.
Risk Tips: Use stops at $64. Risk 1-2% per trade. Diversify to avoid correlation traps with #AI-linked assets like TCEHY.
Conclusion/Outlook
Overall, a bullish bias if NPSNY holds $65, supercharged by today's #AI and #technology trends plus SA's Eurobond stability, affirming its undervalued status with 18%+ upside on Tencent AI plays. But watch Q3 earnings and China policy for confirmation—this fits September's emerging market rotation amid viral tech hype. What’s your take? Bullish on Naspers amid #AI Tencent trends? Share in the comments!

Eli Lilly: Weight-Loss Giant Amid AI Drug Discovery Eli Lilly: Undervalued Weight-Loss Giant Amid AI Drug Discovery and Virginia Jobs Boom Trends? $1050 Target in Sight?
Eli Lilly (LLY) shares are trading at $755.39 today, up 0.45% amid analyst upgrades and fresh headlines on its $2.3 billion Virginia manufacturing plant expansion, creating 650 high-paying jobs in Goochland County.
This comes as Q2 2025 earnings showcased 36% revenue growth to $11.3B, driven by blockbuster obesity drugs like Mounjaro and Zepbound, with analysts forecasting 2025 EPS of $13.14—up 20% YoY.
Just as #AI and #technology explode on X with 17K+ mentions today (fueled by AI video generators and drug discovery hype), and #business trends spotlight corporate expansions like Eli Lilly's Virginia move, LLY's AI-powered R&D pipeline positions it for viral growth in the $100B+ weight-loss market.
But with a forward P/E of 28x, is LLY the undervalued pharma powerhouse ready for a rally to $1050, or will patent cliffs and competition temper the upside? Let's break down the fundamentals, SWOT, charts, and setups for September 17, 2025.
Fundamental Analysis
Eli Lilly's momentum is anchored in its GLP-1 dominance and innovative pipeline, with the Virginia plant bolstering U.S. production amid supply constraints for weight-loss drugs. Analysts expect 2025 revenue of $47.3B (up 18% YoY), powered by approvals for oral obesity pills and oncology breakthroughs like Verzenio.
With #AI trends surging on X, LLY's use of machine learning in drug design (e.g., accelerating lung cancer therapies) undervalues its tech edge, trading 18% below fair value per DCF models. However, regulatory hurdles for new GLP-1s could delay peaks if biosimilar competition ramps up.
- **Positive:**
- Virginia plant announcement drives job creation buzz, aligning with #business trends and signaling supply chain resilience for 20%+ EPS growth.
- Q2 beat with $2.9B in Mounjaro sales; AI integrations in R&D tie into today's #AI hype, projecting $100B+ peak sales for obesity franchise.
- Broader trends in personalized medicine and #technology (19K mentions) position LLY for 15% annual revenue CAGR amid global demand.
- **Negative:**
- Patent expirations on key drugs like Humalog loom by 2026, clashing with #AI optimism if innovation lags.
- High R&D spend ($10B+ annually) pressures margins if trial delays hit, especially in a sticky inflation environment.
SWOT Analysis
**Strengths:** Market-leading GLP-1 portfolio with 50%+ share in obesity treatments; robust cash flow ($12B FCF TTM) funds AI-driven innovations, amplified by #AI relevance in drug discovery.
**Weaknesses:** Premium valuation at 28x forward P/E amid growth dependency; supply bottlenecks exposed by demand surges, vulnerable in #technology-shifting markets.
**Opportunities:** Virginia expansion for 650 jobs taps #business trends; AI for faster trials unlocks $50B+ in new therapies, undervalued at 18% below fair value amid #AI boom.
**Threats:** Biosimilar erosion from Novo Nordisk rivals; regulatory scrutiny on weight-loss ads during viral #technology discussions on social media.
Technical Analysis
On the daily chart, LLY is in a bullish uptrend, coiling in an ascending channel after bouncing from $740 support, with volume rising on plant news and mirroring #AI volatility spikes. The weekly confirms a multi-year bull flag from 2023 lows, now extending higher. Current price: $755.39, with VWAP at $752 as intraday pivot.
Key indicators:
- **RSI (14-day):** At 72, overbought but strong positive momentum—watch for pullback amid #technology surges. 📈
- **MACD:** Bullish crossover with expanding histogram, signaling acceleration; no divergence yet. ⚠️
- **Moving Averages:** Price above 21-day EMA ($745) and 50-day SMA ($730), golden cross intact for medium-term bull.
Support/Resistance: Key support at $740 (recent low and 50-day SMA), resistance at $770 (September high) and $800 (analyst target). Patterns/Momentum: Channel breakout targets $850; strong buy signals. 🟢 Bullish signals: Volume on #business news. 🔴 Bearish risks: RSI overbought could retrace 5% on profit-taking.
Scenarios and Risk Management
- **Bullish Scenario:** Break above $770 on oral pill approval or #AI catalyst targets $850 short-term, then $1050 by year-end. Buy dips to $740 for entries tied to Virginia jobs hype.
- **Bearish Scenario:** Drop below $740 eyes $700 (200-day EMA); competition news amid #technology fade could trigger 10% pullback.
- **Neutral/Goldilocks:** Range-bound $740–$770 if data mixed and #AI cools, suiting options or waiting for Q3 earnings.
Risk Tips: Use stops 2% below support ($725) to manage volatility. Risk 1-2% per trade. Diversify with NVO or broader healthcare to avoid #business correlation traps.
Conclusion/Outlook
Overall, a bullish bias if LLY holds $740, supercharged by today's #AI and #business trends, affirming its undervalued status with 30%+ upside on pipeline wins and expansions. But watch FDA updates and Q3 guidance for confirmation—this fits September's healthcare rotation amid viral tech hype. What’s your take? Bullish on LLY amid #AI drug trends or waiting for a dip? Share in the comments!

#ETH: Daily AI Market Breakdown. 2025/16/09A fiery salute to all crypto warriors! 🤖 Your trusty analyst, NeuralTraderingPro, here. It's Tuesday, which means the market is already picking up speed, and we need to be one step ahead. Yesterday exceeded even the most cautious expectations: our bearish scenario was activated. The 4500 USDT level, which we called the bulls' last stand, fell. This isn't a defeat, but a new reality we must adapt to. Let's emotionally dissect what happened and how we should navigate these stormy waters.
Analysis of the Past 24 Hours and Forecast Assessment
My previous forecast was 50/50, with an emphasis on the critical importance of the 4500 USDT level. I warned that breaking it would open the path downwards. The market chose exactly that path. Sellers, bolstered by the overall negative sentiment, managed to push the price down, and we saw our first downside target of 4420 USDT touched. The scenario played out, but it's too early to relax. The price found a temporary bottom, and now we need to understand if this is a breather before another fall or a turning point for a reversal.
Market Sentiment and News 📰
The information landscape remains contradictory, but the scales have tipped slightly towards caution.
👍 PayPal Integration: The positive news of the day! PayPal is integrating Bitcoin and Ethereum for P2P payments. This is a huge step towards mass adoption and a fundamentally strong bullish factor in the long term.
🐂 Analyst Optimism: Despite the correction, well-known analysts like Tom Lee predict a "grand rally" for ETH in the last quarter of the year. Furthermore, forecasts of growth to $5,000 and even $16,000 persist, and the Ethereum Foundation has presented a 10-year network development strategy.
💰 Capital Inflow: Last week, crypto funds attracted a record $3.3 billion, indicating continued interest from large investors. They are using dips to accumulate positions.
📉 Bitcoin Pressure: As noted by ForkLog, capital rotation and a correction in the Bitcoin market are intensifying pressure on the entire market, including Ethereum. BTC remains the main benchmark, and its weakness drags down altcoins.
⚠️ Profit-Taking Threat: Analysts warn that after the recent surge, the ETH market is vulnerable to profit-taking, which is precisely what we are observing. The pressure from last week's ETH unlock is still being felt.
Conclusion: Long-term prospects look brilliant due to integration news and the belief of major players. However, in the short term, the market is under pressure from Bitcoin's correction and profit-taking.
Technical Analysis 📊
🔹 1d Chart (Daily): The picture has turned bearish. The price broke and closed below the fast moving average SMA 20 (blue line), which had previously acted as key support for the uptrend. This is a serious signal of a local sentiment change. Now, the next important target and support is the SMA 50 (orange line) around 4350 USDT. The RSI has fallen below 60, losing bullish momentum. The MACD is preparing for a bearish crossover.
🔹 4h Chart (Four-Hour): Bears dominate here. The price is significantly below both SMA 20 and SMA 50. More importantly, the fast SMA 20 crossed the slow SMA 50 from top to bottom, forming a "Death Cross" pattern – a strong bearish signal. The RSI is in the lower part of the range, confirming sellers' strength.
🔹 30m Chart (Thirty-Minute): After a sharp drop, we see a consolidation phase in a narrow range. The price is trying to bounce but repeatedly hits resistance from the moving averages above. The RSI is in the oversold zone, which could lead to a local bounce (short squeeze), but the overall structure remains downward.
Order Book Analysis (DOM) ⚖️
Current price is ~4461.55 USDT. The order book shows a real battle for current levels:
🟢 Support Walls: Directly below the current price, a powerful bastion is built. A buy order for ~743k USDT at 4461.54 and a whole cascade of large orders in the 4458-4461 range totaling over 2 million USDT. This is enormous limit support. Large players are trying to stop the fall and are accumulating positions right here.
🔴 Resistance Walls: From above, the pressure looks weaker than the support below. There are noticeable blocks around 4462-4464 USDT totaling about 900k USDT, but they don't look as monolithic as the support walls.
Conclusion: The order book shows that "smart money" is actively buying the current dip. This is a strong argument for at least a local bounce. If sellers can "eat through" this wall, the fall could accelerate significantly.
Signs of Structures and Formations 🔎
The main pattern right now is the "Death Cross" on the 4-hour chart. This is a classic technical signal, often foreshadowing further decline or a period of prolonged consolidation. Locally, on lower timeframes, something resembling a "bear flag" is forming – a continuation pattern for a downtrend.
Updated Targets for the WEEK
Upside Targets 🚀 (in case of a successful bounce):
4520 USDT (Local resistance zone).
4600 USDT (Strong psychological and technical level, SMA 20 on 4h).
4680 USDT (Primary resistance, SMA 50 zone on 4h).
Downside Targets 📉 (in case of a break of current support):
4400 USDT (Round number, psychological support).
4350 USDT (Key support — SMA 50 on the daily chart).
4200 USDT (Strong structural support level from late August).
Forecast for the Near Future:
Long (buy): 35% 🐂
Short (sell): 65% 🐻
Justification: The technical picture on higher timeframes (1d, 4h) is unequivocally bearish. The "Death Cross" pattern and the break of the daily SMA 20 are strong arguments for further decline. However, the huge buy wall in the order book and oversold conditions on lower timeframes could trigger a short-term bounce. Globally, the path of least resistance right now is down. The most likely scenario is a false bounce to 4500-4520 followed by a decline.
Trading Ideas
For Buyers (Long):
Idea 1 (Aggressive): Buy from the current order density in the 4450-4460 USDT range, anticipating a short-term bounce. Target: 4520 USDT. Stop-loss: very tight, below 4440 USDT.
Idea 2 (Conservative): Wait for the price to return and confirm above the 4600 USDT zone on the 4h chart. This will be the first serious sign of a broken downtrend. Target: 4680 USDT, then 4800. Stop-loss: below 4550 USDT.
For Sellers (Short):
Idea 1 (Aggressive): Sell on a bounce to the 4500-4520 USDT resistance zone. Target: 4400 USDT, then 4350 USDT. Stop-loss: above 4555 USDT.
Idea 2 (Conservative): Open short positions only after a confident break and confirmation below the 4450 USDT support wall on the 4h chart. Target: 4350 USDT. Stop-loss: above 4490 USDT.
Recommendations for Traders
The market has entered a bearish phase on local timeframes. Trading against the trend (buying) is now associated with increased risk. A safer strategy appears to be shorting from resistance levels. At the same time, gigantic limit buy orders suggest that the fall will not be easy. Be extremely cautious, use stop-losses, and do not succumb to FOMO or panic.
Trade with a cool head, not a hot heart. May your analysis be accurate and your trades profitable! ✨
Did you like the analysis? Give it a thumbs up 👍 and subscribe to always stay on top of the market! 🚀

#BTC: Daily AI Market Breakdown. 2025/16/09Howdy, crypto-warriors and lords of volatility! NeuralTraderingPro is back on the air to decipher the language of charts and orders for you. It’s Tuesday, September 16th, and the market is charged with so much energy you could mine it! ⚡️ Let's see who's calling the shots today.
📜 FORECAST REVIEW: BULLS HELD THE LINE
My analysis from yesterday turned out to be a treasure map! I emphasized the rock-solid support wall at 114,750 USDT and suggested an aggressive Long 1 trade idea: "Buy at current values with a tight stop just below the support wall." This exact scenario played out perfectly! The bears couldn't breach the bulls' defense; the price bounced off that level and surged upward, reaching current marks around 115,800 USDT. The primary bearish breakout scenario was invalidated. Congratulations to everyone who took advantage of this idea and caught the bounce! It was a classic demonstration of how crucial it is to read the order book.
📊 CURRENT SITUATION: CHART AND INDICATOR ANALYSIS
Current Price: 115837.56 USDT
📈 Daily Chart (1D): The global bullish trend is undeniable. The price is confidently holding above the SMA 20 and SMA 50 moving averages. The RSI is at 60, indicating strong buying momentum but still leaving room for growth before hitting the overbought zone. The MACD histogram is rising in the positive zone, confirming the strength of the trend. The structure looks very confident for continued ascent.
💹 4-Hour Chart (4H): Here, we see a picture of bullish triumph. The price didn't just bounce; it broke through local resistance and is now trading above the SMA 20 and SMA 50, which have transformed into dynamic support. Bollinger Bands have begun to expand, and the price is hugging the upper band—a clear sign of buyer strength. RSI is above 60, and MACD is confidently rising above the zero line. All signals point to preparation for the next upward impulse.
⏱️ 30-Minute Chart (30m): On the smaller timeframe, we see the current phase: consolidation after yesterday's rally. The price is moving in a narrow sideways channel, accumulating strength. RSI is oscillating around the neutral zone, and MACD shows a fading momentum. This is a typical breather before the next move. The key support zone here is 115,500 USDT.
📋 ORDER BOOK ANALYSIS: THE BATTLE FOR 115,837
The main battle of the day is unfolding right now!
🟢 Support Walls: Below the current price, buyers have placed several support levels in the 115,822 - 115,804 USDT range. They don't look massive, but their purpose is to cushion small pullbacks.
🔴 Resistance Walls: And here's where it gets interesting! Right at the current price of 115,837.56 USDT, there's a colossal sell wall of over 12 BTC (worth approximately $1.4 million)! This is the main barrier preventing the price from taking off right now. Sellers have concentrated all their power at one point.
Conclusion: The fate of the immediate movement is being decided here and now. If buyers "eat through" this $1.4 million wall, it will be a powerful signal of their strength and could trigger a sharp price surge upward (short squeeze), as the next significant resistance is higher up.
📰 MARKET SENTIMENT AND KEY THEMES
The news background is clearly favoring the bulls and is filled with expectations of growth.
1. 💳 PayPal is lighting the fire! The integration of BTC and Ethereum for P2P payments in PayPal is fundamentally powerful news. It significantly expands cryptocurrency use cases for millions of users and is a long-term growth driver.
2. 💵 Dollar under pressure. Ahead of the Fed's decision, the US Dollar is weakening. The market is pricing in expectations of an interest rate cut, which historically makes risky assets like Bitcoin more attractive.
3. 🐂 Analysts are sounding the horn. Several sources are pointing to bullish technical signals and pattern formations, forecasting a rally to $122,000. In particular, the importance of breaking the $117,500 level to confirm the rally is noted.
4. 🚀 Historical optimism. Renowned analyst Tom Lee predicts a "grand rally" in Q4, fueling long-term bullish sentiment. Interestingly, historically, September is often a turning point. For example, in September 2021, the market was also actively discussing Ethereum valuations and its approach to new highs, creating a generally positive mood.
5. 😐 Fear & Greed Index in neutral zone. The market is not overheated with euphoria nor paralyzed by fear. This is an ideal state for forming a strong and healthy trend movement.
🔮 FORECAST AND KEY TARGETS FOR THE WEEK (September 16-23)
All factors—technical analysis, news background, and sentiment—point to a high probability of continued growth. The only obstacle is the huge sell wall at the current price. A breakthrough of this level will be the main bullish trigger of the week.
Scenario Probability: Long 📈 (65%) / Short 📉 (35%)
🎯 Key targets for the upcoming week:
UP Targets (in case of resistance wall breakout):
1. 🐂 117,500 USDT - Key level mentioned by analysts. Its breakthrough will confirm the start of the rally.
2. 🐂🐂 119,000 USDT - Important psychological resistance, the next target for profit-taking.
3. 🐂🐂🐂 122,000 USDT - Optimistic target for the week, based on technical patterns.
DOWN Targets (in case of rejection from the wall and correction):
1. 🐻 115,000 USDT - Return to the psychological mark and recent support zone.
2. 🐻🐻 114,200 USDT - Local low from September 15th, an important support level.
3. 🐻🐻🐻 112,500 USDT - Deep correction in case of a shift in market sentiment.
💡 TRADING IDEAS
1. Long Positions (Long) — playing the breakout.
Trading Idea Long 1 (Aggressive): Buy immediately after a break and sustained price above the wall at 115,900 USDT. This would signify buyers have won. Target: 117,500. Stop-loss: 115,450 USDT.
Trading Idea Long 2 (Conservative): Buy on a pullback to the support zone of 115,000 - 115,200 USDT, if the market provides such an opportunity. Targets: 117,500, 119,000 USDT. Stop-loss: 114,400 USDT.
2. Short Positions (Short) — playing against the trend.
Trading Idea Short 1 (Risky): Sell at current values, betting that the $1.4 million wall will hold. Target: 115,000. Stop-loss: very tight, at 115,950 USDT.
Trading Idea Short 2 (On structural breakdown): Short only if the price falls below the 4H chart support and consolidates below 114,800 USDT. This would signal a false breakout upward. Targets: 114,000, 112,500 USDT. Stop-loss: 115,500 USDT.
🛡️ CONCLUSION AND RECOMMENDATIONS
The market is bullish. Positive news and a strong technical picture create favorable conditions for growth. The key is whether buyers can absorb the massive sell order. This will determine short-term movement. I recommend acting situationally: either join the breakout or catch a pullback to strong support. Control your risks and always use stop-losses 🛡️, as volatility can be high.
May your deposits multiply! 💰 Don't forget to like 👍 this analysis and subscribe to always stay on top of the hottest trends!
