IOT: substantial bullish macro potentialMacro structure shows substantial bullish potential. Price has successfully retested the 2021 ATH area, reacted with a constructive-looking recovery, and is potentially forming a higher low on the weekly timeframe.
A successful breakout and follow-through above the May ’24 highs would increase the probability of a new mid- to long-term uptrend developing, with the next key resistance levels at 70 and 100.
Failure to confirm a breakout above 42—or alternatively, a breakdown below the 50-day MA—would shift the odds toward a deeper correction into the 30-25 macro support zone.
Chart (Daily):
Chart (Weekly):
Aistocks

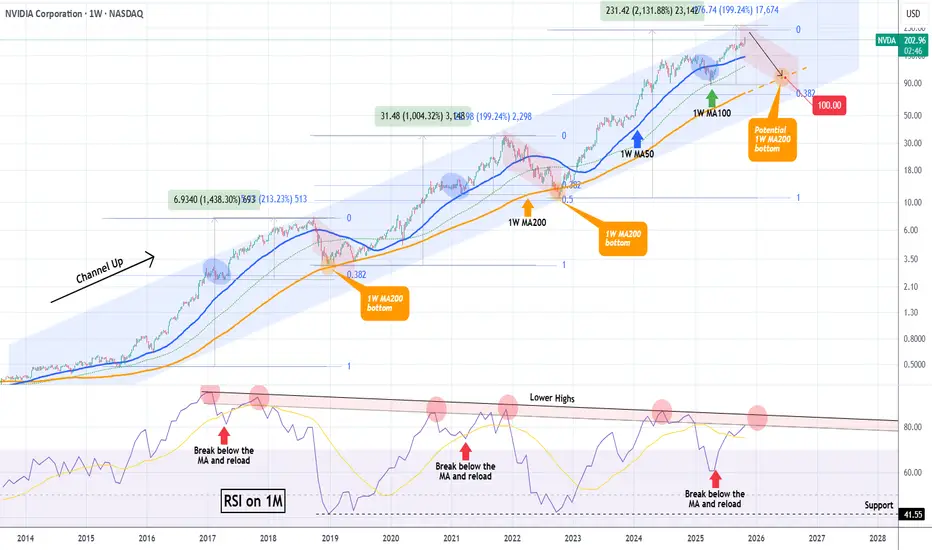
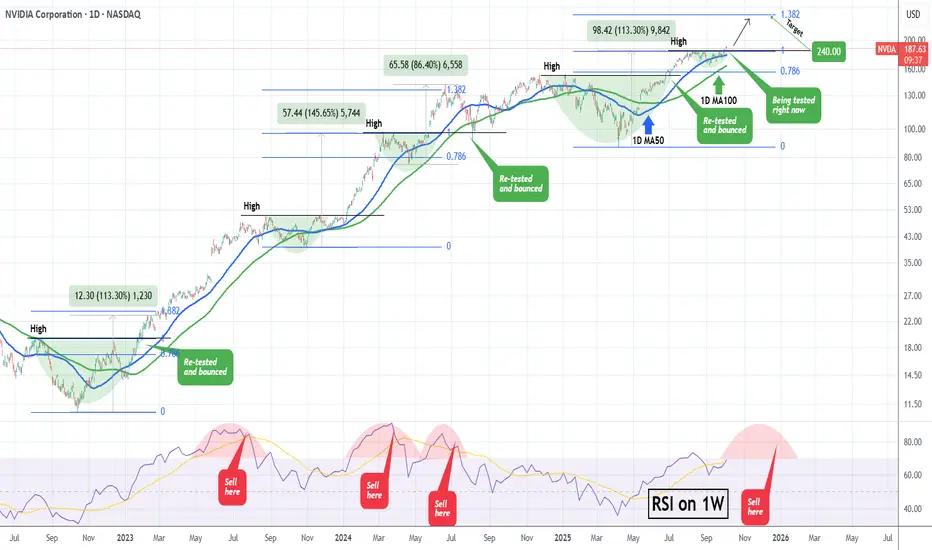
NVIDIA hit $5 Trillion but the end of the rally may be near.NVIDIA Corporation (NVDA) broke this week the $5 Trillion market cap barrier, becoming the first company to do so. In the meantime, it is extending the rally that started on the April 07 Low on the 1W MA100 (green trend-line), following the end of the Tariff War.
This rally has been nothing more than a part of the larger technical Bullish Leg inside the 10-year Channel Up that NVIDIA has been trading in. Within this pattern, the price has had rather asymmetric Bullish Legs in terms of rise % but has always been rejected at the top of the Channel Up and corrected back to the 1W MA200 (orange trend-line).
Following the mid-Bullish Leg corrections to the 1W MA50 (blue trend-line), the final rallies of the Bullish Legs before their Tops have been around +200%. Then their corrections/ Bearish Legs have always hit the 1W MA200 (as mentioned), with one time bottoming just above the 0.382 Fibonacci retracement level and the other below it (0.5 Fib).
We previously had NVIDIA's top at around $240, which is slightly below this expected +200% rise from the 1W MA100 bottom. As a result, we project that a potential contact with the 1W MA200 for the 2026 Bearish Leg can be achieved around $100, which is above the 0.382 Fib, similar to 2018.
Note that a very reliable Top indicator has also been the 1M RSI and its 9-year Lower Highs Zone. Every time the RSI entered the Zone and then broke below its MA (yellow trend-line) and rebounded, the next hit was the Bullish Leg's Top. Right now the 1M RSI is about to enter this Zone for the second time, indicating that we may be approaching the end of this long-term rally.
-------------------------------------------------------------------------------
** Please LIKE 👍, FOLLOW ✅, SHARE 🙌 and COMMENT ✍ if you enjoy this idea! Also share your ideas and charts in the comments section below! This is best way to keep it relevant, support us, keep the content here free and allow the idea to reach as many people as possible. **
-------------------------------------------------------------------------------
💸💸💸💸💸💸
👇 👇 👇 👇 👇 👇
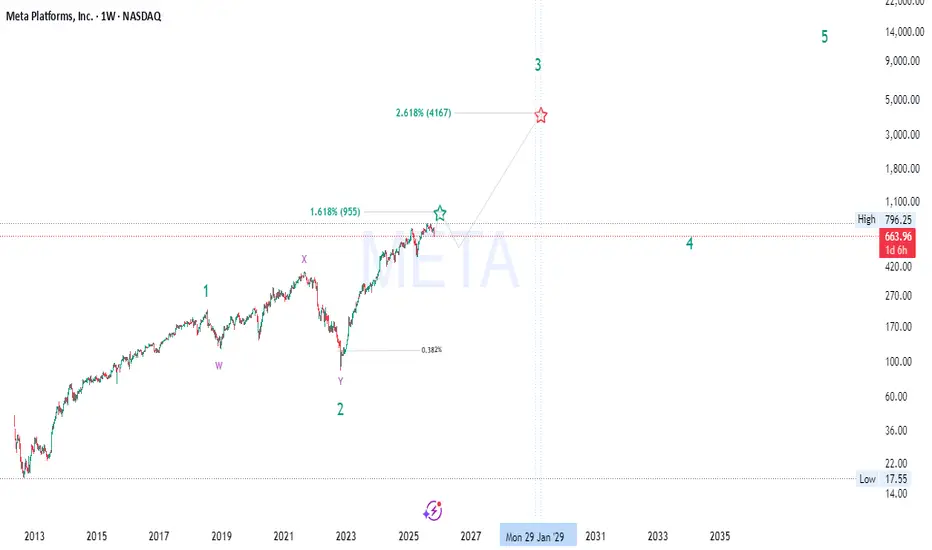
META’s Hidden Fibonacci Path to 4000+ — Don’t Miss Wave 3🚀 META Long-Term Elliott Wave + Smart Money Macro Outlook
🌊 Elliott Wave Structure (662→955→4000+)
META appears to be progressing through a major impulsive 5-wave supercycle on the weekly timeframe:
Wave 1: The initial breakout from accumulation (2015–2021), fueled by growth in advertising dominance and metaverse expansion narratives.
Wave 2: Deep corrective W–X–Y structure into the 2022 low around $90 — a classic multi-year liquidity sweep and re-accumulation phase.
Wave 3 (in progress): This is typically the strongest and most extended wave , with Fibonacci projections aligning near the 2.618 extension ≈ $4,160 , targeting 2028–2029 based on current momentum.
Wave 4: Expected to form a macro re-distribution or range between ~$900–$1,000 before the final parabolic Wave 5, likely extending toward $10K+ .
💡 Wave Confluence:
1.618 Fib extension of Wave 1 → Wave 3 aligns around $955 , acting as the first major resistance (and your current high zone).
2.618 Fib extension → next macro target $4,160 , confirming bullish impulsive momentum.
🧠 Smart Money Concepts (SMC)
The 2022–2023 bottom represents a “Displacement + Re-accumulation” phase , with institutions absorbing liquidity beneath previous demand zones.
Current price action (mid-2025) shows a premium range reaction , where smart money is likely taking partial profits before the next accumulation leg.
Expect a retracement into the 0.382–0.5 Fib zone ($420–$500) to rebalance inefficiencies before continuation toward macro Wave 3 targets.
Key Reaccumulation Zone: $420–$500 — watch for BOS (Break of Structure) confirmation and liquidity sweeps below equal lows.
🔍 Fibonacci Alignment
0.382 retrace marks ideal Wave 4 re-entry.
1.618 & 2.618 extensions align perfectly with the Wave 3 and 5 confluences — textbook impulsive expansion.
Each extension zone has been confirmed with prior liquidity sweeps and displacement candles, increasing Fibonacci reliability 📈.
📊 Market Structure & Price Action
META maintains a strong bullish market structure of Higher Highs (HH) and Higher Lows (HL) since 2023.
The recent 9% correction (-$69) is likely a short-term liquidity grab — not structural weakness.
As long as price holds above $420 , macro bullish market structure remains intact.
Volume profile shows heavy accumulation between $300–$450 , suggesting smart money is still positioned long-term bullish.
💰 Fundamental Confluence
META’s fundamentals are catching up with technicals:
Massive AI CapEx and ad recovery boosting EPS growth 📊
Metaverse burn rate shrinking , improving profitability
Share buybacks providing a floor for price corrections
Macro environment supports tech leadership rotation , and META remains a key beneficiary of the AI + social data synergy cycle 🔄
🔮 Market Cycle View
We’re entering the “Expansion Phase” of the broader innovation cycle.
2018–2022 = Accumulation/Disbelief
2023–2025 = Early Markup / Smart Money Entry
2025–2029 = Public Participation Phase (Wave 3) 💥
Post-2029 = Euphoria / Distribution (Wave 5) 😱
⚙️ Key Levels to Watch
Support Zones: $420 – $500 (Wave 4 re-entry)
Resistance Levels: $955 → $4,160 (Wave 3 targets)
Invalidation: Sustained break below $300 on weekly close
📈 Summary
META remains one of the strongest macro bullish charts in big tech — with perfect alignment across Elliott Wave, SMC, Fibonacci , and fundamental cycle theory .
We’re currently witnessing the mid-phase of Wave 3 , with institutional repositioning before the next vertical leg. Patience and precision around the reaccumulation zone ($420–$500) could provide the golden setup before the next expansion wave 🚀🌕
#META #ElliottWave #SmartMoneyConcepts #Fibonacci #Wave3 #BullMarket #AIStocks #TechnicalAnalysis #TradingView
ROCKET LAB has topped. Sell signal on Bearish Divergence.Last time we took a look at Rocket Lab (RKLB) was more than 5 months ago (May 12, see chart below) where we gave a Buy Signal exactly on the 1D MA50 and the price instantly reacted with a rebound, easily hitting our $32.00 Target:
This time we are getting a Sell Signal on the chart as despite the stock's Higher Highs, its 1D RSI has been trading under Higher Lows since July 17, exhibiting a Bearish Divergence. The last similar Bearish Divergence was seen on January 24 2025, which was RKLB's previous Channel Up Top.
That signal triggered a correction that extended all the way back to the 0.382 Fibonacci retracement level and hit the 1D MA200 (orange trend-line) before bottoming. As a result, we are now turning bearish on Rocket Lab, targeting $40.00 (Fib 0.382).
-------------------------------------------------------------------------------
** Please LIKE 👍, FOLLOW ✅, SHARE 🙌 and COMMENT ✍ if you enjoy this idea! Also share your ideas and charts in the comments section below! This is best way to keep it relevant, support us, keep the content here free and allow the idea to reach as many people as possible. **
-------------------------------------------------------------------------------
💸💸💸💸💸💸
👇 👇 👇 👇 👇 👇

APLD: might be starting a new upswing Price is showing a constructive reaction from the 30–26 support zone and might be starting a new uptrend toward the next mid-term resistance area at 60–75.
As long as price continues to hold above the support zone, I’ll keep this trend structure as my main scenario.
Chart:

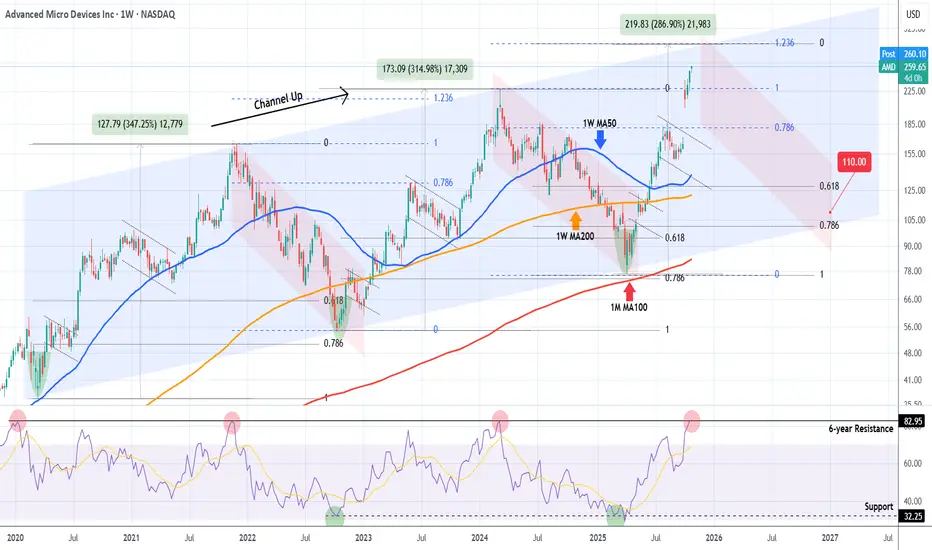
AMD Is it approaching a multi-year top and turning into a Sell ?Almost 8 months ago (March 07, see chart below) we made a bold call (for the time) on Advanced Micro Devices (AMD), expecting it to bottom on its 1M MA100 (red trend-line) and then rebound, targeting $320:
Well the Bullish Leg of its 6-year Channel Up had been even more aggressive than we expected and is already approaching its top (Higher Highs trend-line), much earlier than we expected.
This is technically the right time to book the amazing +240% profits from the April 07 bottom, as the 1W RSI just hit its 6-year Resistance, which has marked the Channel's two Tops.
Even though the Bullish Leg can technically extend as high as +287% on the 1.236 Fibonacci extension (like the previous did), the focus of a long-term investor should now be to buy (much) lower, preferably as close to the 1M MA100 as possible.
The last two Higher Lows of the Channel Up have been priced just above the 0.786 Fibonacci retracement level, so our fair long-term Target is currently at $110.00.
So do you also think AMD is approaching the end of the (long-term) road and is gradually turning into a Sell?
-------------------------------------------------------------------------------
** Please LIKE 👍, FOLLOW ✅, SHARE 🙌 and COMMENT ✍ if you enjoy this idea! Also share your ideas and charts in the comments section below! This is best way to keep it relevant, support us, keep the content here free and allow the idea to reach as many people as possible. **
-------------------------------------------------------------------------------
💸💸💸💸💸💸
👇 👇 👇 👇 👇 👇
PALANTIR sitting on a Buy Zone. Target $220.Palantir (PLTR) has been trading within a Channel Up since early May and is currently consolidating on its bottom (Higher Lows trend-line). while holding he 1D MA50 (red trend-line). The 4H MA50 (blue trend-line) - 1D MA50 range has been technically the most optimal buy zone of this pattern.
With the 4H RSI exhibiting a Bull Flag similar to May - June, we expect the stock to aim for at least its 2.618 Fibonacci extension at $220.00. If broken, it may extend for an end-of-year rally to $255.00 completing a +80% Bullish Leg similar to the Channel's first.
-------------------------------------------------------------------------------
** Please LIKE 👍, FOLLOW ✅, SHARE 🙌 and COMMENT ✍ if you enjoy this idea! Also share your ideas and charts in the comments section below! This is best way to keep it relevant, support us, keep the content here free and allow the idea to reach as many people as possible. **
-------------------------------------------------------------------------------
💸💸💸💸💸💸
👇 👇 👇 👇 👇 👇

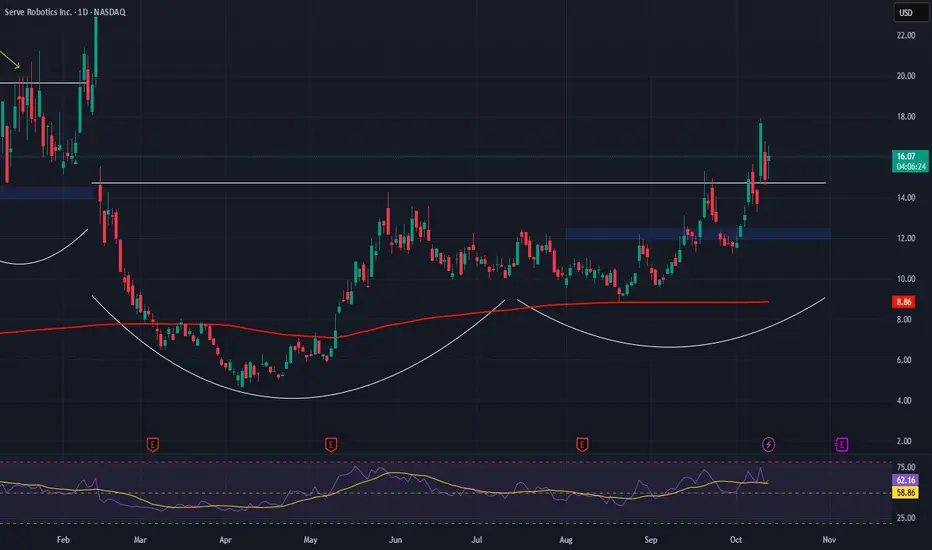
Serve Robotics Inc. (NASDAQ: SERV) – Bullish Setup EmergingServe Robotics NASDAQ:SERV is revolutionizing last-mile logistics with AI-powered delivery robots, offering strong exposure to the booming robotics and automation sector. The company's recent momentum and strategic partnerships signal major upside potential.
🔍 Key Drivers:
📈 Explosive Growth:
Q2 2025 revenue up 46% YoY
Deliveries jumped 80% QoQ
Clear signs of scaling and market demand
🤝 Uber Eats Partnership:
Multi-year deal to deploy 2,000 Gen3 robots in U.S. cities, including Chicago
Unlocks access to the projected $160B autonomous food delivery market by 2030
🌍 Long-Term Outlook:
Tied to ARK Invest’s $860B global robotics forecast
Targeting $60–80M annualized revenue once fully scaled
💰 Backed by Giants:
Supported by Uber and Nvidia
$167M raised in 2024 to fund expansion and AI development
📊 Trade Setup:
Bullish above: $12.00–$12.50
Upside target: $23.00–$24.00
Trend outlook: Strong momentum, backed by fundamentals and market demand
NVDA: Riding the AI Hype Wave to $250!NASDAQ:NVDA just hit its all-time high last friday, reaching my swing trade target. While I took profits as part of my routine discipline, I still believe there's plenty of upside left, with $250 in sight.
Here's why:
Strong Fundamentals: Nvidia consistently beats earnings expectations, with EPS climbing from $0.11 to $0.68 over recent six quarters. This growth trajectory shows no signs of slowing down, reinforcing the stock's upward momentum.
Analyst Confidence: Out of 65 analysts, 51 rate Nvidia as a "Strong Buy," with none suggesting a sell. While the average price target is $149.81, the highest target of $202.79 shows strong backing from the financial community.
Bullish Technicals: Weekly and daily moving averages, from the 10-day to the 200-day, are flashing "Buy" across the board. Add to that a myriad of other indicators in different time frames (basically, you name it), and it’s signaling "Buy." In short, everything is pointing towards continued bullish momentum and potential for further gains.
Market Leadership: Nvidia's dominance in AI and high-performance computing continues to grow. Its cutting-edge AI chips, as well as its strong presence in data centers and gaming, put the company in a prime position to capitalize on key growth sectors.
And finally, why am I more bullish than even the highest analyst target? Well, it’s simple: the hype. Nvidia is at the forefront of the most exciting and disruptive technologies today—AI, data centers, gaming—you name it. The market's enthusiasm surrounding these sectors is growing exponentially, and Nvidia is perfectly positioned to ride that wave. Sometimes, fundamentals and technicals align with pure market excitement, and that’s where I see Nvidia pushing past those conservative estimates toward $250.
Disclaimer: This content is for informational and educational purposes only. It should not be considered as financial or investment advice. Trading stocks involves risk, and you should perform your own research or consult with a professional before making any investment decisions. Past performance is not indicative of future results.

NVIDIA Next stop.. $200For a long time we've been calling for a $200 Target on NVIDIA Corporation (NVDA). That was our main Target for the Bull Cycle that started in November 2022. The stock is very close to this level and the short-term pattern that can get to it is this Channel Up.
Supported by the 1H MA100 (green trend-line), NVIDIA has been posting Bullish Legs of around +10% since the September 05 Low. The confirmation signal for those Legs has been a 1H MACD Bullish Cross.
Given that we formed one yesterday, we expect the price to be on such a Bullish Leg already. The 'weakest' of those sequences has been +9.58%, which if repeated, lands marginally above the $200 psychological level.
Time to hit it?
-------------------------------------------------------------------------------
** Please LIKE 👍, FOLLOW ✅, SHARE 🙌 and COMMENT ✍ if you enjoy this idea! Also share your ideas and charts in the comments section below! This is best way to keep it relevant, support us, keep the content here free and allow the idea to reach as many people as possible. **
-------------------------------------------------------------------------------
💸💸💸💸💸💸
👇 👇 👇 👇 👇 👇

NVIDIA What happens when it retests a Resistance after a break?NVIDIA Corporation (NVDA) has been on a strong rise since the mid-term September 05 Low and this week finally broke above its previous $184 High. During the current Bull Cycle (since the October 2022 bottom), every time the price broke above a previous High and re-tested it as a Support, it started a secondary rally to new Highs.
Technically, as long as the 1D MA100 (green trend-line) holds, we should see at least a 1.382 Fibonacci extension test, similar to the February 2023 and June 2024 Highs. As a result, once the current former High / Resistance level finishes getting re-tested, we expect an end-of-the-year rally to $240.
Additionally, we will keep an eye on the 1W RSI. Typically, once it gets massively overbought above 85.00 and then starts to decline within an Arc peak formation, the time to Sell is after the middle of that Arc.
-------------------------------------------------------------------------------
** Please LIKE 👍, FOLLOW ✅, SHARE 🙌 and COMMENT ✍ if you enjoy this idea! Also share your ideas and charts in the comments section below! This is best way to keep it relevant, support us, keep the content here free and allow the idea to reach as many people as possible. **
-------------------------------------------------------------------------------
💸💸💸💸💸💸
👇 👇 👇 👇 👇 👇
Arm Holdings (ARM): Bullish Outlook on Structural Growth ThemesArm Holdings NASDAQ:ARM is a semiconductor IP powerhouse driving innovation across AI, mobile, data centers, and IoT. With its high-performance, low-power chip architectures, Arm remains foundational to next-gen computing infrastructure.
🔍 Key Fundamentals:
Market Dominance: Arm holds a leading position in semiconductor IP, backed by deep R&D investment and expanding licensing with top global chipmakers.
Revenue Momentum: Recent earnings show strong revenue growth, underpinned by rising global demand for Arm-based designs.
AI & Cloud Pivot: Major cloud providers are rapidly adopting Arm-based server architectures, reflecting Arm’s shift into AI and enterprise computing.
IoT & Automotive Expansion: With increasing compute needs in vehicles and smart devices, Arm’s low-power design edge is unlocking new growth verticals.
📈 Technical Perspective:
We're bullish above the $120.00–$122.00 zone, with an upside target of $270.00–$275.00 based on structural demand growth and strategic diversification.
#ARM #ArmHoldings #Semiconductors #AIStocks #TechStocks #IoT #CloudComputing #ChipStocks #NVIDIA #DataCenter #BullishBreakout

SMCI ready to test the top of the Triangle at $63.50.Supermicro Computer Inc. (SMCI) has been trading within a 1-year Ascending Triangle but since August 06 it has been 'trapped' within its 1D MA50 (blue trend-line) and 1D MA200 (orange trend-line).
A closing above the 1D MA50, technically confirms the new Bullish Leg, targeting the top of the Ascending Triangle a $63.50.
If it then closes a full 1W candle above it, we will have a technical bullish break-out, targeting the All Time High (ATH) at $123.00.
-------------------------------------------------------------------------------
** Please LIKE 👍, FOLLOW ✅, SHARE 🙌 and COMMENT ✍ if you enjoy this idea! Also share your ideas and charts in the comments section below! This is best way to keep it relevant, support us, keep the content here free and allow the idea to reach as many people as possible. **
-------------------------------------------------------------------------------
💸💸💸💸💸💸
👇 👇 👇 👇 👇 👇

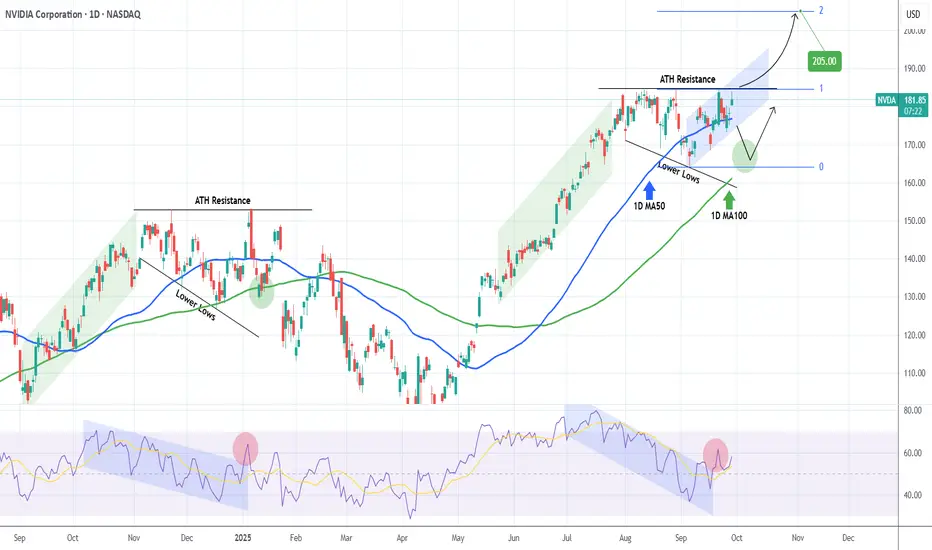
NVIDIA Will it finally make a new ATH?NVIDIA Corporation (NVDA) almost hit today its All Time High (ATH), which is currently its Resistance level. That is technically the top of a Descending Triangle pattern that the stock has been trading in since the start of August.
The last time we saw a similar pattern was during NVDA's previous ATH formation in November 2024 - January 2025. Identical price actions as well as 1D RSI sequences among the two fractals.
Based on that, we should be past a January 07 2025 ATH Resistance rejection, which targeted the 1D MA100 (green trend-line) before the next bounce. As a result, until the current ATH Resistance breaks, we should technically see a pull-back towards $166/67.
This time however, there is a strong case for a ATH break-out as the price is trading within a short-term (blue) Channel Up. As long as this holds, it can keep making Higher Highs, with the next one technically aiming above the ATH Resistance.
In any case, if that level breaks, we expect the price to target the 2.0 Fibonacci extension at just above $200.
-------------------------------------------------------------------------------
** Please LIKE 👍, FOLLOW ✅, SHARE 🙌 and COMMENT ✍ if you enjoy this idea! Also share your ideas and charts in the comments section below! This is best way to keep it relevant, support us, keep the content here free and allow the idea to reach as many people as possible. **
-------------------------------------------------------------------------------
💸💸💸💸💸💸
👇 👇 👇 👇 👇 👇
ARKK: when a breakout isn’t just a breakout-it’s a runway to $91On the weekly chart, ARKK has broken out of a long-standing ascending channel, ending a year-long consolidation phase. The breakout above $71.40, with a confident close and rising volume, signals a transition from accumulation to expansion. The move came right after a golden cross (MA50 crossing MA200), further confirming institutional interest. Price has already cleared the 0.5 and 0.618 Fibonacci retracements — and the 1.618 extension points to $91.40 as the next technical target.
Momentum indicators like MACD and stochastic remain bullish with room to run. Volume profile shows low supply above $75, which could fuel an acceleration toward the target zone.
Fundamentally, ARKK remains a high-beta, high-risk vehicle — but one with focus. The ETF is positioned around next-gen tech: AI, robotics, biotech, and automation. Assets under management now exceed $9.3B with +$1.1B net inflow in 2025. YTD return stands at 37%, and its top holdings (TSLA, NVDA, COIN) are back in favor. This isn’t just a bet on innovation — it’s diversified exposure to a full-blown tech rally.
Tactical setup:
— Entry: market $69.50 or on retest
— Target: $80.21 (1.272), $91.40 (1.618 Fibo)
Sometimes a breakout is just technical. But when there’s volume, a golden cross, and billions backing it — it’s a signal to buckle up.

Gold breaks records and tops out: Where next?Gold achieved a historic breakthrough to $3,759 per ounce, potentially driven by an unusual "barbell strategy" where investors simultaneously bought risk assets while hedging against systemic risks.
On the one hand, continued expectations for two additional rate cuts by year-end supported non-yielding assets. On the other hand, political uncertainty increases as Trump prepares to meet with lawmakers on funding proposals. The probability of a Gov shutdown approaches 70% by October 1st, which would force the FOMC into a 'blind' meeting in October.
Technicals
The short-term setup shows a double top formation at $3,759, suggesting potential consolidation rather than immediate continuation.
Resistance Levels : $3,800 is a critical resistance, both a Fibonacci extension cluster and a psychological level
Support Levels :
Immediate support at $3,740 (breakout confirmation level)
Secondary support at $3,700-$3,730 (previous consolidation zone)
Deeper pullback potential to $3,673 (61.8% Fibonacci retracement)
Wave Structure : Elliott waves suggest completion of a potential Wave 3, with consolidation expected before a possible fifth wave extension toward $3,785-$3,800
Forward Outlook
The setup favours consolidation over the remainder of the week, with key events including Fed Chair Powell's speech and Friday's PCE inflation data serving as potential catalysts for the next directional move.
The momentum divergences suggest limited downside risk from current levels, making any pullback toward $3,700-$3,740 a potential buying opportunity for the anticipated final leg higher toward the $3,800 resistance zone.
Risk management remains crucial given the proximity to potential reversal levels and the unusual nature of gold's correlation with equity strength.
This content is not directed to residents of the EU or UK. Any opinions, news, research, analyses, prices or other information contained on this website is provided as general market commentary and does not constitute investment advice. ThinkMarkets will not accept liability for any loss or damage including, without limitation, to any loss of profit which may arise directly or indirectly from use of or reliance on such information.

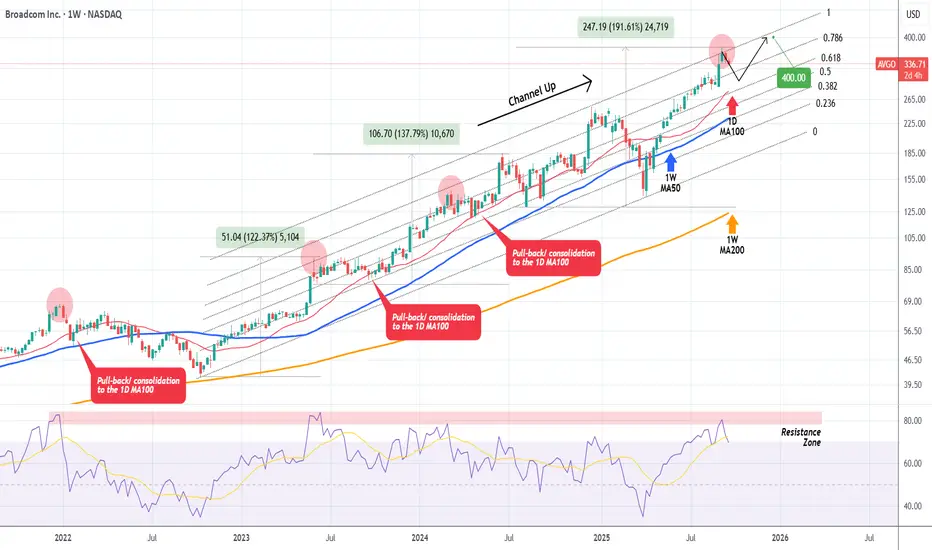
BROADCOM Rejection at the top of 3-year Channel Up possible. Last time we looked at Broadcom Inc. (AVGO) was more than 3 months ago (June 10, see chart below), where we gave a buy signal, targeting $320:
The price is now on the 2nd straight red week after it marginally breached above its 3-year Channel Up, and if it closes in red eventually, we will have a strong technical case for a rejection pull-back.
As you can see, every time the 1W RSI got that overbought and got rejected on its 4-year Resistance Zone, it always corrected back to its 1D MA100 (red trend-line).
Technically that should be the next medium-term buy entry point to finish the year with a $400 Target.
-------------------------------------------------------------------------------
** Please LIKE 👍, FOLLOW ✅, SHARE 🙌 and COMMENT ✍ if you enjoy this idea! Also share your ideas and charts in the comments section below! This is best way to keep it relevant, support us, keep the content here free and allow the idea to reach as many people as possible. **
-------------------------------------------------------------------------------
💸💸💸💸💸💸
👇 👇 👇 👇 👇 👇
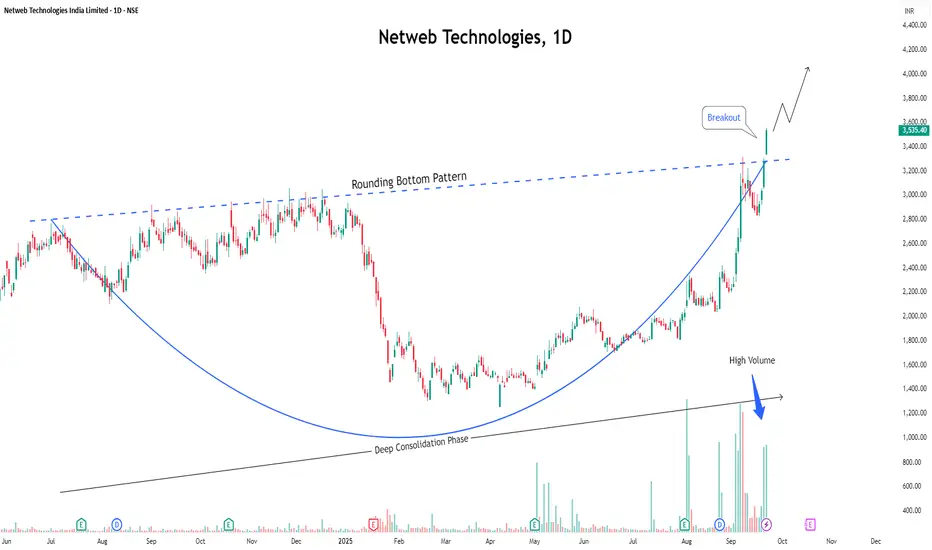
Netweb Technologies: The Backbone of India’s AI RevolutionWhile everyone's talking about AI, Netweb is actually BUILDING India's AI backbone - and the results are spectacular! 📈
What's Happening:
● Stock soared 116% in 6 months (₹1,638 → ₹3,535) 📊
● Just secured ₹450 Cr fresh order (Sep 22) + earlier ₹1,734 Cr NVIDIA deal
● Q1 results were phenomenal - Revenue & PAT both DOUBLED! 💰
Why This Matters:
Netweb is powering India's ambitious AI Mission with high-performance servers and GPU systems. They're not just riding the AI wave - they're the infrastructure making it possible.
The Numbers Speak:
✅ Revenue: ₹301 Cr (+102% YoY)
✅ Profit: ₹30.5 Cr (+101% YoY)
✅ AI Segment: +300% growth
✅ Order book: Strong visibility till FY27
Technical View:
● Fresh breakout confirmed from a rounding bottom, with robust volume support.
● Setup looks primed for another strong rally ahead. 🚀
⚠️ Disclaimer: This is an educational post meant for learning purposes only. Not a stock recommendation.
Domo, Inc. | Bullish Setup Amid Strong AI Momentum📊 Domo, Inc. NASDAQ:DOMO is a cloud-based data intelligence platform helping enterprises manage and visualize data at scale.
☁️ Recent strategic expansions with Snowflake and AWS are enhancing its data integration stack and building out a competitive ecosystem.
🏆 Ranked #1 in Dresner’s 2025 Agentic AI Report, validating Domo’s leadership in AI-powered analytics—key for long-term growth.
📈 Analysts are bullish: 4 Buy ratings, 0 Sell, with a consensus price target of $18.50 (~18.7% upside from current levels).
🔍 Technical View:
• Bullish Above: $14.00–$14.25
• Upside Target: $27.00–$28.00
• Trend: Reversal setup possible with continued institutional support.
This setup offers potential for mid-term upside, especially if bullish volume confirms above the $14.25 pivot zone.
💡 Watching for continuation as AI and data analytics tailwinds accelerate across the enterprise sector.
🔔 Like, follow, and comment if you're watching DOMO too.

META Is this the final rally to $970??Meta Platforms (META) has been rising this month after successfully coming off August's Bull Flag. Technically this is an extension of the very aggressive rebound since the April 07 2025 Trade War bottom. It also took place right above the 1W MA100 (green trend-line).
This is quite similar to the Feb - March 2020 COVID crash, both corrections were -35.39% and -38.52% respectively. At the same time, they were both carried out by Bullish Megaphone patterns with similar 1W RSI sequences.
The Channel Up (green) that followed the COVID crash peaked on its 1.618 Fibonacci extension before turning sideways towards the 1W MA50 (blue trend-line) again.
As a result, given the remarkable symmetry between the two fractals so far, we can expect the current (post Trade War) Channel Up to peak near its 1.618 Fib ext at around $970.00.
-------------------------------------------------------------------------------
** Please LIKE 👍, FOLLOW ✅, SHARE 🙌 and COMMENT ✍ if you enjoy this idea! Also share your ideas and charts in the comments section below! This is best way to keep it relevant, support us, keep the content here free and allow the idea to reach as many people as possible. **
-------------------------------------------------------------------------------
💸💸💸💸💸💸
👇 👇 👇 👇 👇 👇

Nvidia plummets ~3% afterhours! Buy the dip or sell the rally?Nvidia delivered another strong quarter, beating expectations on both revenue and EPS. However, shares dropped after hours to around $175, as data centre revenue narrowly missed forecasts and China sales remained absent due to regulatory uncertainty.
Technically, if NVDA breaks below $175, bears may target the $170 double bottom support in a dead-cat-bounce fashion, with a risk of further downside if that level fails. However, if the stock holds above $179 and reclaims $185, bulls could see a rally toward $193 and potentially $220 in the medium term, which could still materialise after a short-term decline toward $170.
This content is not directed to residents of the EU or UK. Any opinions, news, research, analyses, prices or other information contained on this website is provided as general market commentary and does not constitute investment advice. ThinkMarkets will not accept liability for any loss or damage including, without limitation, to any loss of profit which may arise directly or indirectly from use of or reliance on such information.

IONQ — trend breakout and growth potentialIonQ shares have consolidated above the 47–50 zone and successfully broke the trendline, opening the way for further upside. The first target is set around 120, and if buying pressure continues, the price could extend toward 200. Key support levels are at 47–48 and 36, providing attractive accumulation zones.
From a fundamental perspective, the quantum computing sector is gaining momentum, and IonQ remains one of its leading players. Increasing demand for innovative technologies may support the continuation of the bullish trend in the medium term.
A stock you buy and forget — the longer you hold, the more you earn.

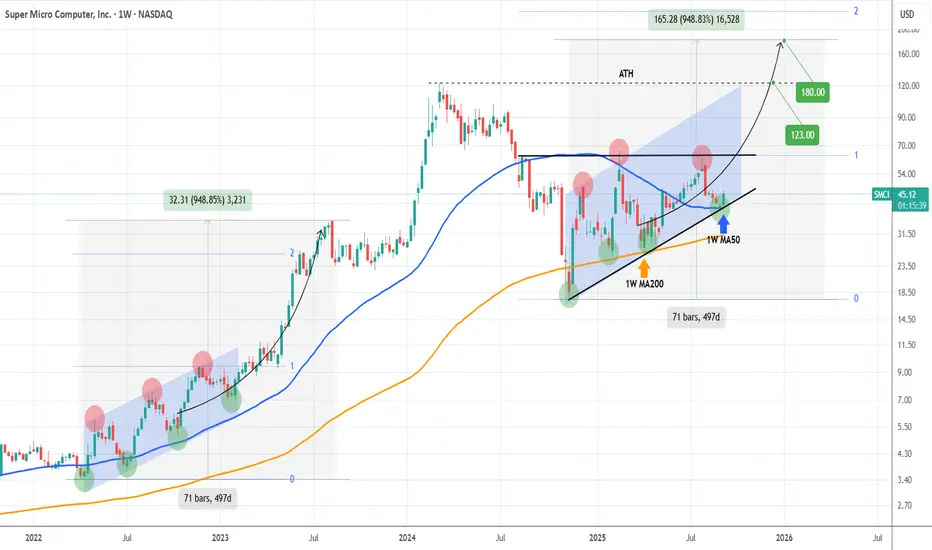
SMCI Rebounding on its 1W MA50 and targeting the ATH.Super Micro Computer Inc (SMCI) hit last week its 1W MA50 (blue trend-line) and this week posts a strong 1W candle. This rebound comes on the Higher Lows trend-line (bottom) of the 1-year Ascending Triangle.
It may not be exactly like the Channel Up of 2022 but it looks like a similar Accumulation pattern that preceded the massive 2023 rally. The Triangle typically breaks to the upside and technically targets the 2.0 Fibonacci extension. This time that would be even higher than the 2023 rise of +948.85%.
In any case that would be our over-extended Target ($180.00), with a more 'reasonable' one being the All Time High (ATH) of $123.00.
-------------------------------------------------------------------------------
** Please LIKE 👍, FOLLOW ✅, SHARE 🙌 and COMMENT ✍ if you enjoy this idea! Also share your ideas and charts in the comments section below! This is best way to keep it relevant, support us, keep the content here free and allow the idea to reach as many people as possible. **
-------------------------------------------------------------------------------
💸💸💸💸💸💸
👇 👇 👇 👇 👇 👇