NVIDIA Massive Cup and Handle targets $200.NVIDIA Corporation (NVDA) is pulling back aggressively following yet another positive Earnings report, where they beat the estimates again but the market is reacting with selling. That has been a 'norm' in the past 12 months but even from a technical standpoint, the price reached the 143.60 Resistance level (made of the February 18 High), so profit taking is technically normal market behavior here.
On the longer term however, this Resistance test potentially forms the top f a very powerful pattern, the Cup and Handle (C&H). At the moment, the market has the support of both the 1D MA200 (orange trend-line) and 1D MA50 (blue trend-line) and the Handle, which has just started, has some room to safely consolidate for a while before the pattern break-out upwards.
Technically, C&H patterns reach their 2.0 Fibonacci extensions after the break-out, so our medium-term Target is set at $200.
Notice also the Bearish Divergence on the 1D RSI, which is similar to that of late October 2024. A break below the 1D MA50 risks the bullish structure on this pattern.
-------------------------------------------------------------------------------
** Please LIKE 👍, FOLLOW ✅, SHARE 🙌 and COMMENT ✍ if you enjoy this idea! Also share your ideas and charts in the comments section below! This is best way to keep it relevant, support us, keep the content here free and allow the idea to reach as many people as possible. **
-------------------------------------------------------------------------------
💸💸💸💸💸💸
👇 👇 👇 👇 👇 👇
Aistocks

C3.AI has bottomed and is targeting $39.00C3.ai (AI) has been trading within a Channel Down pattern since the June 16 2023 High and right now is testing its 1D MA50 (blue trend-line) as Support, following a bottom (Lower Lows) rebound on April 08 2025.
This is technically the start of its new Bullish Leg, even though based on May - August 2024, it may be delayed. On the long-term though, our Target will be the 0.786 Fibonacci retracement level at $39.00.
-------------------------------------------------------------------------------
** Please LIKE 👍, FOLLOW ✅, SHARE 🙌 and COMMENT ✍ if you enjoy this idea! Also share your ideas and charts in the comments section below! This is best way to keep it relevant, support us, keep the content here free and allow the idea to reach as many people as possible. **
-------------------------------------------------------------------------------
💸💸💸💸💸💸
👇 👇 👇 👇 👇 👇

NVIDIA The 1W MA100 rebound is targeting $225 at least.NVIDIA Corporation (NVDA) broke last week above its 1W MA50 (blue trend-line) for the first time in 2.5 months and all this is generated by April's bottom rebound on the 1W MA100 (green trend-line).
The 1W MA100 has been intact since January 23 2023, so this rebound technically initiates a new Bullish Leg. Since the December 2018 bottom (previous U.S. - China Trade War), the minimum rise on such a Bullish Leg has been +156.11%. As a result, NVIDIA can now target $225 at least before the end of 2025.
-------------------------------------------------------------------------------
** Please LIKE 👍, FOLLOW ✅, SHARE 🙌 and COMMENT ✍ if you enjoy this idea! Also share your ideas and charts in the comments section below! This is best way to keep it relevant, support us, keep the content here free and allow the idea to reach as many people as possible. **
-------------------------------------------------------------------------------
💸💸💸💸💸💸
👇 👇 👇 👇 👇 👇

AMD Break-out above this level means new ATH at $300.Advanced Micro Devices (AMD) is on a recovery attempt following the April 07 2025 bottom, which is technically a Higher Low on the 3.5-year Channel Up. This week it broke above the first Resistance level of this attempt, the 1W MA200 (orange trend-line), which is key as it had 2 rejections since February 18 2025.
However the biggest Resistance test is right above it and consists of a strong Cluster of the 1D MA200 (green trend-line), the 1W MA50 (blue trend-line) and the Lower Highs trend-line from the All Time High (ATH).
The previous Bullish Leg of the Channel Up (started on October 10 2022), consolidated for 1 month once it broke above this Resistance Cluster (blue circle) and then marched towards the pattern's Higher High, which was naturally a Higher High.
The similarities between the Legs are striking, the Bearish Legs (both declined by -66.86%) were confirmed by 1W MACD Bearish Cross and the Bullish Legs by a Bullish Cross, which the 1W MACD just completed last week.
This is a major confirmation and technically the earliest for a long-term Buy. Assuming again that the symmetry will continue to hold on this emerging Bullish Leg, we can expect it rise by +318.17% as well. Based on that, our long-term Target on AMD is $300.
-------------------------------------------------------------------------------
** Please LIKE 👍, FOLLOW ✅, SHARE 🙌 and COMMENT ✍ if you enjoy this idea! Also share your ideas and charts in the comments section below! This is best way to keep it relevant, support us, keep the content here free and allow the idea to reach as many people as possible. **
-------------------------------------------------------------------------------
💸💸💸💸💸💸
👇 👇 👇 👇 👇 👇

SMCI hit its 1W MA50, eyes a massive break-out.Super Micro Computer Inc (SMCI) has surged more than +15% today after the company announced a multi-year, $20 billion partnership with Saudi data center firm DataVolt.
Technically that brought it on its 1W MA50 (blue trend-line), the first contact with it since the week of February 18 2025, which was the previous Top. The current rally as well as the one that led to the Feb 18 Top, is fueled by the 1W MA200 (orange trend-line) which held as Support on both occasions.
The driving pattern behind those Bullish Legs is a Channel Up (blue) and this is not the first time SMCI comes across such formation. It was in fact a similar Channel Up that took the stock from the 2022 bottom of the Inflation Crisis and guided it to its new Bull Cycle. That rose by +950% before it pulled back on its first consolidation.
As a result, we have a short-term Target at $80.00 and after a pull-back, long-term Target at $180.00 (+950% from the bottom).
-------------------------------------------------------------------------------
** Please LIKE 👍, FOLLOW ✅, SHARE 🙌 and COMMENT ✍ if you enjoy this idea! Also share your ideas and charts in the comments section below! This is best way to keep it relevant, support us, keep the content here free and allow the idea to reach as many people as possible. **
-------------------------------------------------------------------------------
💸💸💸💸💸💸
👇 👇 👇 👇 👇 👇

Big CUP & Handle .. 100+ for this AI stock
The chart displays a cup-and-handle pattern, a powerful bullish continuation setup. The "cup" formed from $3 to $11.07, followed by a "handle" consolidation near the $11.07 resistance (key level). The stock is poised for a breakout above this level, with the measured move of the pattern projecting a target of $125. This target is calculated by adding the cup's depth ($8, from $3 to $11) to the breakout point ($11.07), scaled on a logarithmic chart, suggesting a potential move to $125 if the breakout is confirmed with strong volume. The curved trendline (blue) provides robust support, reinforcing the bullish trend, while the breakout above the handle’s descending trendline signals momentum.
Fundamental Catalysts:
SoundHound AI is a leader in the conversational AI market, expected to grow to $49.9B by 2030 (CAGR 30.2%). Strategic acquisitions (Amelia, SYNQ3, Allset) have expanded its reach in restaurant and enterprise AI, adding clients like Chipotle and White Castle. Partnerships with Tencent, Stellantis, and Hyundai integrate its voice AI into global automotive markets, while a $1.2B revenue backlog ensures long-term growth. Q4 2024 revenue soared 101% to $34.5M, with 2025 projected at $157–$177M (97% growth). With 270+ patents, a $246M cash reserve (no debt), and a path to positive EBITDA by late 2025, SoundHound is primed for significant market share gains.

NVIDIA: Don't turn your back on the A.I. darling yet.NVIDIA has turned neutral on its 1D technical outlook (RSI = 48.902, MACD = -2.040, ADX = 28.815) as it has recovered a portion of the 2 month correction. April's low was exactly on the 1W MA100 just like the Low of the 2024 consolidation phase has been near the 1W MA50. The pattern is recurring and the rallies naturally get weaker each time as we approach the end of the Cycle this year. The 1st rally was +358%, the 2nd +257% so the 3rd one now is expected to be +157%. That gives a $225 target. The next Top will most likely start a new correction (Bear Cycle) for a 3rd Bottom on the 1W MA200.
## If you like our free content follow our profile to get more daily ideas. ##
## Comments and likes are greatly appreciated. ##

Nauticus Robotics - The Roaring $KITTNauticus Robotics ( NASDAQ:KITT ) is a picture-perfect pick-up for the coming market conditions. With capital about to be re-allocated into markets, following the month long sell-off of late and rotation into precious metals/bonds.
Technicals
Already broken-out of its downwards wedge pattern on high volume, NASDAQ:KITT recently just put in a double bottom.
If the initial move from December 19th to 6th January, was an Elliott Wave 1, I would wait & prepare for volatility to come, and if to the upside it will put some of the most volatile cryptocurrency tokens to shame.
Wave 2 should now be complete, having bottomed on March 4th. Friday March 14th should have been the completion of its 1st higher low.
As early as next week, I am expecting NASDAQ:KITT to reach $2.80. This coincides with the 0.618 fibonacci level, resulting from its recent decline. From there, a shallow retrace into the end of the month before catapulting itself to levels not seen since September 2023 at around $80.
That would conclude Wave 3, the most volatile of moves in Elliott Wave theory, between May and June. Reaching the 2.272 fib level at $80.
The entire move can reach a final impulse conclusion of around $155 of the 2.618 fib level 👀. A potential 150x in just a few short months.
-----
Fundamentals
Nauticus Robotics is creating an entirely new industry right before our eyes. They are pioneers and future monopolists for the underwater economy, just like Tesla are becoming to battery, automation & automotive technology.
Think deep-sea oil refining, precious metal mining, environmental studies and even underwater city construction. Combined with a domestic administration that for the first time in decades is supportive of such novel energy & infrastructural investments.
For those expecting an AI bubble to soon take hold of markets, this stock is arguably one of the few companies that could simply not exist without artificial intelligence. Thanks to this new technology, it opens up commercially and fundamental new opportunities to deploy unmanned robotics deep into our oceans, for days at a time without costly supervision.
Currently (at $1.06) with a market cap of $6.79 million , there is far too much upside to this stock. One that employs dozens of ex-NASA engineers.
This stock is one of the 100 most highly shorted stocks on markets. With RICO and an administration hostile towards & actively investing such practices, this stock is likely to undergo a swift revaluation.
All of this combined, suggests to me the ocean tide is on your side with $KITT.

NVDA Short Term BuyPrice is currently consolidating within a tight range, and a breakout appears imminent. I am looking for a clean break above resistance, followed by a retest of the breakout level, which could provide a strong buy opportunity. If this setup plays out, the next key target would be the $135 level.
However, this move is likely to be a short-term retracement within a larger downtrend. If price struggles to sustain momentum above $135 and shows signs of weakness, it could indicate a continuation of the broader bearish trend. Confirmation will come from price action signals and volume dynamics on the retest.

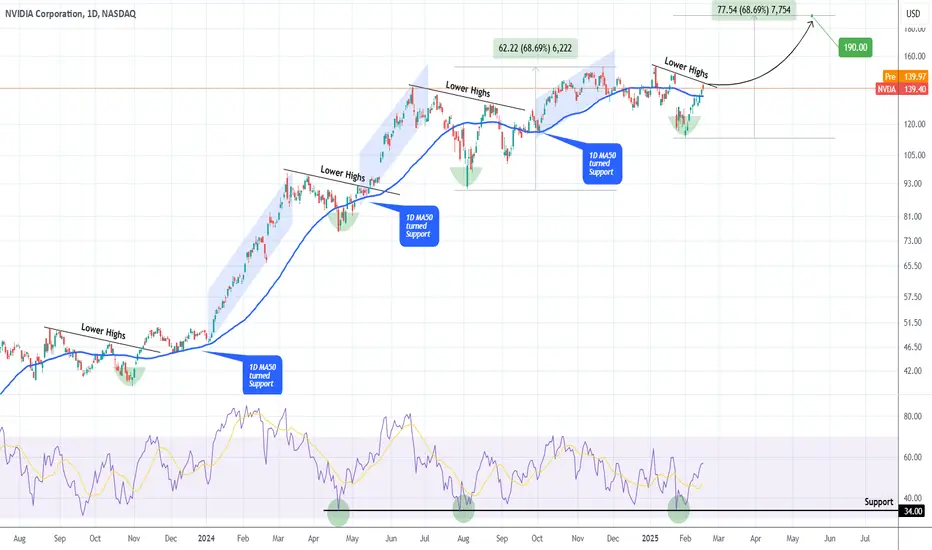
NVIDIA Rejected on the most important Resistance of all.Last time we looked at NVIDIA Corporation (NVDA) was just 20 days ago (January 29, see chart below) but we managed to get the exact bottom buy opportunity on the 1W MA50:
As the stock reacted with an immediate and relentless rally of 10 straight green 1D candles, it hit yesterday its first hurdle, the All Time High (ATH) Lower Highs trend-line and closed in red.
This Lower Highs trend-line is historically very important as every time a similar technical structure broke in the past 2 years, a strong rally followed. The early ones were stronger, which is natural to expect as the company was recovering from the 2022 Inflation Crisis and had enormous room to grow. On a side-note, the 1D RSI rebounded on its 34.00 Support, where the stock's last two bottoms were priced.
As a result, we believe that if NVIDIA breaks and closes above the current Lower Highs trend-line, it should at least repeat the last rally from its bottom (+68.69%), which translates to a $190 medium-term Target.
-------------------------------------------------------------------------------
** Please LIKE 👍, FOLLOW ✅, SHARE 🙌 and COMMENT ✍ if you enjoy this idea! Also share your ideas and charts in the comments section below! This is best way to keep it relevant, support us, keep the content here free and allow the idea to reach as many people as possible. **
-------------------------------------------------------------------------------
💸💸💸💸💸💸
👇 👇 👇 👇 👇 👇
China's kicked off Year of the Snake: Trade War Meets AI Rally China's Markets in 2025: Trade War Meets AI Rally 🐍📊
1/9
Chinese stocks kicked off the Year of the Snake with mixed signals. Trade tensions with the U.S. are rattling markets, while AI-sector hype led by DeepSeek is lifting tech stocks. 🛑⚡ Will AI innovation outshine trade fears?
2/9
After a holiday break, mainland Chinese markets opened under pressure. The Shanghai Composite Index (SSE $000888) struggled to gain momentum, reflecting concerns over new U.S. tariffs. 📉 Trade wars continue to haunt global markets.
3/9
Meanwhile, Hong Kong-listed Chinese stocks rallied strongly despite tariff risks. Investors remain optimistic about cross-border business resilience and opportunities in tech. 🏢📈
4/9
Currency Stability: The firm fixing of the yuan signals that Beijing is stepping in to manage volatility. Stability in currency markets is crucial for maintaining investor confidence. 💴 Will this intervention calm the storm?
5/9
Trade tensions escalated with new tariffs from the Trump administration. While the measures were less severe than feared, the negative sentiment still weighed on broader market performance. ⚖️ What’s next for U.S.-China trade talks?
6/9
On the upside, the AI sector surged. Buzz around DeepSeek—a rising Chinese AI player—sparked gains in tech giants like Alibaba ( NYSE:BABA ) and Baidu ( NASDAQ:BIDU ). 🚀 AI is becoming a crucial driver of China’s economic narrative.
7/9
Technical Watch:
Shanghai Composite Index (SSE $000888): A bellwether for China's economic sentiment.
CSI300 ($000300): Captures performance across top Chinese blue chips, reflecting key market trends.
8/9
Chinese tech giants like Alibaba and Baidu are riding the AI momentum, but the backdrop of geopolitical and regulatory risks could temper gains. 📊 Can AI innovations outweigh trade turbulence in 2025?
9/9
What’s your outlook on China’s markets this year? Vote now! 🗳️
Bullish: AI-led rally continues 🐂
Neutral: Trade volatility offsets gains ⚖️
Bearish: Trade war worsens 🐻

PALANTIR Target $110 then wait for correction.Palantir Technologies (PLTR) is repeating the January pattern that has been seen in both 2024 and 2023, which has the price rising by +72.50% for a peak. This gives us a $110 immediate Target, which should be relatively easy to achieve after such Earnings.
Once the peaked on this mark, the 2024/ 2023 fractals pulled back to the 0.618 Fibonacci retracement level before turning into a long-term buy opportunity again in preparation for the next Bullish Leg. As a result, after $110 is hit, our next buy level will be near $80.
-------------------------------------------------------------------------------
** Please LIKE 👍, FOLLOW ✅, SHARE 🙌 and COMMENT ✍ if you enjoy this idea! Also share your ideas and charts in the comments section below! This is best way to keep it relevant, support us, keep the content here free and allow the idea to reach as many people as possible. **
-------------------------------------------------------------------------------
💸💸💸💸💸💸
👇 👇 👇 👇 👇 👇

$NVDA - Resilience in ActionNASDAQ:NVDA
In my previous post (linked above) I noted the amount of macro upwards pressure NASDAQ:NVDA
Even with the market becoming leary of (or noticing other A.I. developer options), NASDAQ:NVDA still just makes the HARDWARE that these A.I. models are able to use and abuse in order to perform better. NASDAQ:NVDA will continue to create great hardware, and continually iterate on the items that will continue to make A.I. great.
My recommendation? Continue to hold, and buy at these lower levels. NASDAQ:NVDA will continue to rise.

PHUN Long Trade Expecting Continuation PHUN is in the advertizing business specializing in targeting consumers with smart filterning of
the ads tailored to their websurfing and data history. That said, it competes with Google,
Facebook, Snapchat and all the rest. it is far more volatile than them as a small cap company.
The trade is in capturing the volatility.
On a 120-minute chart, PHU was in a state of dormancy and almost no range in late 2023
but awoke in the current year. The all-the-highs are in the 80 range back in 2022. From the
highs of January to the recent low on March 1st, PHUN dropped more than 70% in 40 days or so.
On the chart, it has broken out of deep undervalued territory and is not situated near the
anchored mean VWAP and is at the POC line of the volume profile. It traded nearly 70
million shares about 20X the running average. I see this as an opportunity for a long
trade at or near the VWAP where institutionally based traders are likely to trade. The
volume and volatility make this obvious. A similar combination of volume and volatility last
occurred about January 16 and propelled the price more than 250% in 4 days. While a similar
move should not be expected, even 50% in 4 days is an excellent return for the risk taken.
I will set a stop loss of 10% for this volatile stock while targeting 18 and 22 from the VWAP
band lines on the chart.

Broadcom - This Chart Tells Us Everything!Broadcom ( NASDAQ:AVGO ) is retesting massive resistance:
Click chart above to see the detailed analysis👆🏻
For roughly a decade, Broadcom has been trading in a quite obvious rising channel pattern, perfectly rejecting the lower support trendline back in the end of 2022. After the recent rally of more than +200%, it is quite likely that we will now see a substantial move lower from here.
Levels to watch: $250, $150
Keep your long term vision,
Philip (BasicTrading)

C3.AI Is it the new PALANTIR?Last time we made an analysis on C3.ai (AI) (September 06 2024, see chart below), we gave a strong buy signal that not only did it successfully hit our $28.50 Target but also broke above the 1.5 year Channel Down:
The pattern that has emerged and looks to be what might place the strongest pressure moving on, is a Channel Up, starting from he December 2022 bottom. By early February we should also have formed the first Golden Cross on the 1W time-frame and that alone can apply high buying pressure.
Technically, the next obstacle for the stock to overcome is the Resistance Zone from the 2021 consolidation, which priced the previous High of June 2023. If the 1W MA50 (blue trend-line) holds and pushes the price above the Zone, we expect an aggressive push towards potentially the All Time High (ATH) of the stock, much like Palantir did on its own break-out. A more modest technical Target before that however, would be $130.00.
-------------------------------------------------------------------------------
** Please LIKE 👍, FOLLOW ✅, SHARE 🙌 and COMMENT ✍ if you enjoy this idea! Also share your ideas and charts in the comments section below! This is best way to keep it relevant, support us, keep the content here free and allow the idea to reach as many people as possible. **
-------------------------------------------------------------------------------
💸💸💸💸💸💸
👇 👇 👇 👇 👇 👇

$NYSE:BBAI Double and Triple Bottoms with positive indicatorsThanks to @Money_Wins_Honey for getting this on my radar.
NYSE:BBAI is showing double and triple bottoms in the weekly as well as daily chart. The price targets are $8.43 and $12.96.
Here are my positives that support this trade:
The volume has been really going through the roof
Williams %R it tracking higher lows
It's in the AI space so it's HOT right now
Entry Points:
Higher Risk - Now, and place a stop below $3.00 (that's the current shelf that's being formed)
More conservative - wait until after breaking the double bottom resistance line (closing above $4.81)
Exits:
Double Bottom PT - $8.43
Triple Bottom PT - $12.96
Good Luck!

C3.AI is allergic to $35! 55% UPSIDEC3.AI - NYSE:AI 🤖
All the bad news, downgrades, and FUD!
THEY STILL CAN'T GET THIS NAME UNDER $35!
5 WEEKS in a row of wicking off of $35 friends!
DO I REALLY NEED TO TELL YOU HOW BULLISH THAT IS OR CAN I STOP USING ALL CAPS BC YOU GET IT!
🎯$39🎯$46🎯$49🎯$58
Not financial advice

AI DEC 11 2024 BULLISHAI is looking bullish &it should continue HH HL structure on daily till the purple box.
This is price action and targets should be $61ish.
Let me know if you have any questions

C3.AI: Waiting for this huge buy breakout signal.C3.ai is on a neutral technical outlook both on the 1D and 1W timeframes (RSI = 51.525, MACD = -0.010, ADX = 22.326) as it is trading around the 1W MA50 for 5 straight weeks. This sideways price action is approaching the top of the June 2023 Channel Down, which on the greater scale technically looks like a giant Bull Flag. For the first time in its history, the 1W MA200 is at 33.00 and falling. A test of the top of the Channel Down may coincide with a 1W MA200. This is the level that separates the long term bearish from bullish trends. If it breaks we will go long and target the R1 level (TP = 49.00).
## If you like our free content follow our profile to get more daily ideas. ##
## Comments and likes are greatly appreciated. ##

chip stocks still shocked but uptrend intactid still not short this stock and look to buy higher lows in this and other semiconductor names. the tech rally and ai boost have really made a lasting impact on this stock. if we remain above the marked out levels or break out to new highs id shoot for above $152 soon.

NVDIA Don't miss this opportunity. Can even reach $240.NVDIA (NVDA) gave us the most solid buy entry back on our August 08 signal (see chart below), following a -35% decline:
Such declines are standard technical buy opportunities especially when taken place at the bottom (Higher Lows trend-line) of the 2-year Channel Up (since October 2022). As you can see, the stock made new All Time Highs (ATH) and as it remains below the middle of the Channel, the upwards potential is significant.
As long as the 1D MA200 (orange trend-line) supports, we remain bullish on our original long-term Target ($190.00) but now we feel confident to target by the start of 2025 the upper layer of the pattern, setting Target 2 at $240.00 (Fibonacci extension 3.0).
Note also that, as mentioned on our previous analysis, the current Bullish Leg continues to look very similar to the one that bottomed on October 2022. This is also evident on their 1D RSI fractals.
-------------------------------------------------------------------------------
** Please LIKE 👍, FOLLOW ✅, SHARE 🙌 and COMMENT ✍ if you enjoy this idea! Also share your ideas and charts in the comments section below! This is best way to keep it relevant, support us, keep the content here free and allow the idea to reach as many people as possible. **
-------------------------------------------------------------------------------
💸💸💸💸💸💸
👇 👇 👇 👇 👇 👇

Nvidia Stock Analysis: Demand for AI Chips Fuel Bullish MomentumNvidia’s meteoric rise in 2024 has been nothing short of remarkable, fueled by the surging demand for its AI chips. Nvidia CEO Jensen Huang described this demand as "insane" during an interview with CNBC, sparking even more excitement around the chipmaker’s stock. As of Thursday's premarket trading, Nvidia shares are up 1.91%, and all eyes are on the company’s continued growth potential.
Insane Demand and Strategic Partnerships
Nvidia (NASDAQ: NASDAQ:NVDA ) has emerged as a global leader in AI infrastructure, with its next-generation Blackwell AI chips driving much of the growth. Huang's comments highlight the unprecedented demand for these AI chips as companies across various industries race to build out their AI capabilities. Nvidia’s strategic partnership with IT consulting firm Accenture is another critical factor driving growth. The collaboration aims to help businesses implement AI-powered solutions using Nvidia’s cutting-edge technology, further extending Nvidia’s reach into the enterprise AI market.
This partnership underscores Nvidia’s ability to build an ecosystem of AI-driven businesses, drawing comparisons to tech giants like Microsoft and Oracle. By expanding its AI infrastructure, Nvidia is ensuring its long-term dominance in the AI space, and investors are responding in kind. Nvidia’s stock has surged 140% year-to-date, far outpacing expectations.
Strong Financial Performance
Nvidia’s financials remain impressive. The company has consistently outperformed Wall Street’s projections, driving a rally in its stock price and contributing significantly to the broader market rally in the S&P 500. The expanded partnership with Accenture further solidifies Nvidia’s position as a dominant force in the AI landscape. Additionally, demand for AI chips from companies and governments alike continues to rise, making Nvidia the go-to choice for building AI infrastructure.
Nvidia’s massive year-to-date gains have been driven by demand across various sectors for AI solutions, cementing its place at the center of the AI revolution. This success is only expected to continue as Nvidia rolls out more advanced chips and expands its partnerships.
Technical Outlook
From a technical perspective, Nvidia’s stock is showing signs of even further upside potential. After peaking in June, NASDAQ:NVDA has been consolidating within a symmetrical triangle pattern—a classic chart formation that suggests a period of consolidation followed by a significant move in the direction of the prevailing trend.
This pattern is a bullish signal, especially given Nvidia’s already strong uptrend in 2024. If Nvidia’s stock breaks above the triangle's resistance level, the technicals point to further upside. Key price targets to watch are $128 and $139
### **Support Levels: Key Breakdown Area to Watch**
Despite Nvidia’s strong bullish momentum, it’s important to consider potential downside risks, particularly in light of the stock’s history of price fluctuations. The key support levels to watch are $110 and $97, which aligns with a trendline linking the March peaks and the 200-day moving average. This area could provide a safety net if Nvidia (NASDAQ: NASDAQ:NVDA ) faces short-term selling pressure.
Conclusion
Nvidia paints a compelling picture for long-term investors. The ongoing surge in demand for AI chips, coupled with Nvidia’s strategic expansion into enterprise AI through partnerships like the one with Accenture, sets the stage for continued success.
With Nvidia’s stock forming a bullish symmetrical triangle pattern and key price targets pointing to significant upside, now may be the time for investors to ride the wave of this AI-powered growth story. However, investors should also be mindful of potential support areas in the event of short-term volatility. All in all, Nvidia (NASDAQ: NASDAQ:NVDA ) is primed for continued dominance in the AI chip market, and the stock's technicals suggest there's more room to run.
