Pattern Recognition: When Human Eyes Beat AI (And Vice Versa)
Humans are extremely good at:
Seeing context – earnings, news, macro backdrop
Interpreting imperfect structures – patterns that are "close enough"
Integrating non‑price information – sentiment, positioning, narrative
Your brain doesn't just see candles. It sees:
"This breakout is happening after a long base in a strong sector"
"This double top is forming into bad macro data"
That's powerful — but it's also where bias sneaks in.
The Machine's Pattern Edge
AI and algorithms are extremely good at:
Applying the same rules to every chart, every time
Scanning thousands of symbols and timeframes
Measuring pattern statistics across huge samples
Where we say "this looks like a flag", AI says:
Length: X bars
Pullback depth: Y%
Breakout follow‑through: average Z%
That objectivity is exactly what humans lose when they care about a trade.
When Humans Win, When AI Wins
Context‑Heavy Patterns (breakouts into news, sector flow, macro themes)
Human advantage: you can weigh "should this pattern even matter here?"
Simple, Repetitive Structures (candlestick patterns, basic ranges)
AI advantage: it will find and log them the same way at scale.
Fuzzy, Subjective Lines (trendlines, channels)
Best as collaboration: AI can test many definitions, you decide which make sense.
The future isn't about proving humans "better" or AI "better". It's about giving each the jobs they're built for.
A Practical Human + AI Workflow
Let AI Scan
Use screeners or pattern tools to surface potential flags, wedges, ranges, reversals.
Apply Human Context
Filter based on news, sector, macro, and your playbook.
Use AI Again for Confirmation
Check volume, volatility, and historical stats for similar patterns.
Execute Systematically
Turn your pattern rules into clear conditions; automate where possible.
In the AI Era, Know Your Role
Your edge as a human isn't out‑calculating the machine. It's:
Defining what "quality" patterns look like in your framework
Deciding which AI signals to care about and which to ignore
Bringing discipline and risk management to whatever patterns you trade
Let AI do the heavy lifting on scanning and counting. Save your limited attention for the handful of setups that truly deserve it.
Aitrading

AI Trading: The Revolution You Can't IgnoreThe Era of AI Trading Has Arrived And It's Only Getting Started
Forget the movie version of AI glowing red eyes flawlessly predicting every tick. The real story is colder, quieter, and way more powerful:
We are moving from a world where humans look at charts to a world where machines digest every tick, every candle, every flow of data… and feed you the edge you couldn't see on your own.
Right now, as you read this, AI is already sitting inside:
Execution algorithms routing institutional orders across venues
Risk engines stress testing portfolios in milliseconds
News and sentiment scanners parsing thousands of headlines a minute
Retail tools that turn a paragraph of English into working NYSE:PINE Script
This isn't science fiction. This is the baseline. And the baseline is rising.
The traders who survive this decade won't be the ones fighting AI. They'll be the ones partnering with it.
So What Exactly Is "AI Trading"?
At its core, AI trading is simply using algorithms that can learn from data to make parts of the trading process smarter.
That can mean anything from a small script that filters charts for you, all the way up to full stack systems managing billions. The spectrum looks like this:
AI Assisted Analysis You still click the buttons, but AI does the heavy lifting.
Pattern recognition on charts (trend, ranges, breakouts)
Scanning hundreds of symbols for your exact conditions
Sentiment analysis on news and earnings headlines
Idea generation: "Show me all large‑cap stocks breaking out with above‑average volume"
AI‑Generated Signals The machine tells you what it would do; you decide whether to listen.
Multi‑indicator models that output clear long/short/flat signals
Quant models that score each asset from 0-100 based on your rules
Bots that push alerts when high‑probability setups appear
Fully Automated Trading The system trades end‑to‑end while you supervise.
Execution from signal → order → risk control with no manual clicks
Self adjusting position sizing and risk controls
Strategies that re‑train on fresh data as regimes shift
Wherever you are on that spectrum, you're already in the AI game. The question isn't "Will I use AI?" it's "How deeply will I let it into my process?"
How AI Actually "Sees" the Market
Humans see a chart. AI sees a dataset.
Human view:
One instrument at a time
A couple of timeframes
A handful of indicators you like
Heavily filtered through emotion and bias
AI view:
Thousands of symbols at once
Dozens of timeframes and derived features
Years of historical data compressed into patterns
Zero fear, zero FOMO, zero boredom
Feed a model clean data and it can uncover:
Regimes you feel but can't quantify (trend, chop, grind, panic)
Relationships between assets that hold statistically
Behavioral patterns like "late‑day reversals after gap‑up opens"
Execution patterns in the order book around key levels
But here's the crazy part: AI is completely unforgiving about your assumptions.
If the data is noisy, biased, or poorly structured, the model will happily learn the wrong thing and apply it with perfect discipline. "Garbage in, garbage out" gets amplified at machine speed.
The Era We're Entering: Human + AI, Not Human vs AI
Over the next decade, expect three shifts to accelerate:
From Intuition First → Data‑First
Traders will still have hunches, but they'll validate them against hard data.
Instead of "this looks extended", you'll ask the system: "How often do moves like this actually continue?" and get an answer in seconds.
From Single‑Indicator Thinking → Multi‑Signal Models
No more worshiping one magic oscillator.
AI will blend technicals, fundamentals, flows, and sentiment into a unified view.
From Static Systems → Adaptive Systems
Instead of one set of parameters forever, models will adapt as volatility, liquidity, and structure change.
Think of it as a trading playbook that rewrites itself when the game changes.
Technologies like larger language models, specialized chips, and eventually quantum‑accelerated optimization won't magically "solve" markets, but they will make it cheaper and faster to test ideas, build systems, and manage risk.
The edge shifts from "Can I code this?" to "Can I ask the right questions, define the right constraints, and manage the risk around what the models tell me?"
Where You Fit In As a Trader
In the era of AI, your job becomes less about staring at every tick, and more about designing the rules of the game your tools play.
You define what "good" trades look like.
You choose which markets, timeframes, and risks matter.
You decide when a model is behaving, and when it's time to shut it off.
AI gives you:
Speed: scanning what you could never cover alone
Consistency: executing the plan without emotional drift
Feedback: showing you what really works in your own data
You bring:
Context: macro, narrative, and common sense
Values: what risks you refuse to take
Adaptability: knowing when to step back or switch regimes
Put together, that's where the edge lives.
Getting Started in the AI Era (Without Getting Overwhelmed)
You don't need a PhD, a server rack, or a lab full of quants. You can start small and intelligent:
Audit Your Current Process
Where are you slow? (Scanning, journaling, testing?)
Where are you emotional? (Entries, exits, sizing?)
Those are prime targets for AI assistance.
Add One AI Tool at a Time
Maybe it's an AI screener.
Maybe it's an NYSE:PINE Script assistant that helps you code and backtest.
Maybe it's a journaling tool that tags your trades automatically.
Learn to Read the Data Behind the Magic
Look at win rate, drawdown, expectancy.
Compare AI filtered setups to your old ones.
Keep what clearly improves your edge; drop the rest.
Respect the Risks
Over‑fitted models that look perfect on the past.
Black‑box systems you can't explain.
Over‑reliance on automation with no kill switch.
Is AI Going to Take Over Trading Completely?
In some corners of the market, AI and automation already dominate . High‑frequency execution, index rebalancing, options market‑making, these domains are machine territory.
But markets are more than math. They are human fear, greed, regulation, politics, liquidity constraints, structural changes and unexpected shocks. That messy mix is exactly where human oversight still matters.
The most realistic future isn't "AI replaces traders" it's AI replaces undisciplined, unstructured traders who bring nothing but guesses to the table.
Traders who can think in systems, understand risk, and collaborate with machines? They don't get replaced. They get leverage.
Your Turn
Where are you right now in this evolution?
Still fully manual, doing everything by hand?
Using a few AI assisted tools but not trusting them yet?
Already running bots and systematic strategies?
What part of AI trading are you most curious or skeptical about?
And the big question: Do you think the future of trading belongs to AI, or to traders who know how to use it?
Drop your thoughts in the comments this era is just beginning.

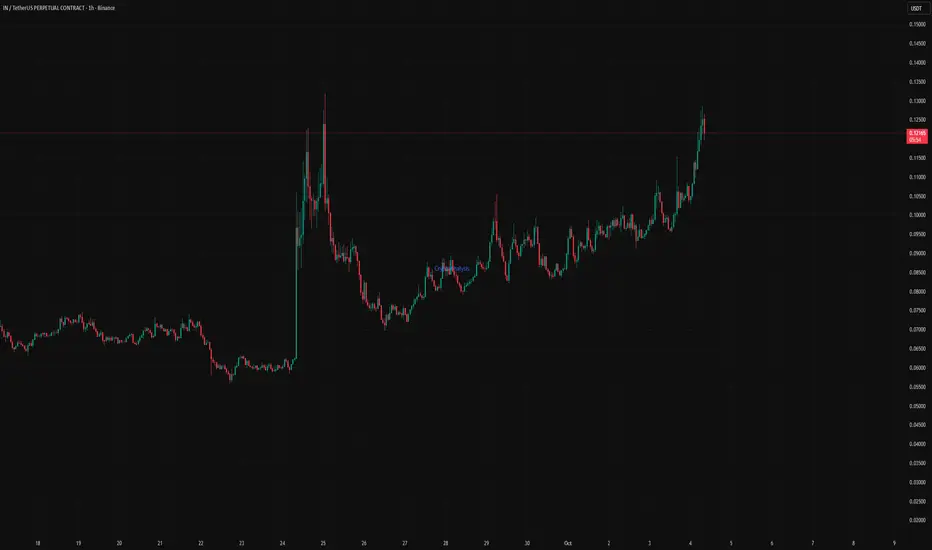
$IN — Agentic DeFi Awakening | Momentum Building for $1
Infinit Labs is gaining strong traction across both technicals and fundamentals — fueled by the rise of Agentic DeFi and upcoming reward distributions.
Key Points:
24H Pump: +75% gain, reaching new all-time highs at $0.1256.
Volume Surge: IN volume up significantly, signaling renewed retail and institutional attention.
Strong Narrative: Backed by Electric Capital, Mirana, and Hashed — Infinit is pioneering AI-powered DeFi Intelligence where agents execute on-chain strategies autonomously.
Catalysts Ahead: Season 2 rewards distribution and a “big announcement” expected within 48h could drive continued upside.
Technical Breakdown
Trend: Bullish continuation confirmed after a breakout from consolidation near $0.09.
EMAs: Price trading well above EMA20 and EMA50 — short-term momentum remains intact.
Volume Profile: Increasing buy-side pressure on dips; consistent higher lows forming.
Targets:
Short-term: $0.18 – $0.22 (Fib extension zone)
Mid-term: $0.35 – $0.50 if momentum and liquidity sustain
Long-term: $1 psychological target, aligning with growing adoption and token utility
Support Levels:
$0.10 (retest zone / former resistance)
$0.085 (EMA50 confluence)
$0.065 (bullish invalidation zone)
Fundamental Context
Utility: Staking IN earns protocol fees, unlocks premium AI-agent features, and grants governance rights.
Ecosystem Growth: “Attention-based tokenomics” will reward users and creators based on real DeFi agent usage — aligning token value with utility and engagement.
Tokenomics: 1B max supply, 49.5% reserved for community and ecosystem incentives over 4 years — fostering long-term sustainability.
Conclusion
IN is transitioning from a stealth narrative to a mainstream Agentic DeFi play. With strong technical momentum, on-chain utility, and a rapidly growing community, the setup remains favorable for continuation toward $0.2+ in the short term and potentially $1 in the coming months if catalysts deliver.
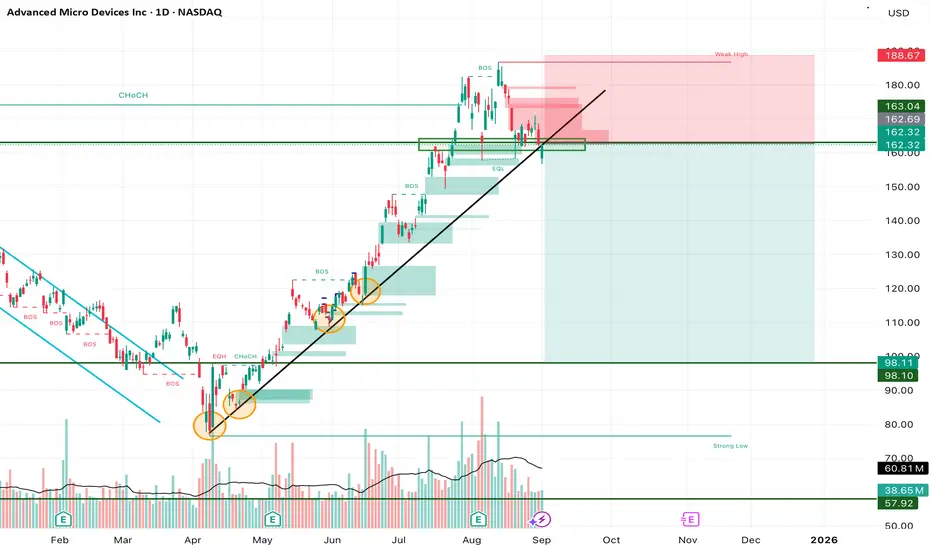
AMD Trendline Break – Short-Term Weakness, Long-Term AI Power PlAMD has broken below its long-standing ascending trendline, which has been respected multiple times since April. This is the first real sign of weakness after months of steady upside. The $162–165 zone, once strong support, is now acting as resistance. Unless bulls can reclaim this area quickly, AMD risks sliding lower toward $150 or even deeper levels.
Technical View:
• Trendline: Broken on daily chart → bearish short-term shift.
• Resistance: $162–165 (former support), $186–187 (weak high).
• Support Levels: $150 psychological, then $135–140 range.
• Indicators: RSI softening, MACD negative, short-term MAs leaning bearish.
Fundamental Backdrop:
Despite this technical weakness, AMD’s long-term story remains strong. HSBC recently upgraded AMD with a $200 price target, citing its MI350 AI chips that rival Nvidia’s Blackwell GPUs. The MI400, due in 2026, could expand GPU sales to $20B by 2028. Melius Research also raised its target to $175, highlighting AMD’s AI trajectory. Fundamentally, AMD is building momentum as a serious competitor in the AI chip race.
Trade Setup (Swing Idea):
• Entry Zone: $162–165 rejection area.
• Stop Loss: Above $188 (weak high).
• Take Profit 1: $150 (psychological level).
• Take Profit 2: $135–140 demand zone.
• Long-Term Accumulation: Any dip below $150 could be a strategic buy for investors with a $175–200 upside target in the AI cycle.
My View:
Short-term, the break of trendline favors bears — I’m watching for a retest of $162–165 to confirm resistance. Medium-term, I see pullback opportunities. Long-term, AMD’s AI roadmap gives conviction that dips should be accumulated rather than feared.
(Not Financial Advice) NASDAQ:AMD
How to Use AI for Crypto Trading (The Right Way)lemme answer real quick: YOU DON’T.
Most traders using AI in crypto are straight up doing it wrong.
Here’s the usual story:
They open ChatGPT and ask,
“Hey… uhm… tell me which altcoin will 100x… Bruh, I heard you know everything, bet you know the next 10x coin!”
ChatGPT confidently replies,
“Sure, buy this coin right now…”
And the trader’s like,
“Ok, thanks.”
Then they jump on Binance, smash that buy button, and lose money faster than you can say ‘left trading’.
Don’t be that guy. Tools like ChatGPT weren’t made for this wild crypto jungle. Crypto’s a messy, super risky market, and ChatGPT’s language models mostly have old info anyway. They can’t give you solid, grounded analysis of what’s really going on — on-chain or across exchanges.
BUT, if you wanna cut through the hype and dodge the FOMO, this quick guide is for you. I’ll show you how to use AI the right way — with real on-chain and off-chain data, and special AI agents built specifically for crypto research.
Wanna keep going? Cool, let’s dive in. If not, peace out and don’t waste your time.
1. Use AI That Actually Processes On-Chain and Off-Chain Data
Real AI power kicks in when you talk about scale — thousands of tokens, millions of wallet moves, shifting stories everywhere. Humans can’t keep up, but AI can process it all instantly, in real time.
Look for AI tools that analyze stuff like:
Wallet behavior and how smart money moves.
Token velocity and decentralized exchange volumes.
Social sentiment from Twitter, Reddit, Discord, Telegram.
Developer activity, governance updates, protocol changes.
How market narratives pop up and spread.
2. Use AI Agents Made Just for Crypto Research
Crypto’s not like stocks or forex. It’s faster, fragmented, and shaped by both on-chain wallet moves and off-chain communities.
That’s where specialized AI agents shine. They understand stuff like:
How wallets behave during airdrops.
How Telegram groups hype early projects.
How dev activity correlates with price moves.
Instead of raw data dumps, these crypto-native AI agents spot patterns that’d take humans days to find. Like spotting when big wallet clusters start accumulating in a new ecosystem, or when a protocol suddenly blows up on social media.
3. Combine Research & Automation for Full-Spectrum Edge
I’m personally pumped about this part. Imagine an AI agent tracking low-cap funds moving into Telegram channels, running sentiment analysis, then tracking smart wallets accumulating tokens (even mixing in technical analysis).
Finally, it finds your risk management , sets triggers, and helps you enter trades with clear stop-loss and target levels.
Quick heads-up: Because of TradingView’s house rules, I can’t drop any links here — you gotta search and find your best AI tools on your own.
Remember : The only way to survive this market is to stay skeptical , watch risk management like a hawk, and keep your head cool. So if you feel FOMO creeping in or money management slipping — close your laptop, hit a coffee shop, and order a espresso. Trust me, it’s worth it.
Thanks for sticking with me till the end of this lesson. Im Skeptic from Skeptic Lab & If this helped, smash that boost button and I’ll catch you in the next one! :)
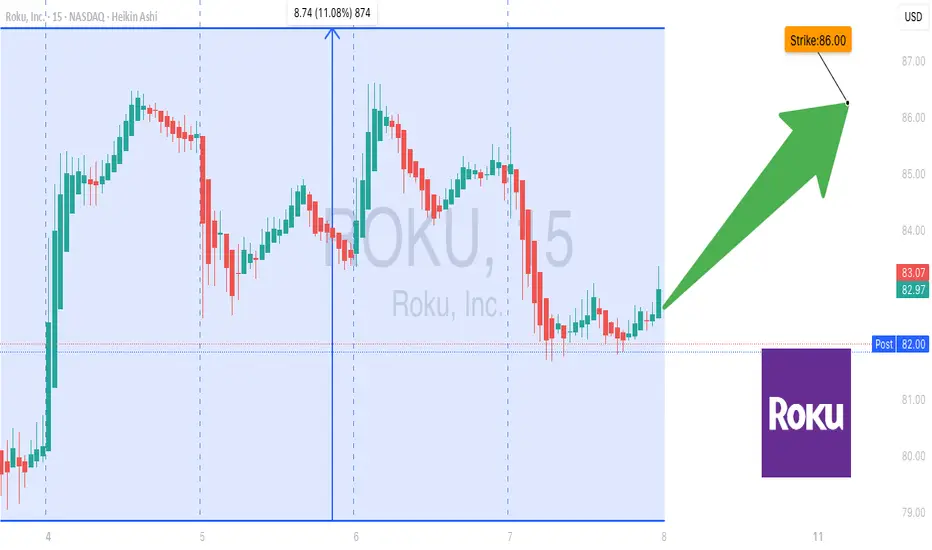
ROKU Call Alert: Cheap Options, Big Upside?🚨 ROKU Options Alert (Aug 6) – Bullish Breakout or Bull Trap?
📉 **Daily RSI < 45** → Bears in control
📈 **Weekly RSI Rising** → Bulls not giving up
📊 **Heavy Volume on Red Candle** = Institutional Selling?
💥 **Call/Put Ratio Spikes** → Speculators loading calls
⚠️ **High Gamma Risk** (Only 2DTE) = Fast & Furious Moves Incoming
---
### 🤖 What the AI Models Say:
**🔵 Grok/xAI** → ⚖️ *Moderate Bullish*
✅ Institutional Buying
✅ Favorable Volatility
📢 Suggests \$86 CALLs
**🔴 DeepSeek / Claude** → *No Trade*
⚠️ Daily RSI bearish
⚠️ Heavy distribution
🛑 Too risky this week
---
### 🧠 Summary: Mixed Signals = Cautious Bulls
Despite bearish momentum, **options flow screams bullish**. Risk-reward favors a speculative long — **only with tight stops**.
---
### 💰 Suggested Trade
**ROKU \$86 CALL** expiring **Aug 8**
📥 **Entry**: \$0.85
📈 **Profit Target**: \$1.30 (50%)
🛑 **Stop Loss**: \$0.51
🔒 **Confidence**: 65%
⏰ **Entry Timing**: At Open
---
### ⚠️ Key Risk:
Market tug-of-war between **institutional sellers vs. retail bulls**.
Only trade if you can manage fast-moving positions. 🔄
---
💬 Drop a 🚀 if you’re entering — and follow for more AI-driven trades!
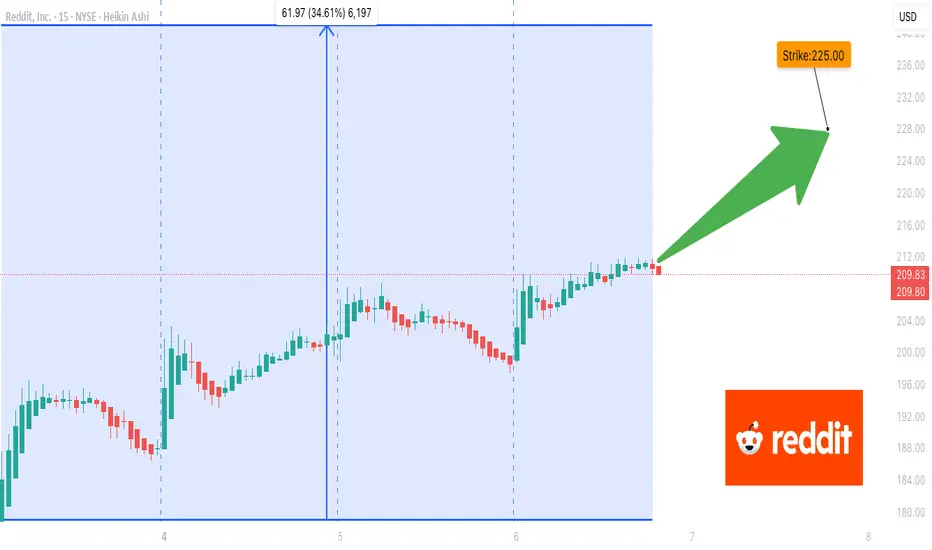
Smart Money Targets RDDT Calls – Are You In Before the Bang? ## 🚀 RDDT Options Signal: Bulls Loading Up Before Expiry!
**Only 2 DTE, But The Flow Is Screaming 📢**
📈 **\$225C @ \$0.86** — Risk Tight. Reward Clean.
🧠 Multiple AI Models Agree:
✅ Institutional Call Flow
✅ Bullish Weekly RSI
⚠️ Gamma & RSI Overheat = Manage Exit Timing Carefully!
---
### 🧩 Key Takeaways:
* Strong institutional flow backing the move 🔥
* Short-term risk? Absolutely.
* Reward? 50%+ if timed right ⏳
* Stop loss? Tight — don’t hesitate 🚨
---
### 💰 Trade Setup (Based on AI Consensus)
* **Strike**: \$225
* **Expiry**: 08/08
* **Premium**: \$0.86
* **Target**: \$1.29
* **Stop**: \$0.34
* **Confidence**: 70%
---
## ⚠️ 2 DTE — Trade Fast or Stand Aside
Not financial advice. This is flow-based probability.
Sometimes **opportunity hides behind time decay**. ⏳💥
---
### 🔖 Tags:
`#RDDT #RedditIPO #OptionsFlow #AITrading #TradingView #GammaRisk #BullishSetup #ShortTermPlay #WeeklyOptions #EarningsFlow`
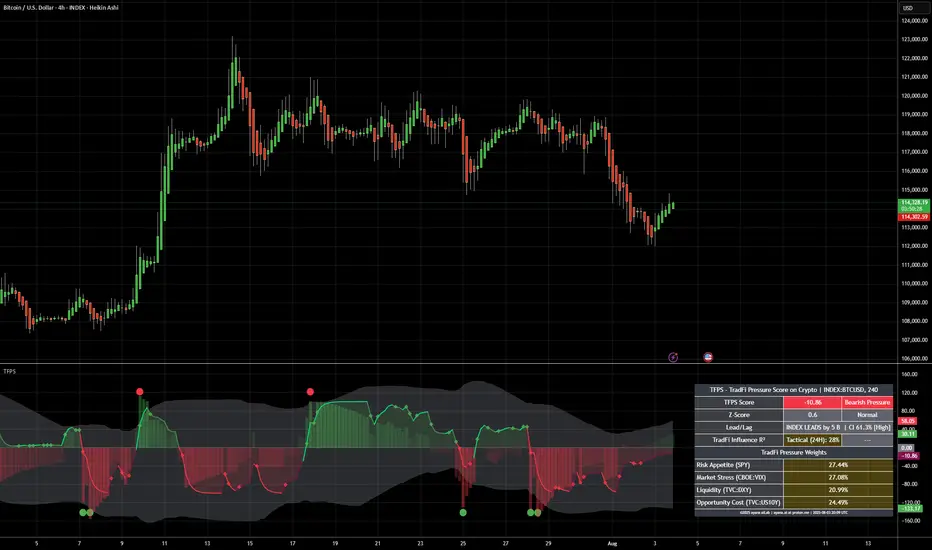
[ayana] Crypto Weather AI - 2nd test - do you like this?TFPS - TradFi Pressure Score on Crypto | INDEX:BTCUSD, 4H
Market Context Timestamp: 2025-08-03 21:50:47 UTC
TradFi Market Status: Closed
Reason (if closed): Weekend
Additional Notes: US futures are also closed. The dashboard reflects market sentiment from Friday's close.
TFPS Analysis: 2025-08-03
CORE RECOMMENDATION & NARRATIVE
The current market narrative is characterized by a shift in leadership: while TradFi markets exert slight bearish pressure, the movement is driven by internal crypto factors. The weak R² signal and the Lead/Lag indicator, which suggests the crypto asset is leading TradFi markets, point to a phase of internal crypto dynamics.
The Story: The TradFi environment shows a balanced bearish bias, with no single component dominating. However, the index (BTCUSD) is leading TradFi markets by 2 bars on the 4H chart. The TradFi correlation to price (R²) is weak at 20%, indicating that internal crypto catalysts are driving the price movement.
The Implication: This is a 'crypto-first' environment. The focus should shift from TradFi macro indicators to on-chain data and crypto-specific news. The TFPS is currently serving as a lagging indicator, confirming crypto action retroactively.
Primary Observation Signal: INDEX LEADS. The leadership of the crypto asset is the key signal. The strength and direction of the next crypto move are not predicted by TradFi but must be derived from internal crypto data.
### DATA SNAPSHOT & DECODING
| Metric | Dashboard Value | Interpretation (Based on TFPS v63 Logic) |
| :--- | :--- | :--- |
| TFPS Score | -12.66 | Bearish pressure originating from TradFi markets. |
| Z-Score | 0.53 | Normal. The current score is not statistically extreme ($$\lvert z \rvert < 2.0$$). An immediate mean reversion is not expected. |
| Lead/Lag | INDEX LEADS by 2 B CI 60.65% | The BTCUSD index is leading TradFi markets by 2 bars on the 4H chart. The high correlation confidence (> 0.50) makes this a very reliable signal. |
| TradFi Influence R² | Tactical (24H): 20% | Weak correlation. Only 20% of the price movement can be tactically explained by the TFPS. The market is currently driven mainly by internal crypto factors. |
| Top Weight: SPY | 27.98% | Non-dominant, but largest weighting factor. Represents market risk appetite. |
| Second Weight: VIX | 27.59% | Non-dominant, but second largest weighting factor. Represents market stress and fear. |
ACTIONABLE STEPS (LOW-EFFORT / HIGH-IMPACT)
🚀 MONITOR THIS FIRST: Focus on the price action of the BTCUSD chart itself. Since the INDEX LEADS signal is active, traditional TradFi charts (SPY, DXY, VIX) are currently lagging indicators. Look for chart formations, volume anomalies, or key support/resistance levels in the crypto market.
⏱️ ANTICIPATE MOVES: The INDEX LEADS indicator gives you a potential window of up to 8 hours (2 bars on the 4H chart) to observe TradFi markets after the Monday open. If the BTCUSD price rises or falls significantly before the US markets open, there is a high probability that the TradFi indices will follow.
🔍 VALIDATE THE THESIS: The weak tactical R² value of 20% confirms that TradFi correlation is low at the moment. Therefore, your trading decisions at this time should be based on approximately 80% crypto-internal data (on-chain, liquidity, news) and only 20% on macro data. If the R² value rises above 40% again, shift your focus back to TradFi.
#Bitcoin #BTC #CryptoTrading #TechnicalAnalysis #MarketAnalysis #TradFi #AITrading #TFPS #MarketNarrative
BTC AI Prediction Dashboard - 6h Price Path (29.07.25)
Prediction made using Crypticorn AI Prediction Dashboard
Link in bio
BTCUSDT Forecast:
Crypticorn AI Prediction Dashboard Projects 6h Price Path (Forward-Only)
Forecast timestamp: ~09:00 UTC
Timeframe: 15m
Prediction horizon: 6 hours
Model output:
Central estimate (blue line): -118,729
Represents the AI’s best estimate of BTC’s near-term price direction.
80% confidence band (light blue): 118,724 – 119,346
The light blue zone marks the 80% confidence range — the most likely area for price to close
40% confidence band (dark blue): 118,151 – 119,894
The dark blue zone shows the narrower 40% confidence range, where price is expected to stay with higher concentration
Volume on signal bar: 95.57
This chart shows a short-term Bitcoin price forecast using AI-generated confidence zones.
Candlesticks reflect actual BTC/USDT price action in 15-minute intervals.
This helps visualize expected volatility and potential price zones in the short term.

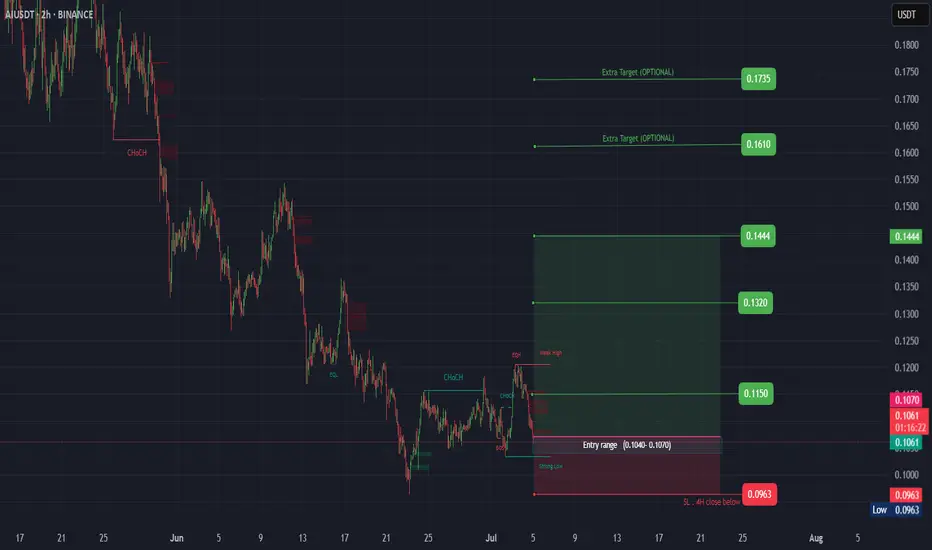
AI ( SPOT )BINANCE:AIUSDT
#AI/ USDT
Entry( 0.1040- 0.1070)
SL 4H close below 0.0963
T1 0.1150
T2 0.1320
T3 0.1444
_______________________________________________________
Golden Advices.
********************
* collect the coin slowly in the entry range.
* Please calculate your losses before the entry.
* Do not enter any trade you find it not suitable for you.
* No FOMO - No Rush , it is a long journey.
Bitcoin -Weekly Forecast, Technical Analysis & Trading IdeasMidterm forecast:
86499.57 is a major support, while this level is not broken, the Midterm wave will be uptrend.
We will close our open trades, if the Midterm level 86499.57 is broken.
MARKETSCOM:BITCOIN BITSTAMP:BTCUSD
Technical analysis:
A trough is formed in daily chart at 74545.70 on 04/09/2025, so more gains to resistance(s) 105431.17, 109932.90, 115000.00 and more heights is expected.
Take Profits:
86499.57 ✅
91037.20 ✅
94505.46 ✅
98675.19 ✅
101430.12 ✅
105431.17
109932.90
115000.00
120000.00
125000.00
132000.00
140000.00
150000.00
160000.00
167666.00
________________________________________________________________
❤️ If you find this helpful and want more FREE forecasts in TradingView,
. . . . . . . . Hit the 'BOOST' button 👍
. . . . . . . . . . . Drop some feedback in the comments below! (e.g., What did you find most useful? How can we improve?)
🙏 Your support is appreciated!
Now, it's your turn!
Be sure to leave a comment; let us know how you see this opportunity and forecast.
Have a successful week,
ForecastCity Support Team

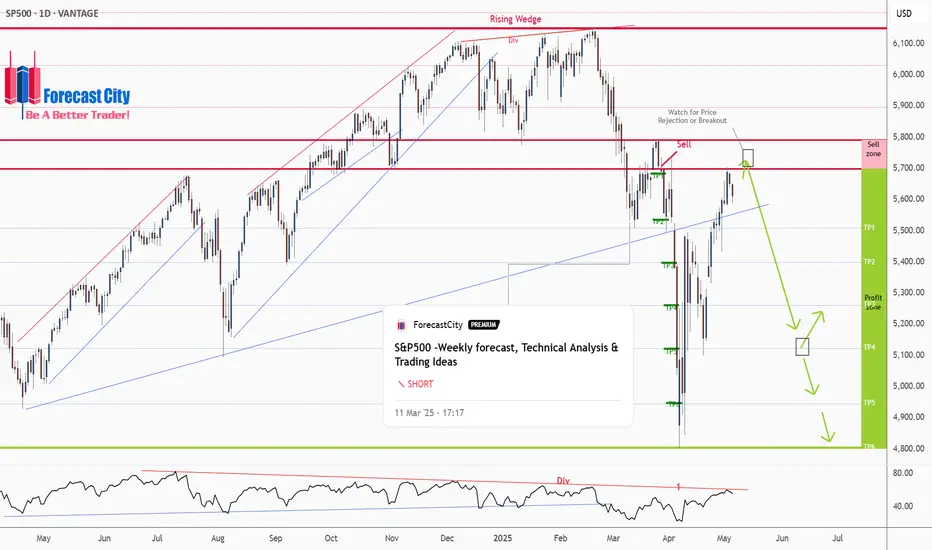
S&P500 -Weekly forecast, Technical Analysis & Trading IdeasPrevious forecast result:
As you can see in the 4CastMachine forecast on 12/03/2025, the price, after rejecting the sell zone, began its sharp decline and touched all TPs.
Midterm forecast:
While the price is below the resistance 6149.57, resumption of downtrend is expected.
We make sure when the support at 4804.01 breaks.
If the resistance at 6149.57 is broken, the short-term forecast -resumption of downtrend- will be invalid. CSEMA:S&P
Technical analysis:
While the RSI downtrend #1 is not broken, bearish wave in price would continue.
A trough is formed in daily chart at 4807.10 on 04/07/2025, so more gains to resistance(s) 5698.65, 5791.00, 5896.50 and maximum to Major Resistance (6149.57) is expected.
Price is above WEMA21, if price drops more, this line can act as dynamic support against more losses.
Relative strength index (RSI) is 55.
Take Profits:
5509.32
5363.90
5261.00
5122.47
4944.41
4804.01
__________________________________________________________________
❤️ If you find this helpful and want more FREE forecasts in TradingView,
. . . . . . . . Hit the 'BOOST' button 👍
. . . . . . . . . . . Drop some feedback in the comments below! (e.g., What did you find most useful? How can we improve?)
🙏 Your support is appreciated!
Now, it's your turn!
Be sure to leave a comment; let us know how you see this opportunity and forecast.
Have a successful week,
ForecastCity Support Team
GOLD(XAUUSD) -Weekly Forecast,Technical Analysis & Trading IdeasMidterm forecast:
2772.38 is a major support, while this level is not broken, the Midterm wave will be uptrend.
TVC:GOLD OANDA:XAUUSD
Technical analysis:
A trough is formed in daily chart at 2956.50 on 04/07/2025, so more gains to resistance(s) 3357.00, 3500.00 and more heights is expected.
Take Profits:
2833.00
2879.11
2955.00
3057.40
3160.00
3257.03
3357.00
3500.00
__________________________________________________________________
❤️ If you find this helpful and want more FREE forecasts in TradingView,
. . . . . . . . Hit the 'BOOST' button 👍
. . . . . . . . . . . Drop some feedback in the comments below! (e.g., What did you find most useful? How can we improve?)
🙏 Your support is appreciated!
Now, it's your turn!
Be sure to leave a comment; let us know how you see this opportunity and forecast.
Have a successful week,
ForecastCity Support Team

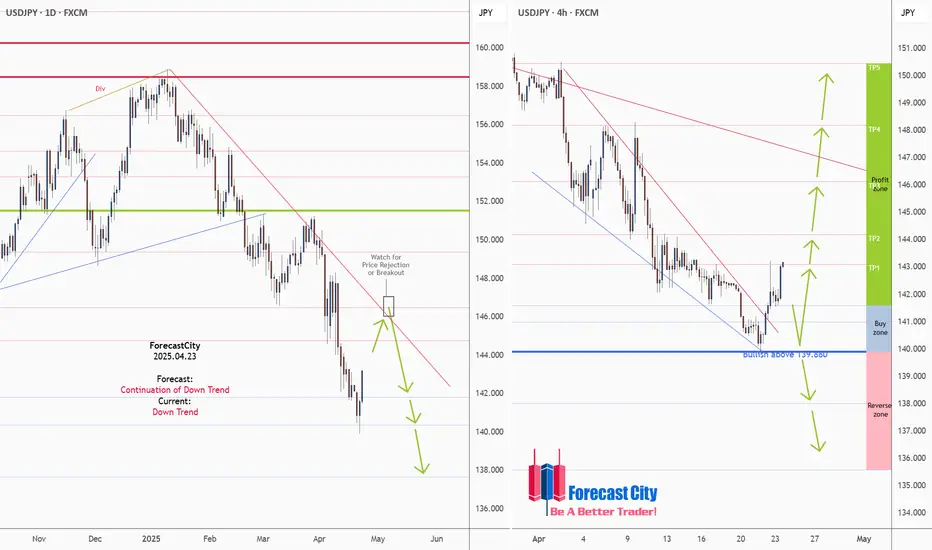
USDJPY Daily & H4 Forecasts, Technical Analysis & Trading IdeaTechnical analysis is on the chart!
No description needed!
FX:USDJPY
________________________________________________________________
❤️ If you find this helpful and want more FREE forecasts in TradingView,
. . . . . . . . Hit the 'BOOST' button 👍
. . . . . . . . . . . Drop some feedback in the comments below! (e.g., What did you find most useful? How can we improve?)
🙏 Your support is appreciated!
Now, it's your turn!
Be sure to leave a comment; let us know how you see this opportunity and forecast.
Have a successful week,
ForecastCity Support Team
AUDJPY: H4, H1 Forecasts, Technical Analysis & Trading IdeaTechnical analysis is on the chart!
No description needed!
OANDA:AUDJPY
________________________________________________________________
❤️ If you find this helpful and want more FREE forecasts in TradingView,
. . . . . . . . Hit the 'BOOST' button 👍
. . . . . . . . . . . Drop some feedback in the comments below! (e.g., What did you find most useful? How can we improve?)
🙏 Your support is appreciated!
Now, it's your turn!
Be sure to leave a comment; let us know how you see this opportunity and forecast.
Have a successful week,
ForecastCity Support Team

USDCHF Daily, H4,H1 Forecasts, Technical Analysis & Trading IdeaMidterm forecast:
0.84000 is a major resistance, while this level is not broken, the Midterm wave will be downtrend.
OANDA:USDCHF
Technical analysis:
A trough is formed in daily chart at 0.80385 on 04/21/2025, so more gains to resistance(s) 0.83314 and maximum to Major Resistance (0.84000) is expected.
Take Profits:
0.83314
0.84000
0.85430
0.86286
0.87550
0.89147
0.90367
0.92218
0.94400
__________________________________________________________________
❤️ If you find this helpful and want more FREE forecasts in TradingView,
. . . . . . . . Hit the 'BOOST' button 👍
. . . . . . . . . . . Drop some feedback in the comments below! (e.g., What did you find most useful? How can we improve?)
🙏 Your support is appreciated!
Now, it's your turn!
Be sure to leave a comment; let us know how you see this opportunity and forecast.
Have a successful week,
ForecastCity Support Team

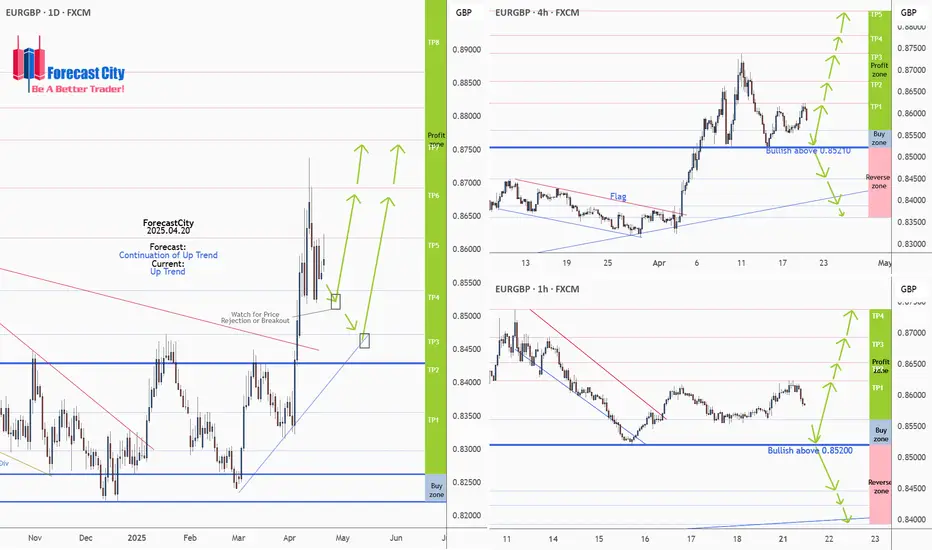
EURGBP Daily, H4,H1 Forecasts, Technical Analysis & Trading IdeaMidterm forecast:
0.84290 is a major support, while this level is not broken, the Midterm wave will be uptrend.
We will close our open trades, if the Midterm level 0.84290 is broken.
OANDA:EURGBP
Technical analysis:
A trough is formed in daily chart at 0.83220 on 04/03/2025, so more gains to resistance(s) 0.86175, 0.86923, 0.87647 and more heights is expected.
__________________________________________________________________
❤️ If you find this helpful and want more FREE forecasts in TradingView,
. . . . . . . . Hit the 'BOOST' button 👍
. . . . . . . . . . . Drop some feedback in the comments below! (e.g., What did you find most useful? How can we improve?)
🙏 Your support is appreciated!
Now, it's your turn!
Be sure to leave a comment; let us know how you see this opportunity and forecast.
Have a successful week,
ForecastCity Support Team
EURUSD Daily, H4,H1 Forecasts, Technical Analysis & Trading Idea💡 Daily Timeframe:
As forecasted by 4CastMachine AI last week, EURUSD was rejected from the channel line.
💡 H4 Timeframe:
FX:EURUSD started a corrective wave,
This decline may continue, but the support area of 1.1200 ~ 1.0890 could trigger a rebound.
This area, which was previously a major resistance, will become a major support, creating a good buying opportunity.
💡 H1 Timeframe:
The Triangle pattern formed in the price has broken downwards.
The bearish wave is expected to continue as long as the price is below the strong resistance at 1.1334
1.1334 Support is broken now. It will act as a Resistance now!
💡 H1 Forecast:
Correction wave toward the Sell Zone
Another Downward Impulse wave toward Lower TPs
H1 Trading Idea:
Sell now or wait for pullback and Sell on price rejection from 1.1334.
SL: Above 1.1334
__________________________________________________________________
❤️ If you find this helpful and want more FREE forecasts in TradingView,
. . . . . . . . Hit the 'BOOST' button 👍
. . . . . . . . . . . Drop some feedback in the comments below! (e.g., What did you find most useful? How can we improve?)
🙏 Your support is appreciated!
Now, it's your turn!
Be sure to leave a comment; let us know how you see this opportunity and forecast.
Have a successful week,
ForecastCity Support Team

GOLD(XAUUSD) -Weekly Forecast,Technical Analysis & Trading IdeasMidterm forecast:
2772.38 is a major support, while this level is not broken, the Midterm wave will be uptrend.
We will close our open trades, if the Midterm level 2772.38 is broken.
OANDA:XAUUSD TVC:GOLD
Technical analysis:
A peak is formed in daily chart at 3167.60 on 04/03/2025, so more losses to support(s) 3000.00, 2955.00, 2879.11 and minimum to Major Support (2772.38) is expected.
Take Profits:
2833.00
2879.11
2955.00
3000.00
3057.40
3100.00
3167.60
3200.00
__________________________________________________________________
❤️ If you find this helpful and want more FREE forecasts in TradingView,
. . . . . . . . Hit the 'BOOST' button 👍
. . . . . . . . . . . Drop some feedback in the comments below! (e.g., What did you find most useful? How can we improve?)
🙏 Your support is appreciated!
Now, it's your turn!
Be sure to leave a comment; let us know how you see this opportunity and forecast.
Have a successful week,
ForecastCity Support Team

Bitcoin -Weekly, Daily, H4, H1 Forecasts, Trading IdeasMidterm forecast, Weekly Timeframe:
While the price is above the support 70550.04, resumption of uptrend is expected.
We make sure when the resistance at 91037.20 breaks.
If the support at 70550.04 is broken, the short-term forecast -resumption of uptrend- will be invalid.
BITSTAMP:BTCUSD MARKETSCOM:BITCOIN
Daily Timeframe:
A trough is formed in daily chart at 74545.70 on 04/09/2025, so more gains to resistance(s) 86499.57 and maximum to Major Resistance (91037.20) is expected.
Take Profits:
86499.57
91037.20
94505.46
98675.19
101430.12
105431.17
109932.89
115000.00
120000.00
125000.00
130000.00
140000.00
H4 Timeframe:
H1 Timeframe:
________________________________________________________________
❤️ If you find this helpful and want more FREE forecasts in TradingView,
. . . . . . . . Hit the 'BOOST' button 👍
. . . . . . . . . . . Drop some feedback in the comments below! (e.g., What did you find most useful? How can we improve?)
🙏 Your support is appreciated!
Now, it's your turn!
Be sure to leave a comment; let us know how you see this opportunity and forecast.
Have a successful week,
ForecastCity Support Team

GOLD(XAUUSD) -Weekly Forecast,Technical Analysis & Trading Ideas💡 Daily Timeframe:
As the 4CastMachine AI forecasted, the price began its decline towards the $3,000 support.
At the support area of 3000, the up trend line will also prevent further declines.
If this area is broken, the price will decline to the support area of 2789.95.
This area, which was previously a major resistance, will become a major support, creating a good buying opportunity.
So, given the long-term uptrend, we can use this area as a long-term BUY ZONE.
OANDA:XAUUSD TVC:GOLD
💡 H4 Timeframe:
Gold started its decline when it hit the 3167 resistance.
The uptrend is broken, and price is in an impulse wave.
This decline will continue, but the support area of 3000 and uptrend line could trigger a resumption of uptrend.
💡 H1 Timeframe:
If the price enters the sell zone with a corrective wave, we will wait for the price to reject from that area.
If we see a price rejection from the sell zone, we can sell.
H1 Forecast:
Correction wave toward the Sell Zone
Another Downward Impulse wave toward Lower TPs
__________________________________________________________________
❤️ If you find this helpful and want more FREE forecasts in TradingView,
. . . . . . . . Hit the 'BOOST' button 👍
. . . . . . . . . . . Drop some feedback in the comments below! (e.g., What did you find most useful? How can we improve?)
🙏 Your support is appreciated!
Now, it's your turn!
Be sure to leave a comment; let us know how you see this opportunity and forecast.
Have a successful week,
ForecastCity Support Team

GOLD(XAUUSD) -Weekly Forecast,Technical Analysis & Trading IdeasMidterm forecast:
2772.38 is a major support, while this level is not broken, the Midterm wave will be uptrend.
We will close our open trades, if the Midterm level 2772.38 is broken.
OANDA:XAUUSD TVC:GOLD
Technical analysis:
A trough is formed in daily chart at 2832.55 on 02/28/2025, so more gains to resistance(s) 3100.00, 3150.00, 3200.00 and more heights is expected.
Take Profits:
2833.00
2879.11
2955.00
3000.00
3057.40
3100.00
3150.00
3200.00
__________________________________________________________________
❤️ If you find this helpful and want more FREE forecasts in TradingView,
. . . . . . . . Hit the 'BOOST' button 👍
. . . . . . . . . . . Drop some feedback in the comments below! (e.g., What did you find most useful? How can we improve?)
🙏 Your support is appreciated!
Now, it's your turn!
Be sure to leave a comment; let us know how you see this opportunity and forecast.
Have a successful week,
ForecastCity Support Team

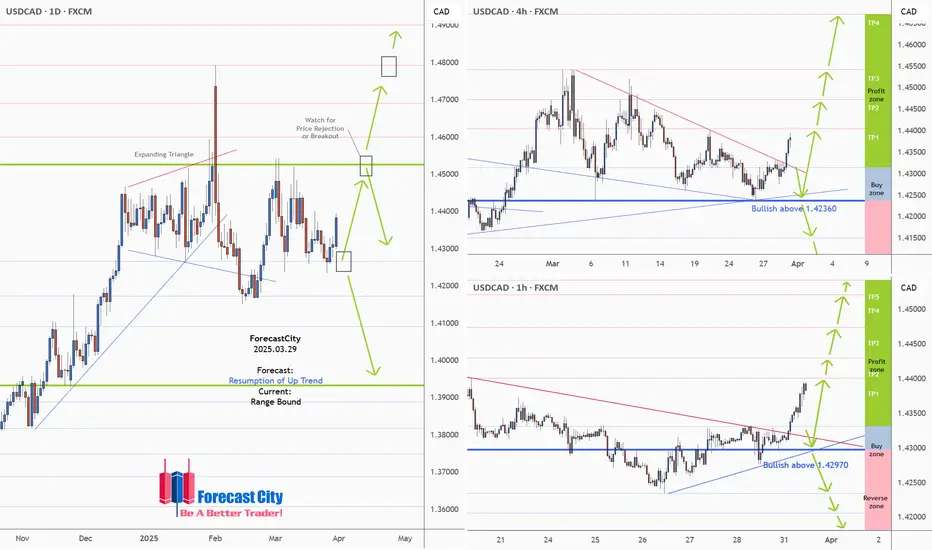
USDCAD -Weekly Forecast,Technical Analysis & Trading Ideas
Technical analysis is on the chart!
No description needed!
OANDA:USDCAD
________________________________________________________________
❤️ If you find this helpful and want more FREE forecasts in TradingView,
. . . . . . . . Hit the 'BOOST' button 👍
. . . . . . . . . . . Drop some feedback in the comments below! (e.g., What did you find most useful? How can we improve?)
🙏 Your support is appreciated!
Now, it's your turn!
Be sure to leave a comment; let us know how you see this opportunity and forecast.
Have a successful week,
ForecastCity Support Team