AIUSDT (2D) — Entering a Major Accumulation Phase?Overview:
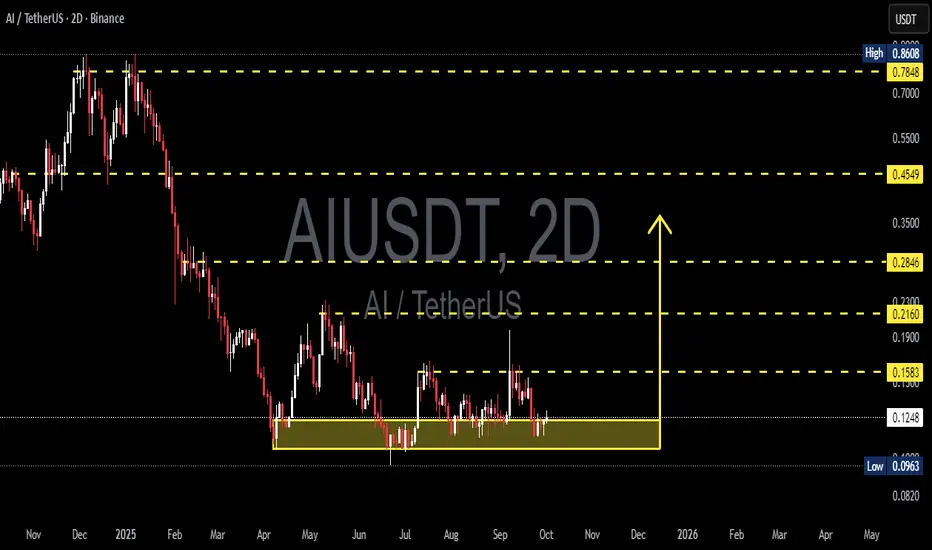
AIUSDT is currently in a deep accumulation phase after a long decline from the peak at 0.8608. Price is consolidating within the critical support zone of 0.0963 – 0.1257 (highlighted in yellow). This level has been tested multiple times, showing strong interest from both buyers and sellers.
On the 2D timeframe, the structure suggests that the market is waiting for a decisive move: will this support hold as the base for a reversal, or will it break down to extend the bearish trend?
---
🔑 Key Technical Levels
Main Support: 0.0963 – 0.1257
Secondary Support: 0.0820 (historical level)
Key Resistances:
0.1583 → first breakout confirmation
0.2160 → strong psychological resistance
0.2846 → major swing target
0.4549 → higher timeframe resistance
0.7848 → major supply zone from previous distribution
---
📈 Bullish Scenario
Trigger: A confirmed 2D close above 0.1583 with solid volume.
Momentum confirmation: Formation of higher lows and strong bullish candles.
Upside targets:
1. 0.1583 (initial resistance)
2. 0.2160 (trend validation)
3. 0.2846 (swing extension)
Bullish signals: RSI bullish divergence or a bullish engulfing candle forming at support.
---
📉 Bearish Scenario
Trigger: A confirmed 2D close below 0.0963 with increasing sell volume.
Retest confirmation: If price retests the 0.0963 – 0.1257 zone and fails to reclaim it, the area turns into resistance.
Downside targets: Next support at 0.0820, with risk of further price discovery to the downside.
Bearish signals: Long upper wicks near resistance combined with strong selling volume.
---
📊 Structure & Pattern
Current structure resembles an accumulation range following a prolonged downtrend.
The longer price stays within this range, the stronger the eventual breakout or breakdown move is likely to be.
This pattern could evolve into re-accumulation or redistribution, depending on the direction of confirmation.
---
🎯 Trading Strategy
For bulls: Consider entries near support with bullish confirmation, SL below 0.09, targets scaled across resistance levels.
For bears: Wait for a confirmed breakdown below 0.0963, enter on failed retests, SL above 0.1257, target down to 0.0820.
Note: Always apply risk management (max 1–2% risk per trade).
---
📌 Conclusion
AIUSDT is at a critical decision zone. This range will decide whether the market starts a new bullish trend or continues its bearish extension.
Holding support → potential for a strong rally.
Breaking support → continuation of the downtrend.
Traders should wait for volume confirmation and 2D candle closes before committing to a major position.
---
#AIUSDT #CryptoAnalysis#SupportResistance #Altcoin #Breakout #Accumulation #TechnicalAnalysis #SwingTrade #PriceAction
AIUSDT
Double Bottom!25-09-2025
Double bottom with Bullish Divergence.
Crossing the LH may lead it towards the mentioned target.

$FLOCK breakout in progress Price reclaiming key level$FLOCK breakout in progress Price reclaiming key levels with strong momentum. Price breaking out of the wedge Bulls aiming for the 0.40–0.45 zone next Volume confirming the upside pressure Potential rally toward 0.50 if momentum holds.

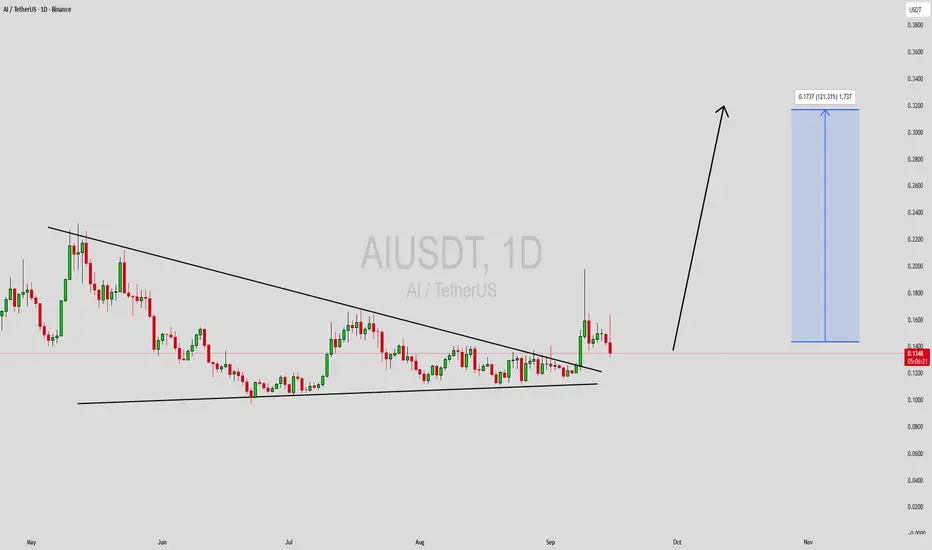
AIUSDT Forming Bullish PennantAIUSDT is currently forming a bullish pennant pattern, a continuation setup that typically signals the market is preparing for another strong upward move after an initial rally. This consolidation phase shows that buyers are holding control, with price coiling into a tighter range before a potential breakout. With steady volume supporting the pattern, the setup indicates that a significant bullish move may be imminent once resistance levels are cleared.
The projected gain of 90% to 100%+ reflects the strong momentum behind this formation. Bullish pennants often lead to sharp rallies, as traders who have been waiting on the sidelines jump in once the breakout is confirmed. The energy built up during consolidation usually results in an explosive move, giving both short-term and long-term investors a favorable opportunity.
Investor interest in AIUSDT has been growing, with market participants recognizing the potential upside of this project. As accumulation continues, the technical outlook strengthens, and many traders are anticipating a breakout that could open the doors to a new bullish leg in the market. Watching volume spikes and breakout candles will be crucial for catching the next big move.
✅ Show your support by hitting the like button and
✅ Leaving a comment below! (What is You opinion about this Coin)
Your feedback and engagement keep me inspired to share more insightful market analysis with you!
AIUSDT – Consolidation at Demand Zone: Accumulation or Bearish?⏳ Current Market Context
AIUSDT is at a critical juncture, consolidating within the demand zone of $0.096 – $0.124 (yellow box). This zone has been repeatedly tested since June 2025, making it a last line of defense for buyers before a potential deeper drop.
While the macro structure remains bearish (since the Dec 2024–Jan 2025 peak, price has printed continuous lower highs), a potential accumulation base is forming here, which could serve as a turning point if confirmed with strong breakout volume.
---
🔹 Structure & Pattern
Primary downtrend: visible from a clear sequence of lower highs.
Accumulation base: buyers are defending the yellow box, sellers losing momentum.
Range-bound: oscillation between demand $0.096–0.124 and resistance $0.140–0.158.
Market psychology: this support area is where panic sellers exit, while long-term investors see it as an opportunity to accumulate.
---
🚀 Bullish Scenario
Trigger: Daily close above $0.1582 with strong volume → valid breakout confirmation.
Target 1: $0.2168 (next resistance, ~+74% upside).
Target 2: $0.3056 (major supply zone, ~+146% upside).
Extended targets (if macro turns bullish): $0.5285 – $0.8177 (historical resistances).
Extra confirmation: RSI crossing 50, MACD bullish crossover, OBV rising.
---
🐻 Bearish Scenario
Trigger: Daily close below $0.096.
Target 1: $0.071 (previous low, ~−42%).
Target 2: potential new lows below $0.07 if crypto market weakness accelerates.
Red flag: breakdown accompanied by high red volume bars → stronger bearish continuation signal.
---
🎯 Trading Approaches
1. Aggressive Buy-the-Dip
Entry: near $0.105 – $0.110
Stop: below $0.09
Target: $0.14 – $0.158
2. Conservative Breakout Play
Entry: after daily close and retest > $0.1582
Stop: below breakout retest
Target: $0.2168 / $0.3056
3. Short Setup (Bearish Bias)
Entry: if daily close < $0.096
Target: $0.071
Stop: above $0.105
---
📌 Conclusion
AIUSDT is trading at a make-or-break zone:
A breakout above $0.1582 could mark the start of a new bullish cycle.
A breakdown below $0.096 would confirm continuation of the bearish trend.
Watch daily closes, breakout volume, and momentum indicators carefully to avoid false breakouts.
#AIUSDT #Crypto #Altcoins #TechnicalAnalysis #PriceAction #SupportResistance #CryptoTrading #BullishScenario #BearishScenario #SwingTrade

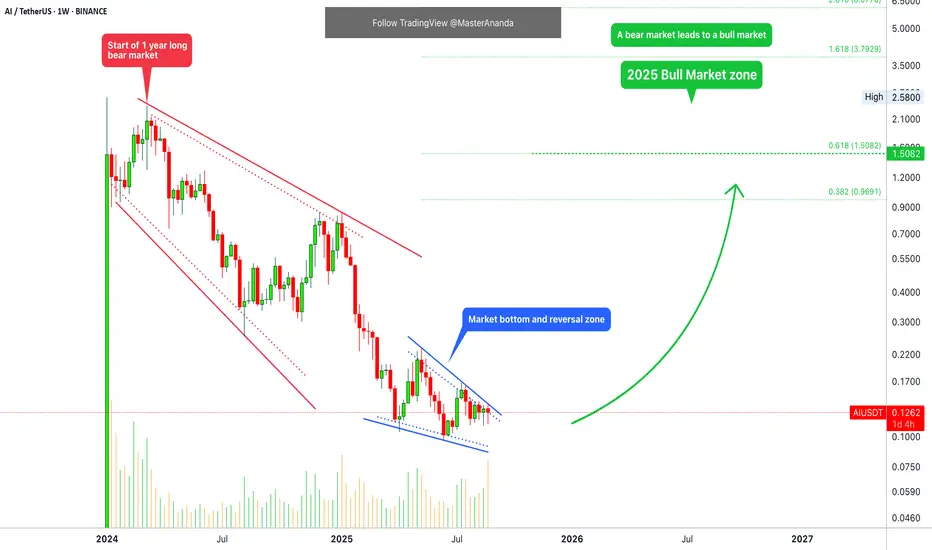
Sleepless AI · It is all in your mindSee here the chart for Sleepless AI (AIUSDT). This is long-term.
Notice the volume this week. Really high bearish volume and a red candle. Why isn't this considered a bearish signal? Because the wick low this week is higher compared to the main low in June and the previous low in April. It can also happen that the week ends up closing green tomorrow.
A year long bear market leads to a strong bottom pattern and consolidation phase. It has been many months since AIUSDT got out of its downtrend, no new lows, but it isn't rising either. Things are about to change.
Speed
The market is already moving, it has been doing so for months. Maybe it isn't moving as fast as some people think but this is part of an illusion, how fast is fast? How are the impatient defining fast?
So it really depends on the definition and your expectations. Someone with the wrong mindset might buy crypto and think money is just around the corner, you get paid the next day. The truth is that it doesn't matter which market you are in, buying at bottom prices, holding in the market is what pays. Time pays.
Everything grows overtime; are you holding long-term?
A pair can grow 1,000% in 6 months but there is no profits for you if you sell each time prices drop, and buy each time prices go up. The only way possible to profit from a full 1,000% bullish wave, is to buy and hold long-term. Why? Because prices are growing daily and nothing happens in a single day.
It takes months and months of fluctuations; down and up. After the market matures; the chart matures, the position grows. It takes time but it works.
How to choose an altcoin
If you are confused by too many choices you are not alone. Let me guide you, it is an easy solution.
Calm, first. There is always time.
No need to take action right away, the market is not going away. If you don't know what to choose you don't have enough information, the cure is to read.
Read all the charts that I publish daily and with time you will know the pairs, learn the pairs and also know what to choose that will work for you. Nobody can choose for you. If someone else chooses for you, you will get their results. If you want to do good, you have to invest time, study, invest in your tools and work.
For example, you need a computer or minimum a laptop, with a smart phone it doesn't work. It might work for the basics, it might work to make money, but it not might work to achieve your goals.
If you are going all-in and you truly want to win; remember, this thing will change your life forever, then you have to invest all the time this business needs.
This isn't different to any other profession. If you are going to become an actor, you have to study, practice and work. Even with this effort it might not be enough. You might work hard and really want it but this might not be enough. Some people are born with talent and other people develop talent. It is all the same with trading.
In order to become a doctor, you have to study and work for years. It takes years of preparation to be able to perform a successful surgery, trading is the same. It will take years of planning, studying and preparation to make millions of dollars and keep it, and that's the trick, "keep it."
Thousands of people are making tons of money but they are giving it all back overtime. It doesn't happen in one night but they give it all back. How much profits will you secure in this winning cycle? Will you buy real state? Will you quit your job or start a second business? Will you retire for good and life a frugal life in a small Caribbean country?
Whatever you choose, the market is here for you and it is not going away. Since there is always plenty of time; learn to prepare, study, plan and trade. Money is endless. You can have as much as you want. It is all in the mind.
Namaste.
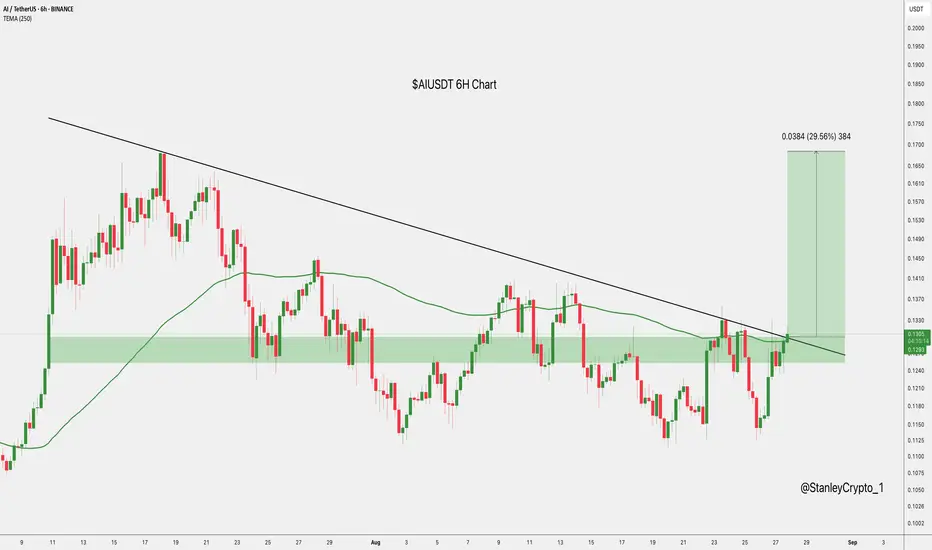
$AIUSDT Breakout: Eyeing $0.1754 NextNYSE:AI is breaking out on the 6H chart, holding steady around $0.1313 after pushing above the trendline.
If buyers keep the momentum, it could climb toward $0.1754 for a solid 30% move.
But if it slips back below $0.127, the setup could lose steam.
DYOR, NFA
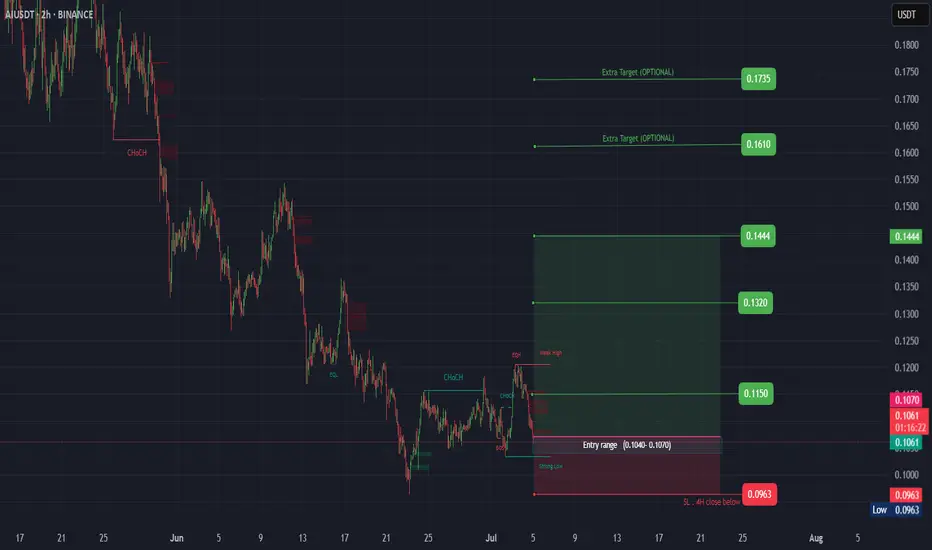
AI ( SPOT )BINANCE:AIUSDT
#AI/ USDT
Entry( 0.1040- 0.1070)
SL 4H close below 0.0963
T1 0.1150
T2 0.1320
T3 0.1444
_______________________________________________________
Golden Advices.
********************
* collect the coin slowly in the entry range.
* Please calculate your losses before the entry.
* Do not enter any trade you find it not suitable for you.
* No FOMO - No Rush , it is a long journey.
AI Looks Bullish (12H)The AI correction has started from the point marked as "start" on the chart.
It seems that wave C has completed, as its time cycle has finished and the price has reclaimed key levels.
As long as the green zone holds, the price can move toward the targets and the red box.
The targets are marked on the chart.
A daily candle closing below the invalidation level will invalidate this analysis.
For risk management, please don't forget stop loss and capital management
Comment if you have any questions
Thank You

AIUSDT Forming Falling ChannelAIUSDT is capturing trader interest with a well-defined falling wedge pattern, a strong technical signal that often precedes a major bullish reversal. This setup shows the price compressing within converging trendlines while volume remains supportive, hinting at an upcoming breakout. With expectations for a 90% to 100% gain once the wedge resistance is breached, this pair stands out for swing traders seeking high-probability crypto setups.
The AI narrative continues to gain momentum in the crypto market, and AIUSDT has benefited from this growing sector trend. As blockchain projects focusing on artificial intelligence integrations expand, more investors are looking for exposure to tokens that could lead the AI revolution in decentralized applications. This increasing investor confidence is reflected in the steady accumulation during the wedge formation, showing that buyers are positioning for a breakout.
Traders should closely monitor how the price behaves at the wedge resistance line, as a clean breakout with strong volume could trigger the expected upside move. Confirmations like bullish retests and a surge in trading volume can add conviction to the setup. Risk management remains key, with well-placed stop-losses below the wedge support to protect capital while targeting the full measured move potential.
✅ Show your support by hitting the like button and
✅ Leaving a comment below! (What is You opinion about this Coin)
Your feedback and engagement keep me inspired to share more insightful market analysis with you!

SCRUSDT UPDATE
Pattern: Falling Wedge Breakout
Current Price: \$0.268
Target Price: \$0.398
Target % Gain: 50.1%
Technical Analysis: SCR has broken out of a falling wedge pattern on the 12H chart with a clean close above resistance. The breakout is backed by bullish candles and increasing volume, suggesting a potential 50% move upward.
Time Frame: 12H

NEARUSDT UPDATE
Pattern: Descending Triangle Breakout
Current Price: \$2.937
Target Price: \$3.60
Target % Gain: 22.69%
Technical Analysis: NEAR has broken out of a descending triangle on the 8H chart. Price is closing above resistance with decent momentum, indicating a potential move toward \$3.60.
Time Frame: 8H

XRPUSDT UPDATE
Pattern: Falling Wedge Breakout
Current Price: \$2.5398
Target Price: \$3.90
Target % Gain: 55.29%
Technical Analysis: XRP has broken out of a falling wedge on the 1D chart with strong bullish momentum. The breakout is confirmed with a daily close above resistance and increased volume.
Time Frame: 1D
Risk Management Tip: Always use proper risk management.

SOLUSDT UPDATE
Pattern: Falling Wedge Breakout
Current Price: \$173.38
Target Price: \$300
Target % Gain: 105.90%
Technical Analysis: SOL has broken out of a falling wedge pattern on the daily chart, indicating a bullish reversal. Strong momentum and breakout confirmation suggest a potential move towards the \$300 level.
Time Frame: 1D
Risk Management Tip: Always use proper risk management.

LISTAUSDT UPDATELISTAUSDT Technical Setup
Pattern: Falling Wedge Breakout
Current Price: $0.1893
Target Price: $0.30
Target % Gain: 60.04%
Technical Analysis: LISTA has broken out of a falling wedge pattern on the 12H chart with increasing momentum. Price is holding above the breakout trendline, suggesting bullish continuation. A confirmed breakout with volume could push price to the projected target.
Time Frame: 12H
Risk Management Tip: Always use proper risk management.

SUPERUSDT UPDATESUPERUSDT is a cryptocurrency trading at $0.5519, with a target price of $1.2000. This represents a potential gain of over 170%. The technical pattern observed is a Bullish Falling Wedge, indicating a possible trend reversal. This pattern suggests that the downward trend may be coming to an end. A breakout from the wedge could lead to a significant upward movement in price. The Bullish Falling Wedge is a positive indicator, signaling a potential price surge. Investors are showing optimism about SUPERUSDT's future performance. The current price may present a buying opportunity. Reaching the target price would result in substantial returns for investors. SUPERUSDT is positioned for a potential breakout and significant gains.

TAOUSDT UPDATETAOUSDT is a cryptocurrency trading at $231.9, with a target price of $360.0. This represents a potential gain of over 60%. The technical pattern observed is a Bullish Falling Wedge, indicating a possible trend reversal. This pattern suggests that the downward trend may be coming to an end. A breakout from the wedge could lead to a significant upward movement in price. The Bullish Falling Wedge is a positive indicator, signaling a potential price surge. Investors are showing optimism about TAOUSDT's future performance. The current price may present a buying opportunity. Reaching the target price would result in substantial returns for investors. TAOUSDT is positioned for a potential breakout and significant gains.

CFXUSDT UPDATECFXUSDT is a cryptocurrency trading at $0.0788, with a target price of $0.1400. This represents a potential gain of over 80%. The technical pattern observed is a Bullish Falling Wedge, indicating a possible trend reversal. This pattern suggests that the downward trend may be coming to an end. A breakout from the wedge could lead to a significant upward movement in price. The Bullish Falling Wedge is a positive indicator, signaling a potential price surge. Investors are showing optimism about CFXUSDT's future performance. The current price may present a buying opportunity. Reaching the target price would result in substantial returns for investors. CFXUSDT is positioned for a potential breakout and significant gains.

CRAIUSDT - An interesting coin!CRAI token is a part of Cryptify AI project
Cryptify AI uses AI and blockchain to analyze influencer performance on social media, helping businesses make more accurate and transparent marketing decisions using the CRAI token.
A strong and interesting project with a unique idea.
On the chart, it has formed a descending channel, and the 0.236 resistance has been broken on the 3-day chart.
The price movement is expected as shown in the chart
Best regards Ceciliones🎯
C

UNIUSDT UPDATEUNIUSDT is a cryptocurrency trading at $6.780. Its target price is $10.000, indicating a potential 50%+ gain. The pattern is a Bullish Falling Wedge, a reversal pattern signaling a trend change. This pattern suggests the downward trend may be ending. A breakout from the wedge could lead to a strong upward move. The Bullish Falling Wedge is a positive signal, indicating a potential price surge. Investors are optimistic about UNIUSDT's future performance. The current price may be a buying opportunity. Reaching the target price would result in significant returns. UNIUSDT is poised for a potential breakout and substantial gains.

DOTUSDT IDEADOTUSDT is a cryptocurrency trading at $4.415. Its target price is $7.500, indicating a potential 70%+ gain. The pattern is a Bullish Falling Wedge, a reversal pattern signaling a trend change. This pattern suggests the downward trend may be ending. A breakout from the wedge could lead to a strong upward move. The Bullish Falling Wedge is a positive signal, indicating a potential price surge. Investors are optimistic about DOTUSDT's future performance. The current price may be a buying opportunity. Reaching the target price would result in significant returns. DOTUSDT is poised for a potential breakout and substantial gains.

PEPEUSDT UPDATEPEPEUSDT is a cryptocurrency trading at $0.00729. Its target price is $0.01400, indicating a potential 100%+ gain. The pattern is a Bullish Falling Wedge, a reversal pattern signaling a trend change. This pattern suggests the downward trend may be ending. A breakout from the wedge could lead to a strong upward move. The Bullish Falling Wedge is a positive signal, indicating a potential price surge. Investors are optimistic about PEPEUSDT's future performance. The current price may be a buying opportunity. Reaching the target price would result in significant returns. PEPEUSDT is poised for a potential breakout and substantial gains.

LUNAUSDT UPDATELUNAUSDT is a cryptocurrency trading at $0.1946. Its target price is $0.3500, indicating a potential 85%+ gain. The pattern is a Bullish Falling Wedge, a reversal pattern signaling a trend change. This pattern suggests the downward trend may be ending. A breakout from the wedge could lead to a strong upward move. The Bullish Falling Wedge is a positive signal, indicating a potential price surge. Investors are optimistic about LUNAUSDT's future performance. The current price may be a buying opportunity. Reaching the target price would result in significant returns. LUNAUSDT is poised for a potential breakout and substantial gains.
