AIUSDT (2D) — Entering a Major Accumulation Phase?Overview:
AIUSDT is currently in a deep accumulation phase after a long decline from the peak at 0.8608. Price is consolidating within the critical support zone of 0.0963 – 0.1257 (highlighted in yellow). This level has been tested multiple times, showing strong interest from both buyers and sellers.
On the 2D timeframe, the structure suggests that the market is waiting for a decisive move: will this support hold as the base for a reversal, or will it break down to extend the bearish trend?
---
🔑 Key Technical Levels
Main Support: 0.0963 – 0.1257
Secondary Support: 0.0820 (historical level)
Key Resistances:
0.1583 → first breakout confirmation
0.2160 → strong psychological resistance
0.2846 → major swing target
0.4549 → higher timeframe resistance
0.7848 → major supply zone from previous distribution
---
📈 Bullish Scenario
Trigger: A confirmed 2D close above 0.1583 with solid volume.
Momentum confirmation: Formation of higher lows and strong bullish candles.
Upside targets:
1. 0.1583 (initial resistance)
2. 0.2160 (trend validation)
3. 0.2846 (swing extension)
Bullish signals: RSI bullish divergence or a bullish engulfing candle forming at support.
---
📉 Bearish Scenario
Trigger: A confirmed 2D close below 0.0963 with increasing sell volume.
Retest confirmation: If price retests the 0.0963 – 0.1257 zone and fails to reclaim it, the area turns into resistance.
Downside targets: Next support at 0.0820, with risk of further price discovery to the downside.
Bearish signals: Long upper wicks near resistance combined with strong selling volume.
---
📊 Structure & Pattern
Current structure resembles an accumulation range following a prolonged downtrend.
The longer price stays within this range, the stronger the eventual breakout or breakdown move is likely to be.
This pattern could evolve into re-accumulation or redistribution, depending on the direction of confirmation.
---
🎯 Trading Strategy
For bulls: Consider entries near support with bullish confirmation, SL below 0.09, targets scaled across resistance levels.
For bears: Wait for a confirmed breakdown below 0.0963, enter on failed retests, SL above 0.1257, target down to 0.0820.
Note: Always apply risk management (max 1–2% risk per trade).
---
📌 Conclusion
AIUSDT is at a critical decision zone. This range will decide whether the market starts a new bullish trend or continues its bearish extension.
Holding support → potential for a strong rally.
Breaking support → continuation of the downtrend.
Traders should wait for volume confirmation and 2D candle closes before committing to a major position.
---
#AIUSDT #CryptoAnalysis#SupportResistance #Altcoin #Breakout #Accumulation #TechnicalAnalysis #SwingTrade #PriceAction
Aiusdtsignal
AIUSDT – Consolidation at Demand Zone: Accumulation or Bearish?⏳ Current Market Context
AIUSDT is at a critical juncture, consolidating within the demand zone of $0.096 – $0.124 (yellow box). This zone has been repeatedly tested since June 2025, making it a last line of defense for buyers before a potential deeper drop.
While the macro structure remains bearish (since the Dec 2024–Jan 2025 peak, price has printed continuous lower highs), a potential accumulation base is forming here, which could serve as a turning point if confirmed with strong breakout volume.
---
🔹 Structure & Pattern
Primary downtrend: visible from a clear sequence of lower highs.
Accumulation base: buyers are defending the yellow box, sellers losing momentum.
Range-bound: oscillation between demand $0.096–0.124 and resistance $0.140–0.158.
Market psychology: this support area is where panic sellers exit, while long-term investors see it as an opportunity to accumulate.
---
🚀 Bullish Scenario
Trigger: Daily close above $0.1582 with strong volume → valid breakout confirmation.
Target 1: $0.2168 (next resistance, ~+74% upside).
Target 2: $0.3056 (major supply zone, ~+146% upside).
Extended targets (if macro turns bullish): $0.5285 – $0.8177 (historical resistances).
Extra confirmation: RSI crossing 50, MACD bullish crossover, OBV rising.
---
🐻 Bearish Scenario
Trigger: Daily close below $0.096.
Target 1: $0.071 (previous low, ~−42%).
Target 2: potential new lows below $0.07 if crypto market weakness accelerates.
Red flag: breakdown accompanied by high red volume bars → stronger bearish continuation signal.
---
🎯 Trading Approaches
1. Aggressive Buy-the-Dip
Entry: near $0.105 – $0.110
Stop: below $0.09
Target: $0.14 – $0.158
2. Conservative Breakout Play
Entry: after daily close and retest > $0.1582
Stop: below breakout retest
Target: $0.2168 / $0.3056
3. Short Setup (Bearish Bias)
Entry: if daily close < $0.096
Target: $0.071
Stop: above $0.105
---
📌 Conclusion
AIUSDT is trading at a make-or-break zone:
A breakout above $0.1582 could mark the start of a new bullish cycle.
A breakdown below $0.096 would confirm continuation of the bearish trend.
Watch daily closes, breakout volume, and momentum indicators carefully to avoid false breakouts.
#AIUSDT #Crypto #Altcoins #TechnicalAnalysis #PriceAction #SupportResistance #CryptoTrading #BullishScenario #BearishScenario #SwingTrade

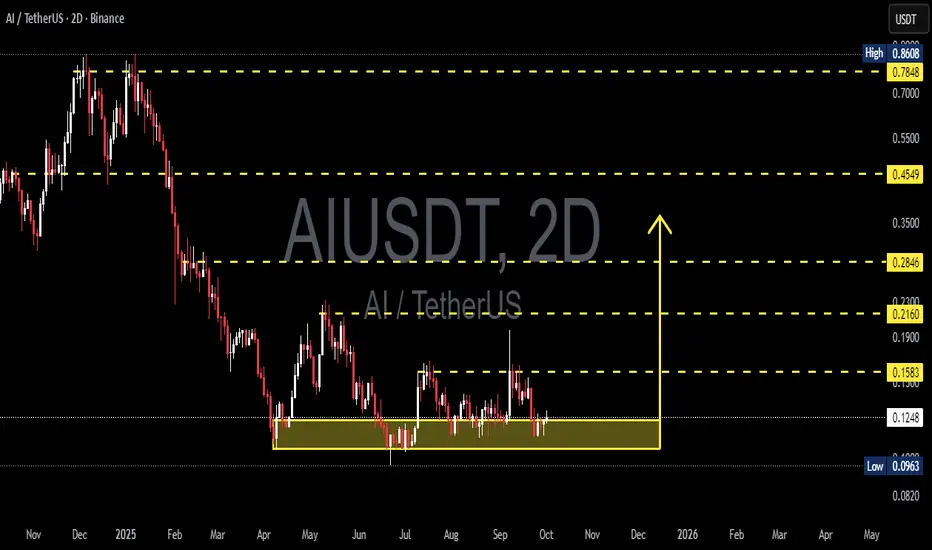
AIUSDT 3DAI ~ 3D Analysis
#AI This is the lowest support block for now, buy from here if you still have a Conviction on this Coin with a minimum target of 15%+

AIUSDT Analysis: Focused on Key Reaction ZonesIn AIUSDT, I aim to avoid getting lost in intermediate areas . The blue boxes represent zones that are likely to react, making them valuable for strategic positioning. I plan to hold my position until at least the 0.26 level , as it aligns with my overall target.
Key Points:
Reaction Zones: Blue boxes are areas with high potential for price response.
Target Level: Holding positions until 0.26.
Strategic Focus: Avoiding intermediate, less meaningful areas.
Confirmation Indicators: I will use CDV, liquidity heatmaps, volume profiles, volume footprints, and upward market structure breaks on lower time frames for validation.
Learn With Me: If you want to master how to use CDV, liquidity heatmaps, volume profiles, and volume footprints to identify precise demand zones, just DM me. I’d be happy to guide you!
Reminder: Be aware of the market's current state and approach it with caution. Successful trading relies on meaningful levels and robust confirmations.
If you think this analysis helps you, please don't forget to boost and comment on this. These motivate me to share more insights with you! Wishing everyone success in their trades.
If you think this analysis helps you, please don't forget to boost and comment on this. These motivate me to share more insights with you!
I keep my charts clean and simple because I believe clarity leads to better decisions.
My approach is built on years of experience and a solid track record. I don’t claim to know it all, but I’m confident in my ability to spot high-probability setups.
If you would like to learn how to use the heatmap, cumulative volume delta and volume footprint techniques that I use below to determine very accurate demand regions, you can send me a private message. I help anyone who wants it completely free of charge.
My Previous Analysis
🐶 DOGEUSDT.P: Next Move
🎨 RENDERUSDT.P: Opportunity of the Month
💎 ETHUSDT.P: Where to Retrace
🟢 BNBUSDT.P: Potential Surge
📊 BTC Dominance: Reaction Zone
🌊 WAVESUSDT.P: Demand Zone Potential
🟣 UNIUSDT.P: Long-Term Trade
🔵 XRPUSDT.P: Entry Zones
🔗 LINKUSDT.P: Follow The River
📈 BTCUSDT.P: Two Key Demand Zones
🟩 POLUSDT: Bullish Momentum
🌟 PENDLEUSDT.P: Where Opportunity Meets Precision
🔥 BTCUSDT.P: Liquidation of Highly Leveraged Longs
🌊 SOLUSDT.P: SOL's Dip - Your Opportunity
🐸 1000PEPEUSDT.P: Prime Bounce Zone Unlocked
🚀 ETHUSDT.P: Set to Explode - Don't Miss This Game Changer
🤖 IQUSDT: Smart Plan
⚡️ PONDUSDT: A Trade Not Taken Is Better Than a Losing One
💼 STMXUSDT: 2 Buying Areas
🐢 TURBOUSDT: Buy Zones and Buyer Presence
🌍 ICPUSDT.P: Massive Upside Potential | Check the Trade Update For Seeing Results
🟠 IDEXUSDT: Spot Buy Area | %26 Profit if You Trade with MSB
📌 USUALUSDT: Buyers Are Active + %70 Profit in Total
🌟 FORTHUSDT: Sniper Entry +%26 Reaction
🐳 QKCUSDT: Sniper Entry +%57 Reaction
I stopped adding to the list because it's kinda tiring to add 5-10 charts in every move but you can check my profile and see that it goes on..

AIUSDT 2DAI ~ 2D
#AI if you have Conviction on the coin this,. Buy gradually on this support block,. with a minimum target of 15%++.
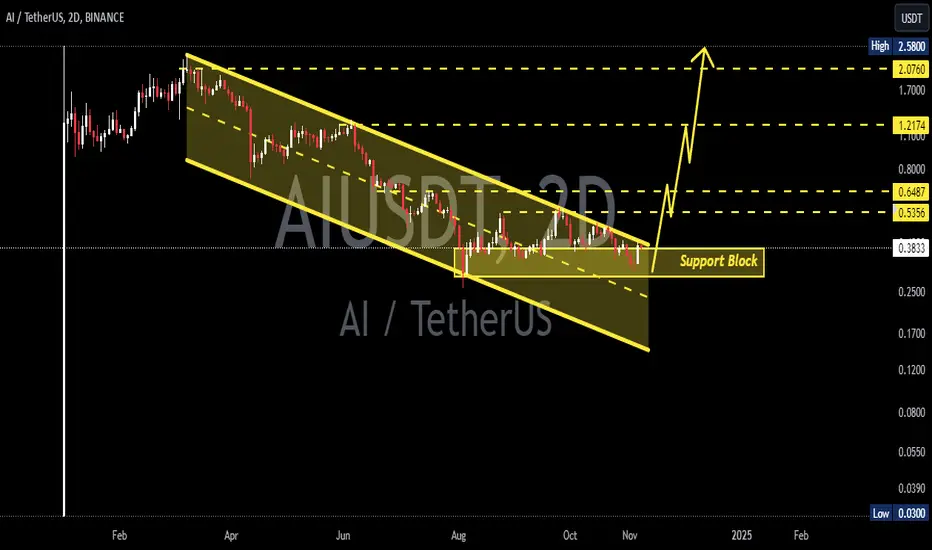
AIUSDTAI ~ 2D ✅
#AI we will never see bulls on this coin,. before this descending channel is successfully broken.
✅ If you have Conviction on this coin,. It's best to wait for this descending channel to successfully break through to make a purchase on this coin.

AI/USDT Breakout Alert! Indicating continue the upward movement.💎 AI has recently experienced notable market dynamics. Presently, AI has broken out of a bullish flag pattern, signaling a continuation of the upward movement.
💎 There's potential for AI to continue its ascent towards the maximum target of the bullish flag pattern.
💎 However, if AI fails to sustain its upward trajectory and retraces back towards the support area, it may indicate a loss of bullish momentum.
💎 AI must bounce from the support area if it intends to maintain its upward movement. A breakdown below the support could signal a shift to bearish sentiment, potentially leading to further downward movement for AI.
