BTC: buyer holds 86,116, seller aims lowerThis analysis is based on the Initiative Analysis (IA) method.
Hello traders and investors!
On the daily timeframe, the market is in a sideways range. The seller initiative is active.
On one hand, on the daily timeframe the price is being held above 86,116. On the other hand, yesterday’s seller candle, formed on even higher volume than on December 15, swept liquidity above the high of the previous high-volume seller candle.
Based on this, I assume that the price is still likely to move down toward 83,822 within the seller’s initiative.
Profitable trades!
Alexeywolf

Bitcoin: Seller Initiative and Targets 83,822–80,600This analysis is based on the Initiative Analysis (IA) method.
Hello traders and investors!
On the daily timeframe, Bitcoin price is moving within a sideways range, while the active initiative remains with the seller.
The first downside target is 83,822, followed by 80,600.
An interesting detail within the seller initiative: the key candle (the candle with the highest volume within the initiative, marked as IC on the chart) is still a buyer candle that formed at the upper boundary of the range.
On December 14, the seller absorbed this candle, and on December 15, the seller confirmed presence with additional volume.
Looking at the 1-hour timeframe, we can see a range from which price has now broken below the lower boundary.
The key breakout candle pierced the lower boundary of the range — also marked as IC on the chart.
In the current structure, there are several serious obstacles for long positions:
the first resistance zone is 87,500–88,184;
the second resistance zone is 89,500–90,052.
Given the overall structure and the active daily seller initiative, the base scenario is further downside movement within the current range.
Profitable trades!

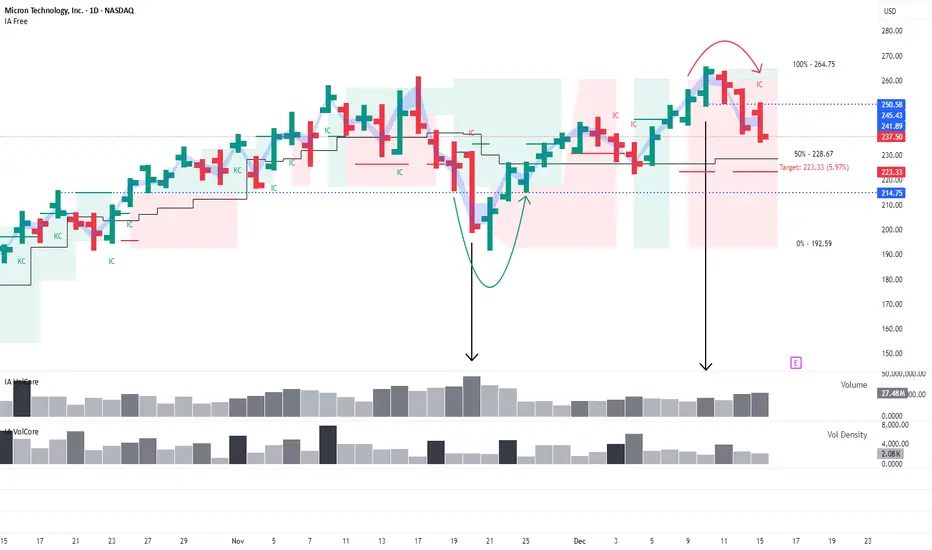
MU: false breakout at the upper boundary of the rangeThis analysis is based on the Initiative Analysis (IA) method.
Hello traders and investors!
Micron Technology (MU) shares are currently trading in a sideways range. At this stage, the active initiative belongs to the seller.
At the upper boundary of the range, a false breakout was formed — a breakout above the range high on increased volume.
After that, the seller engulfed the buyer’s candle, which strengthens the seller’s position within the range.
It is also worth noting that the key candle of the seller’s initiative — the candle with the highest volume (marked as IC on the chart) — also belongs to the seller, confirming supply-side control.
Potential seller targets:
first target — 223.33
second target — 214.75
The blue band on the chart represents the minimum price range of the candle in which at least 50% of the volume was traded, helping to more accurately identify the zone of market participant activity.
Wishing you profitable trades!
WTI Oil: Key levels for long-term buyingThis analysis is based on the Initiative Analysis (IA) method.
Hello traders and investors!
I reviewed the higher timeframes for oil, and the 2-month chart shows an interesting structure. Price is moving within a very wide sideways range, roughly from $11 to $147.
The lower boundary of this range has already been defended by buyers in the past — in 2016 and again in 2020-2021.
At the moment, seller initiative dominates within this range, with a potential target around 48.52.
The 48.52 level represents the upper boundary of a buyer zone that has not yet been tested. This zone was formed by a high-volume candle, which adds to its significance. The base of that candle — the 47.071–48.52 range — is an area where it makes sense to look for long-term buying patterns.
The 42.206 level is even more attractive for identifying long-term buying opportunities.
The first target for long-term long positions, if this scenario plays out, is 95.501, which corresponds to a test of the seller zone.
Wishing you profitable trades!

BTC at the upper boundary: mixed signalsThis analysis is based on the Initiative Analysis (IA) method.
Hello traders and investors!
On the 4-hour timeframe, an absorption pattern has formed at the upper boundary of the range. At the same time, a buyer zone begins immediately below, where a buyer reaction may appear.
On the daily timeframe, the structure remains within the same sideways range. The touch of the upper boundary came on a volume spike, and key volume was accumulated in the upper part of the range — which is a positive sign.
However, this daily candle has two details that raise questions:
First: the highest volume was accumulated around 90,400, not at the top of the candle.
Second: despite the volume spike, it was still lower than the volume during the previous touch of the upper boundary, when the buyer showed initiative.
Therefore, if considering a short here, I would do so only after a break below 89,500 and confirmation that the seller is defending this level.
For now, the stance is neutral: observing how the structure develops on the 1-hour and 4-hour timeframes.
Wishing you profitable trades!

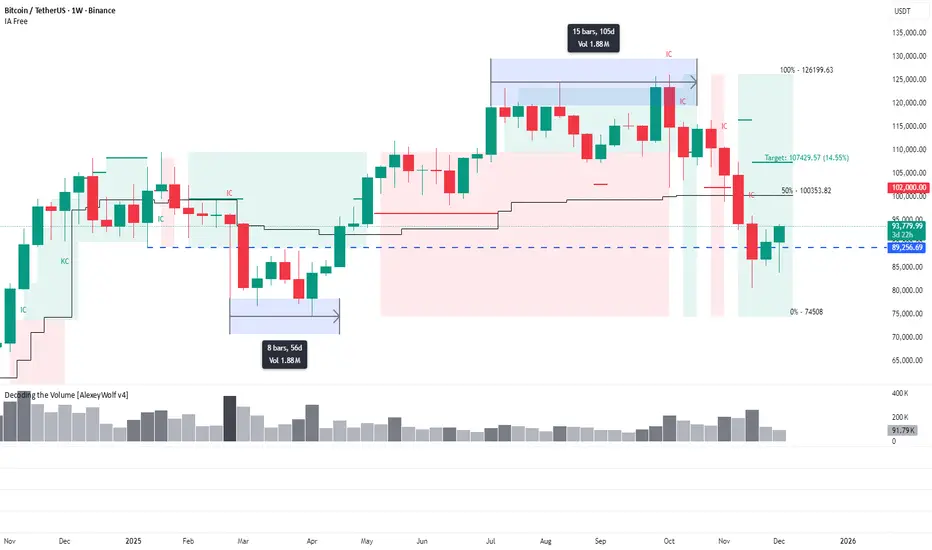
Volumes give clues: What the weekly range structure is showingThis analysis is based on the Initiative Analysis (IA) method.
Hello traders and investors!
On the weekly timeframe, Bitcoin remains in a sideways range. Notice how interestingly the price moved through its boundaries.
First, the lower boundary of the range at 89,256 was broken — and this is where a 1.88M volume was accumulated over 8 weeks .
Later, the price broke the upper boundary of the range, and the same 1.88M volume was distributed, but this time over just 15 days .
This indicates that there were far fewer buyers willing to buy at higher prices — the market needed almost twice as much time to distribute an identical volume.
Now the price has returned to the very zone where the first major volume was accumulated.
For more details about the 86,000–79,500 zone, see the related post.
Wishing you profitable trades!
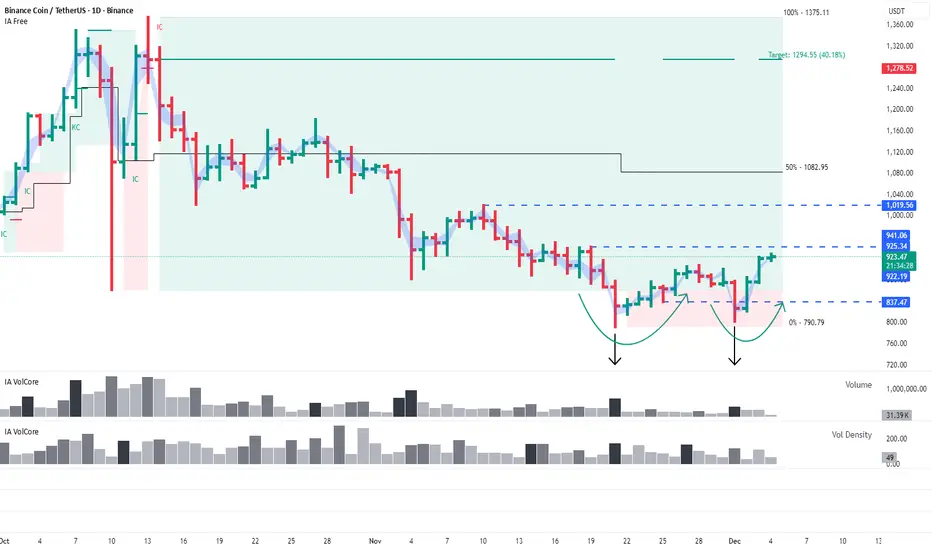
BNB: Buyers defend the lower boundary of the range againThis analysis is based on the Initiative Analysis (IA) method.
Hello traders and investors!
A reminder: the daily timeframe is still in a sideways range.
At its lower boundary, another false-break pattern has formed — this time at the 837 level: a seller’s attack on high volume followed by a confident absorption by buyers.
The nearest targets remain the same: 941 and 1019.
Wishing you profitable trades!
Bitcoin at the daily target: what comes after 93,092?This analysis is based on the Initiative Analysis (IA) method.
Hello traders and investors!
On the daily timeframe, Bitcoin has formed another confident buyer absorption — and this absorption was simultaneously a manipulation (a false breakout) of the 86,116 level.
Notably, the seller’s candle appeared with increased volume, and the subsequent absorption created a new buyer zone.
The buyer target within the current range — 93,092 — is almost reached.
Given the strength of buyer initiative, further movement toward 94,000 or even 97,000 cannot be ruled out.
However, once the price reaches 93,092, it is reasonable to expect seller initiative.
This is classic market behavior near a target: some buyers take profit while sellers get an opportunity to step in.
Wishing you profitable trades!

S&P 500: two false breakouts and signs of slowing momentumThe bullish scenario is still valid, but the market shows signs of exhaustion and a potential correction.
This analysis is based on the Initiative Analysis (IA) method.
Hello traders and investors!
On the weekly timeframe, the S&P 500 remains in a sideways range that has been forming since October.
The initiative is held by the buyers.
Upside targets:
First target: 6,883
Second target: a new ATH
Key observations inside the range
Two buyer-driven false breakouts (level manipulations).
Within this sideways structure, two clear false-breakout patterns have formed — both caused by buyers:
October 6 — manipulation around 6,580: A volume-backed attack by sellers → followed by buyer absorption → followed by a new ATH.
Manipulation around 6,637: A similar structure: strong seller attack → buyer absorption.
This pattern suggests that another ATH update is likely.
Signs of a potential pause or correction
The highest weekly volume in six months.
During the week of November 17, the index printed its largest weekly volume since April.
For a weekly timeframe, this is a meaningful signal — clear seller interest around current prices.
It is also possible that traders and funds are adding hedges in anticipation of a deeper correction.
A change in buyer behavior.
Looking at the entire move since May:
during the uptrend, no manipulations occurred — buyers simply pushed the price higher;
now, two manipulations inside a single range have already appeared, suggesting that buyers are finding it harder to push the market upward.
This is the second sign of potential momentum exhaustion.
Trading conclusions
Short-term (intraday):
Trades can be taken in both directions — the market is in a range, and both boundaries can be worked.
The daily timeframe also remains in a sideways structure.
Long-term (swing/position):
If positions are not for hedging, entries should be taken with caution.
Inside the range:
longs make sense when buyers defend the lower boundary,
shorts — when sellers defend the upper boundary.
Wishing you profitable trades!

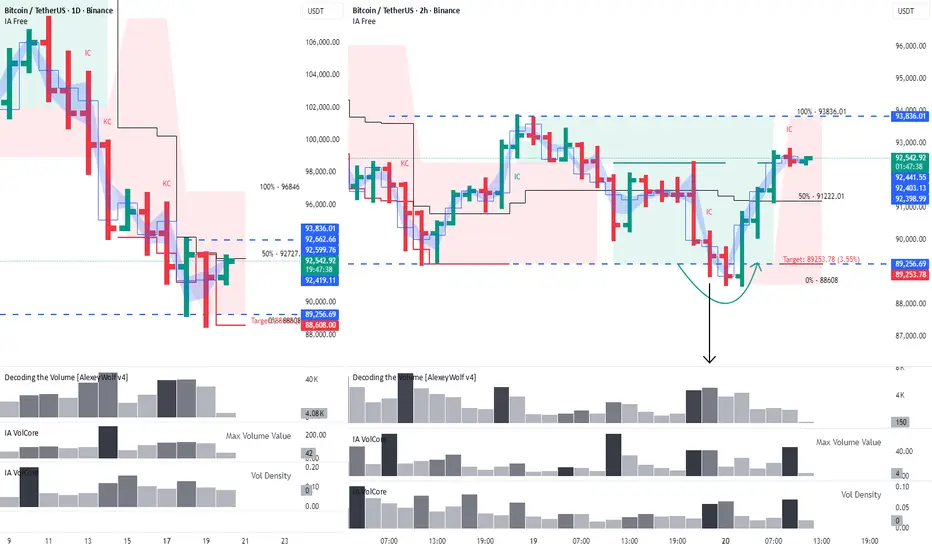
BTC: buyers have brought the price back into the range.This analysis is based on the Initiative Analysis (IA) method.
Hello traders and investors!
On the 4-hour timeframe, the buyer has brought the price back into the range and absorbed the seller’s attack bar at the lower boundary.
A buyer initiative is developing on the 4H chart, with a target at 93,160.
It’s possible that buyers will manage to break the upper boundary of the range, which is currently at 93,836.
On the daily timeframe, the price touched the 89,256 level, and a new range is starting to form. Within this range, the nearest seller target is 89,253.
Key levels for potential long setups are buyer defenses at 89,253 and 86,116.
Sellers can look for short setups if the upper boundary of the range is defended by the seller on the 4-hour timeframe, with a target at 89,256.
Wishing you profitable trades!

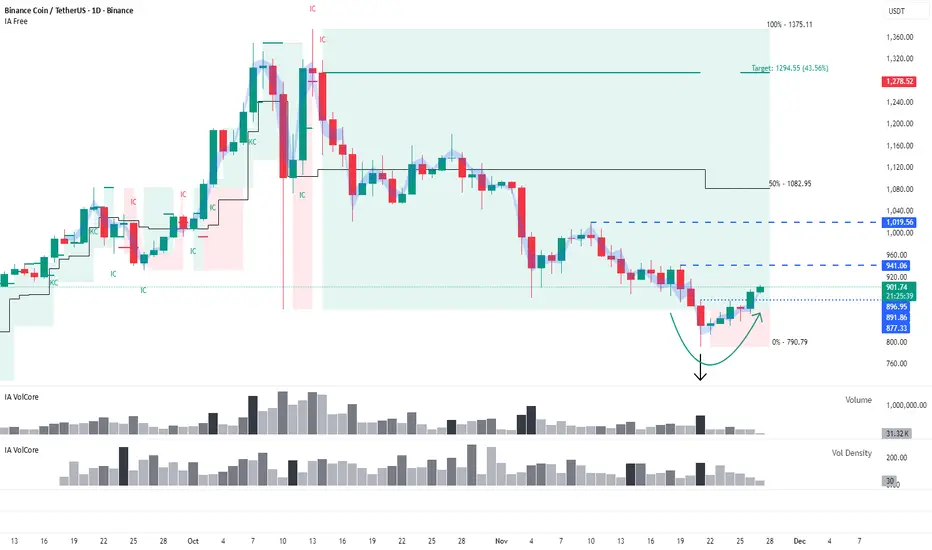
BNB: Long setups remain a priorityBuyers may still show strength despite the lack of interaction with a key level.
This analysis is based on the Initiative Analysis (IA) method.
Hello traders and investors!
On the daily timeframe, the market is in a sideways range, and a false-break pattern of the lower boundary has formed.
We see a seller’s attack on volume at the level, followed by a bullish absorption of the attack candle.
There is one detail: during the formation of this pattern, the price stopped roughly 11 dollars short of the 50% level of the monthly trading range.
Even with this nuance, the long scenario remains valid.
The first target is 941.
Wishing you profitable trades!
BTC: Buyer Zone Holds the PressureDaily buyer zone shows a successful test; 2H chart points to active buyer initiative with a target at 88,519.
This analysis is based on the Initiative Analysis (IA) method.
Hello, traders and investors!
On the daily timeframe, a buyer zone has formed at the end of the seller initiative. Yesterday, this buyer zone was tested by a seller bar on declining volume, which looks more like a test rather than active selling.
On the 2-hour timeframe, we have a sideways range with an active buyer initiative, and the nearest target is 88,519.
Yesterday, the seller attempted to push the price lower on increased volume, but the move stalled within the key volume area (87,000–86,000) of the daily buyer candle — the candle that formed the buyer zone on the daily chart.
Wishing you profitable trades!

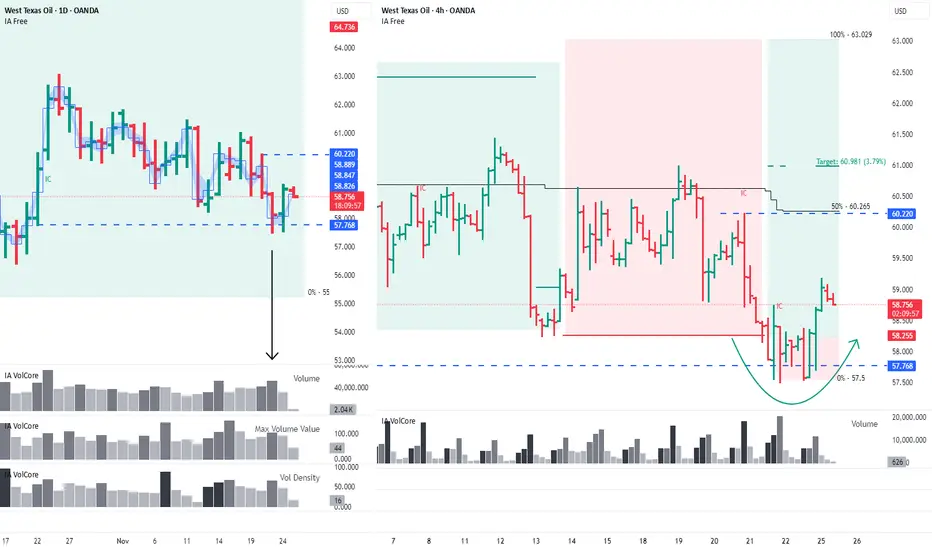
WTI: Buyers Return After a False BreakoutOn the daily timeframe, buyers absorbed the sellers, and a false-breakout pattern has formed on the 4H chart. The nearest targets are 60.22 and 60.981.
This analysis is based on the Initiative Analysis (IA) method.
Hello, traders and investors!
Oil is showing early signs of recovery. On the daily timeframe, the key level is 57.768 — the base of a buyer candle with increased volume during the last upward impulse. A high-volume seller candle interacted with this level, and yesterday’s daily buyer candle absorbed the seller, indicating strengthening buyer initiative. It’s also worth noting that in both candles, the key volume was accumulated at the bottom.
The blue band on the chart represents the minimal price range of the candle where 50% of the volume was accumulated.
The blue line marks the price level with the maximum accumulated volume.
On the 4-hour timeframe, the price is in a sideways range. A false-breakout pattern has just formed at the lower boundary of this range. The nearest target is 60.22, which aligns with the 50% level of the trading range — an important point to monitor. The next target is 60.981.
Wishing you profitable trades!
Gold: Overview 24.11This analysis is based on the Initiative Analysis (IA) method.
Hello, traders and investors!
The gold price on the daily timeframe is in a sideways range.
A seller initiative is active, with a target at 3928.
On the daily chart, the levels 4133 and 4154 are of interest for potential short opportunities, as well as the 4110 level — which is both an hourly timeframe level and the high of a seller candle with increased volume.
The first target for short positions is 3998.
Long positions should be considered only when we see signs of buyer strength on the daily timeframe — this may happen near 3998 or 3928.
Wishing you profitable trades!

Natural Gas: Correction Ahead?Pullback expected after five weeks of growth; key levels 4.283 and 4.194 in focus.
This analysis is based on the Initiative Analysis (IA) method.
Hello, traders and investors!
After five weeks of steady growth, natural gas now appears to be preparing for a correction.
On the daily timeframe, a sideways range has formed, and the seller’s formal target inside this range has already been reached.
On the 4-hour timeframe, we also see a sideways structure, but seller initiative is active. The current seller target is 4.194.
A large volume cluster has formed at the upper boundary of the range, and the price is now breaking downward from that area. This zone becomes a broad seller area at the top of the range.
It’s important to watch how the price reacts around 4.283, which represents 50% of the trading range. For now, the expectation remains the same: a move toward 4.194.
A good area to look for short entries would be around 4.392, if the price gives a pullback into that zone.
Wishing you profitable trades!

BTC: price enters the buyer zone (86,000–79,500)This analysis is based on the Initiative Analysis (IA) method.
Hello, traders and investors!
On the monthly timeframe, the last buyer candle with increased volume appeared a year ago — in November 2024. From that point, buyers attempted to resume the trend twice.
The first attempt — in January — formed the level 89,256.
The second attempt came after a manipulation of the 89,256 level between February and April 2025.
This led to the formation of a new buyer initiative with:
— upper boundary at 126,199,
— lower boundary at 74,508.
The current buyer target from this initiative is 109,608.
Now the price has returned to the volume accumulation zone created during that manipulation — the 86,000–79,500 range.
The blue band on the chart marks the minimal price range where 50% of the candle’s volume was accumulated.
The blue line marks the price of the maximum volume inside that candle.
The daily candle from 21.11 has entered the 86,000–79,500 range with the largest volume since April 2025.
(And April 2025 was exactly when the 89,256 level manipulation took place.)
This confirms buyer interest in this price zone.
This daily candle is part of the forming seller initiative.
The upper boundary of this seller initiative is 93,836, while the lower boundary is not yet defined, as the seller move has not been stopped by a buyer candle.
Any market scenario remains possible. With strong seller pressure, the price may fall below 74,508 (lower boundary of the monthly buyer initiative) or even below 66,835 (the low of the November 2024 buyer candle).
A consolidation phase is also possible — and even the most likely — but for that, we first need to see a buyer candle, followed by a return to 89,256 or higher.
We continue to monitor the situation.
Wishing you profitable trades!

BTC: first signs of a slow reversal?The 89,256 level has slowed down Bitcoin’s decline.
Hello, traders and investors!
This analysis is based on the Initiative Analysis (IA) method.
First, price interacted with the level through a buyer candle with strong volume, and then again through a seller candle with declining volume on the daily timeframe.
On the 2-hour timeframe, the second interaction with this level turned out to be a manipulation of the lower boundary of the range that has formed on 2H.
The target of that manipulation has already been reached, but we may still see price move toward 93,836.
Reaching this level would be a good signal that at least a temporary pause in the downtrend is forming — and possibly the early stage of a reversal, although likely a slow one.
Wishing you profitable trades!
BTC Approaches 89,256Hello, traders and investors!
This analysis is based on the Initiative Analysis (IA) method.
Bitcoin’s price is getting closer to the 89,256 level.
Yesterday, November 17, the daily candle closed as a seller candle.
The volume was accumulated in the upper part of the candle, and the candle itself showed increased volume.
In this configuration, a continuation of the seller’s move is quite likely.
Wishing you profitable trades!

BTC: The Key Buyer Zone Lies Even LowerThe 89,256 level remains a relevant demand zone across all timeframes — from monthly to daily. The 86,000–79,500 area is the key volume zone where a long-term buyer is most likely to appear.
Hello, traders and investors!
This analysis is based on the Initiative Analysis (IA) method.
Let’s take a look at the Bitcoin monthly chart and identify the zones where a buyer is likely to appear.
The last buyer initiative began at 74,508 and ended at 126,199.
The 50% level of this initiative — 100,353 — was already tested in November.
The key candle (marked on the chart as KC, the candle with the highest volume within the buyer initiative) sits at the base of the move.
Notably, this key candle formed as a manipulation (false breakout) of the 89,256 level.
For this reason, the 89,256 level remains highly relevant on the monthly timeframe — this is a zone where a long-term buyer may reappear.
During that manipulation, the key volume was accumulated in the 86,000–79,500 range (!).
On the weekly chart, the 89,256 level is also important — it represents the previous lower boundary of the weekly range, which is still relevant.
On the daily chart, this level remains meaningful as well, since it is an untouched target from the previous daily range (marked with a red line).
Thus, the area around 89,256 — together with the volume zone 86,000–79,500 — is a strong candidate for finding long setups.
Wishing you profitable trades!

BTC Daily: Buyers Regain Control, but Watch 104,534Hello, traders and investors!
This analysis is based on the Initiative Analysis (IA) method.
On the daily timeframe, the market remains in a sideways range, with an active buyer initiative targeting 116,400.
Buyers managed to bring the price back into the range.
If sellers defend the 104,534 level, the current move may turn out to be a level manipulation, and the price could potentially retest or even break below the local low at 98,944.
Wishing you profitable trades!

EURUSD: Buyer initiative or just a correction?Hello, traders and investors!
This analysis is based on the Initiative Analysis (IA) method.
On the daily timeframe, the market is in a sideways range, with a buyer initiative targeting 1.182.
The current upward movement looks more like a correction following the seller’s impulse.
At the base of the seller’s move, there is a high-volume bar, which yesterday’s candle interacted with.
We’ll watch how things unfold — so far, the buyer hasn’t shown activity.
It’s possible that buying may only start from the 1.14463 level.
Wishing you profitable trades!

Bitcoin: Sellers Pushed the Price Below the RangeThe price tested the 50% level of the monthly range (100,353)
Hello, traders and investors!
This analysis is based on the Initiative Analysis (IA) method.
On the daily timeframe, the market remains in a sideways range, and the seller initiative managed to push the price below its lower boundary.
The price also interacted with the 50% level of the monthly trading range — 100,353.
These two factors may trigger buying activity and a potential return of the price back into the range.
Within the seller initiative, we can see four seller candles with increasing volume, with the highest volume at the bottom — the IC candle.
To look for buying opportunities, the price needs to return into the range.
Absorption of the seller’s IC candle would be a good sign to start looking for long setups.
Nearest key levels on the daily timeframe:
— Lower boundary of the range — 102,000
— High of the seller candle that broke the lower boundary — 107,299
If we look at the 1-hour timeframe, there’s also a nearby level at 107,672, which corresponds to the 50% level of the hourly trading range.
If buyers start to move, it will be important to watch how they handle the 107,299–107,672 zone.
Wishing you profitable trades!

EURUSD: Buyers not yet activeDaily range continues as seller initiative completes; potential buyer move toward 1.1820
Hey traders and investors!
This analysis is based on the Initiative Analysis (IA) method.
EURUSD is currently in a sideways range on the daily timeframe.
The seller initiative has reached its target, and now a buyer initiative is projected, with a target at 1.1820.
However, the weekly timeframe target sits much lower — at 1.16082.
So far, we don’t see active buying; candle volumes are declining.
It’s possible that meaningful buying will only start from the 1.14463 level.
Wishing you profitable trades!
