The 4H Fortress: Why Macro Patience Beats Micro Noise
Most retail traders get liquidated in the "noise" of the 5-minute or 15-minute charts. They chase ghosts. At OrangePulse, we prefer the **4H Fortress.**
Trading the 4-hour timeframe with the LITE algorithm is the ultimate exercise in institutional-grade patience. When you move to the 4H chart, you aren't just trading price—you are trading **market structure.**
The Logic of the 4H LITE Strategy:
1. **Mathematical Significance:** A "Deep Divergence" signal on a 4H chart is far more powerful than on lower timeframes. It indicates a massive exhaustion of sellers that usually leads to a structural reversal, not just a minor bounce.
2. **The 3-SO Efficiency:** Because 4H entries are so selective, the 3 Safety Orders (SOs) provided by the LITE version are often more than enough. You aren't catching a falling knife; you are stepping in when the knife has already hit the floor.
3. **Reduced Drawdown:** By ignoring the intraday "fakes," your capital stays liquid. Your bot might trade less often, but its win rate and capital efficiency (ROI per trade) skyrocket.
The Institutional Edge:
While the rest of the market is panicking over a 15-minute candle, the 4H LITE strategy is calmly waiting for the statistical extreme. It is better to have one "Sniper" entry per week that hits the target than ten "Gambler" entries that drain your SOs.
In the long run, the patient machine always wins. 🍊📈
Algo

BTCUSD Institutional Levels: Sell Premium 97 500–102 000🔱 BTCUSD WEEKLY SNAPSHOT — EXECUTIVE SUMMARY
✨ Bitcoin positioned in a late-cycle distribution structure with elevated bull trap risk
🔴 Primary sell-side liquidity magnet reclaimed at 97 500 confirms seller interest
🔄 Current price action shows upside probes without sustained acceptance
🧱 Institutional sell zones stacked above market
• 100 000 psychological magnet
• 102 000 technical overshoot and bull trap extension
🟡 Reaction resistance zone at 97 500
📉 Bearish-to-neutral bias remains valid below 102 000
🎯 Downside liquidity objectives
• First buy-side liquidity pocket at 85 000
• Major accumulation and max pain zone at 80 000
⬇️ Market structure shows expansion up without follow-through followed by fast rejection risk
⏳ Expect upside attempts to be sold into rather than accepted
⚠️ Invalidation requires sustained acceptance and consolidation above 102 000
🎯 Strategy Sell strength into premium zones Buy only after liquidity sweep into discounts
🏦 Larger accumulation favored only after buy-side liquidity is cleared below 85 000 to 80 000
🧠 BTC MARKET LOGIC — INSTITUTIONAL READ
• Sellers active at psychological and technical round numbers
• Upside extensions used to distribute inventory
• 97 500 acts as a pivot between distribution and acceleration
• Acceptance above 100 000 required to flip bias
• Failure near highs increases probability of fast drawdown into liquidity pools
• Downside targets represent value zones not momentum trades
🗳️ BTC WEEKLY SCENARIOS — WHAT’S YOUR PLAY?
Which path do you expect for BTC next?
🅰️ Rejection at 97 500 to 100 000 → breakdown toward 85 000
Classic distribution into sell-side liquidity
🅱️ Spike into 100 000 to 102 000 → sharp rejection → fast drop to 80 000
Textbook bull trap and liquidity sweep
🅲 Range below 97 500 → compression → expansion lower into 85 000
Slow build before acceleration
🅳 Your level Drop ONE BTC price you are watching most this week 👇

Why the 1H Timeframe is the 'Sweet Spot' for DCA Bots
In the world of algorithmic trading, more data isn't always better—it’s often just more noise. Many traders make the mistake of running DCA bots on 1m or 5m timeframes, only to see their safety orders get "chewed up" by minor market fluctuations.
At OrangePulse, we recommend the 1-Hour (1H) Timeframe as the primary engine for our v3.0 strategy. Here’s why:
Filtering the Noise: 1H candles represent significant capital movement. By waiting for a 1H confirmation, the bot avoids "fakeouts" that happen on lower timeframes, ensuring your Base Order (BO) starts on a more reliable signal.
Safety Order Integrity: On lower timeframes, a quick 1% wick can trigger multiple Safety Orders (SO) in seconds, over-leveraging your position before a real recovery starts. On the 1H, your grid has "room to breathe," allowing the math to work in your favor during structural moves.
Execution vs. Over-trading: High-frequency DCA leads to high fees and high stress. The 1H timeframe strikes the perfect balance between keeping the bot active and maintaining extreme precision.
Conclusion: Trading isn't about how many trades you take, but how many you survive and close in profit.
OrangePulse Tip: Our v3.0 LITE is optimized to handle these 1H swings with a sophisticated "Target Drag" effect—bringing your profit line to the price faster than the market can react.

ALGO Approaching Decision Zone Near TrendlineAlgorand has been trading under a long term descending trendline and is now compressing near a critical support zone. Price action shows the formation of a potential inverse head and shoulders structure while still respecting the broader downtrend.
The neckline area aligns closely with the descending trendline, making this zone extremely important. A successful breakout above this trendline would invalidate the bearish structure and open the path for a stronger upside continuation toward higher resistance levels.
However, if price fails to break the neckline and loses the local support, a downside move toward the lower liquidity zone is possible to complete the wick fill. This would keep the broader bearish trend intact.
Momentum is tightening and volatility is likely to expand soon. The next move from this area should define the short to mid term direction.

The "V-Recovery" Logic: Why DCA Targets Move Faster Than Price
Most traders think they need a full V-recovery to get back to break-even. They don't. By the time a 15% drop hits the 5th Safety Order, your average price is already halfway down the cliff.
This visual guide shows the math of the 'Pivot Point'. You don't need the price to return to your entry; you only need a 3-5% bounce to exit the entire position in profit. Stop trading with hope, start trading with a ladder.

DCA Target Drag: Why You Don't Need a Full Recovery
One of the biggest misconceptions in trading is that if you buy an asset at $100 and it drops to $80, you need it to go back to $100 to break even. In a DCA (Dollar Cost Averaging) system, every Safety Order (SO) 'drags' your Take Profit (TP) target closer to the current price.
Using the OrangePulse LITE visual framework, we can see exactly how this works. By adding volume at lower levels, your average price drops significantly. The bot automatically recalculates the new TP line based on the updated average. This means a minor 5% relief bounce can exit a trade that is currently 15% in drawdown.
Conclusion: Success in DCA isn't about picking the bottom; it's about the speed of the target adjustment. Math > Predictions.

BB + RSI: Ultimate Mean Reversion
BB + RSI: Ultimate Mean Reversion 🍊
🍊 Summary
Most traders use Bollinger Bands or RSI in isolation, but they often lead to "false breakouts" or "riding the bands." This idea breaks down the power of **Confluence**—where mathematical extremes meet market exhaustion—using the **OrangePulse LITE** framework.
---
📊 Visual Breakdown (Analyzing the Screenshot)
1. The Entry: Pure Confluence
Look at the most recent trade on the right side of the chart:
* **Bollinger Bands:** Price pierces the lower band, indicating a statistical deviation from the mean.
* **RSI:** Simultaneously, the RSI drops below 30, confirming that the asset is mathematically oversold.
* **The Result:** This "Sweet Spot" is where the probability of a relief bounce is highest.
2. The "Step-down" Effect (DCA in Action)
Notice the **Yellow line (Average Price)** and **Green line (Take Profit)**:
* Every time a **Safety Order (SO)** is filled (indicated by the small blue arrows), these lines instantly drop.
* **Why this matters:** You don't need the price to return to your original entry to profit. The bot automatically "brings the target to the price."
* In this 1h BTC chart, you can see how the target was brought down significantly, allowing for a much faster exit on the first sign of recovery.
3. Precision & Discipline
Automated trading isn't about "winning every trade" instantly. It's about having a plan for when the market moves against you.
* **Patience:** The bot waits for the exact moment both conditions align.
* **Execution:** No emotions, no hesitation. Just math.
---
⚙️ How to Use This
This exact logic—the confluence triggers, the automated DCA lines, and the real-time status table—is the core engine of the **OrangePulse v3.0 LITE** script.
It's designed to be a reliable "Mean Reversion" tool for traders who want to automate their discipline without complex setups.

The "Inverted" DCA: How to Profit from Overextended Pumps
Dollar Cost Averaging (DCA) is usually associated with "buying the dip." But in a professional trading environment, the same mathematical principles can be applied to Shorting overextended rallies.
Today we are looking at how to use OrangePulse Lite to capture "Mean Reversion" moves to the downside.
1. Identifying the "Exhaustion" Instead of just shorting blindly, we look for Confluence:
Price is above the Upper Bollinger Band (statistically overextended).
RSI is in the Overbought zone (>70). This suggests the "pump" is losing steam and a return to the mean (average price) is likely.
2. Building the Short Position Shorting a strong rally is dangerous because of "short squeezes." This is where DCA shines:
We enter a small Base Order (BO) at the first sign of weakness.
If the price continues to push higher, we add to our position via Safety Orders (SO).
This moves our "Short Average Price" higher, making it much easier to exit in profit on the first minor retracement.
3. Psychology of a Short DCA While most traders are "FOMO-ing" into the top, the DCA bot is mechanically building a position. The goal isn't to pick the exact top, but to create an average entry that is higher than the eventual "Mean Reversion" point.
4. Risk Management Shorting has theoretically unlimited risk, so Max Safety Orders and a clear Stop Loss are mandatory. The Lite script allows you to visualize exactly where your "danger zone" starts.
Conclusion: DCA is a tool for volatility management, not just for long-term investing. By applying it to the short side, you can stay profitable even when the macro trend is bearish.

Maximizing Bull Runs: Fixed TP vs. Trailing Take Profit
One of the hardest decisions in trading is knowing when to exit. If you exit too early with a fixed Take Profit (TP), you might miss out on a "moon" move. If you hold too long, the price might reverse and wipe out your gains.
Today, we are exploring the logic of Trailing Take Profit—a dynamic way to stay in the trend as long as possible.
1. The Concept of "Activation" A Trailing TP doesn't start immediately. In the OrangePulse Lite logic, we use a Trail Activation %.
The trade first needs to reach a certain "safety profit" level.
Once hit, the bot "arms" the trailing logic (visualized by the purple line on the chart).
2. The "Trailing Distance" Once armed, the bot looks at the Highest High (for Longs) reached during the trade. The exit trigger is set at a fixed percentage below that high point.
If the price continues to rise, the exit line (purple) follows it up.
The price is effectively given "room to breathe," but the profit is locked in if a reversal occurs.
3. Fixed TP vs. Trailing TP Look at the attached chart:
A Fixed TP would have closed the trade at the green line, missing the final leg of the rally.
The Trailing TP (purple) stayed active during the entire push, closing the trade only when the momentum actually stalled and the price dropped by the trailing distance.
4. The Trade-off
Fixed TP: Higher reliability and faster capital turnover. Great for sideways markets.
Trailing TP: Captures the "meat" of a trend. Essential for parabolic moves.
Educational takeaway: Don’t be afraid to let your winners run, but always have a mechanical way to lock in those gains. Using a trailing algorithm removes the "greed factor" and ensures you exit based on price action, not emotions.

The Math of Mean Reversion: How DCA Lowers Your Break-Even Durin
Trading against the trend or catching a "falling knife" is often considered risky. However, when combined with mechanical Mean Reversion logic and Dollar Cost Averaging (DCA), it becomes a powerful statistical approach.
In this educational study, we are looking at how a structured DCA ladder helps a trader survive volatility by dynamically lowering the average entry price.
1. The Concept of Mean Reversion Prices don't move in a straight line. After an overextended move (to the upside or downside), the price tends to return to its "mean" or average. The goal of this strategy is to accumulate a position during the extension and exit as soon as the price starts its trek back to the average.
2. The Logic of Safety Orders (SO) Using the OrangePulse Lite opens-source framework, we can visualize how a position is built:
Base Order (BO): The initial entry based on a signal (e.g., oversold conditions).
Safety Orders (SO): Pre-placed limit orders at specific percentage deviations below the entry.
3. Why the "Break-Even" Moves The most important lesson in DCA trading is the Average Price. Look at the attached chart:
When the first SO is hit, the average price of the entire position drops significantly.
As a result, the Take Profit (TP) line moves closer to the current price.
This means you don't need the price to return to your original entry to exit in profit; you only need a small "relief bounce" to close the entire position.
4. Risk Management (The "DCA Trap") Education wouldn't be complete without mentioning the risks. The danger of DCA is a "black swan" event where the price never bounces.
Max Safety Orders: Always have a limit.
Volume Scale: If you double your size on every step (Martingale style), you run out of capital very quickly. A conservative multiplier (e.g., 1.4x - 1.6x) is often more sustainable.
Conclusion: DCA is not about "hoping" the price goes back up. It is a mathematical way to improve your probability of exit by adjusting your entry price during volatility.
Study this on your charts using the OrangePulse Lite script to see how the ladder handles historical dips.

100% UPSIDE Precious Metals Playbook — Gold, Silver & Miners ETF🏛️ Precious Metals Playbook — Gold, Silver & Miners ETFs
🔑 Executive Summary
• We combine the 2026 parabolic metals thesis gold/silver/platinum with leveraged ETF implementation to target triple-digit portfolio upside under view that gold’s bull run continues into 2026 $5,500–$6,500/oz.
• Miners’ torque has been massive in 2025: GDX ~+123% YTD while gold itself is up ~51% YTD; levered miners e.g., NUGT, JNUG, GDXU show ~360–700%+ YTD — confirming high beta to metal.
• Implementation below caps any single ETF at 10% within 10–20% limit and keeps ≥50% of the book in 2×–3× products for upside torque while diversifying across metal vs. miners and gold vs. silver.
________________________________________
🌍 Market View Condensed
• Gold: Momentum + macro easing bias, softer USD, central-bank demand support the “second-leg melt-up” case into 2026; miners’ margin torque can deliver 2–3× metal beta.
• Silver: Structural deficits + PV/EV/datacenter demand have super-charged silver miners in 2025.
________________________________________
📊 2025 YTD Scorecard Key ETFs
• Gold metal (unlevered): GLD +50.9% YTD.
• Gold miners (unlevered): GDX ~+123% YTD.
• Silver miners (unlevered): SIL ~+137% YTD.
• Leveraged miners:
o NUGT (2× miners) ~+361% YTD; JNUG (2× juniors) ~+394% YTD.
o GDXU (3× miners ETN) ~+706% YTD (top performer cohort of 2025).
• Leveraged gold & silver metals: UGL (2× gold) ~+125% YTD; DGP (2× gold ETN) ~+123% YTD; AGQ (2× silver) ~+159% YTD.
________________________________________
🧩 Portfolio Construction Target book: $100,000
Constraints honored: max 10% per ETF, ≥50% allocation to 2×/3× ETFs.
🎯 Target Allocation 60% leveraged / 40% unlevered
Leveraged — 60% total
• 10% GDXU 3× gold miners ETN
• 10% NUGT 2× gold miners
• 10% JNUG 2× junior gold miners
• 10% AGQ 2× silver
• 10% UGL 2× gold
• 10% DGP 2× gold ETN
Rationale: diversify torque across miners vs. metals, 2× vs. 3×, and gold vs. silver to avoid single-product concentration risk.
Unlevered — 40% total
• 10% GDX VanEck Gold Miners
• 10% GLD SPDR Gold Trust
• 10% SIL Global X Silver Miners
• 10% SLV (or) IAU silver or gold bullion, choose per preference
Rationale: ballast and liquidity; preserves exposure if volatility in levered products forces risk-off.
Dollar mapping (@ $100k):
• Each 10% line = $10,000 notional; 10 tickers → $100,000 fully invested.
________________________________________
📈 Scenario Analysis Hypothetical, path-dependent
Gold advances toward $5,500–$6,500 by 2026. We translate that into rough upside bands using historical betas and allowing for daily-reset drag on leveraged products.
• Base case +100% portfolio:
o Gold +40–60% from here; 2× gold funds net ~+70–110% conservative for compounding/decay.
o GDX sensitivity ~2–3× metal → ~+80–150%; 2× miners ~+160–300%; 3× miners can overshoot in trending tapes.
o With 60% in levered assets and 40% in unlevered miners/metals, blended outcome can land near ~+100% if trends persist and volatility stays manageable.
• Stretch case +200% portfolio:
o If the “second-leg melt-up” plays out momentum + flows + central-bank bid and miners’ margins expand, levered miners dominate returns similar to 2025 YTD pattern.
o Portfolio hits ~+200% if miners continue to over-beta the metal and 3× exposure compounds favorably no major whipsaws.
Risk reality check: Leveraged ETFs reset daily; high volatility or choppy reversals can erode returns even if the long-term trend is up. Position sizing 10% lines and diversification across instruments help mitigate single-name decay risk.
________________________________________
🧭 Implementation Notes
• Execution: stage entries over several days reduce gap/vol risk, prioritize liquid hours; use stop-loss/hedge bands on the 3× sleeve.
• Rebalancing: monthly bands ±3–5% per line to defend the 60/40 torque mix.
• Risk budget: expect 3× ETN drawdowns >60% in sharp pullbacks; keep dry powder OR pre-define risk limits.
________________________________________
🗂️ Product Appendix — Quick Stats
• GDXU (3× miners ETN): ~+706% YTD; ER ~0.95%.
• NUGT (2× miners): ~+361% YTD.
• JNUG (2× junior miners): ~+394% YTD.
• AGQ (2× silver): ~+159% YTD.
• UGL (2× gold): ~+125% YTD.
• DGP (2× gold ETN): ~+123% YTD.
• GDX (miners): ~+123% YTD.
• SIL (silver miners): ~+137% YTD.
• GLD (gold): ~+50.9% YTD.
________________________________________
⚠️ Disclosures & Risks
Leveraged ETFs/ETNs are short-term trading tools with daily reset/compounding; they can significantly underperform their leverage multiple over holding periods with high volatility or mean-reversion. ETNs (e.g., GDXU, DGP) also carry issuer credit risk. This memo is informational, not investment advice; consider your risk tolerance, liquidity needs, and tax/ETN suitability.

#ALGO/USDT - this will go Short#ALGO
The price is moving in a descending channel on the 1-hour timeframe. It has reached the upper limit and is heading towards breaking downwards, with a retest of the upper limit expected.
We have an upward trend on the RSI indicator, which has reached near the upper limit, and a downward reversal is expected.
There is a major resistance zone in green at 0.1440. The price has bounced from this zone multiple times and is expected to bounce again.
We have a trend of consolidation above the 100-period moving average, as we are moving close to it, which supports a downward move towards touching it.
Entry price: 0.1343
First target: 0.1316
Second target: 0.1287
Third target: 0.1250
Stop loss: Above the resistance zone in green.
Don't forget a simple thing: money management.
For inquiries, please leave a comment.
Thank you.

ICHR: Algorithmic Accumulation - $25 Liquidity as DestinyThe recent, violent sell-off in ICHR, while seemingly aligned with broader market weakness, presents the classic signature of a sophisticated, high-timeframe liquidity purge. From an Interbank Price Delivery Algorithm (IPDA) perspective, this is not a fundamental breakdown but rather a calculated maneuver to engineer liquidity for a substantial repricing event to the upside.
The Grand Narrative:
The algorithm's primary directive is to seek and neutralize liquidity. On this weekly chart, the most obvious and compelling target is the pool of buy-side liquidity resting above the "Equal Highs" at approximately $25.50. These levels act as a powerful magnet for price, representing a concentration of buy-stops from breakout traders and short-sellers' stop-losses. The entire price narrative developing over the past year can be understood as a campaign to eventually raid this objective.
The Manipulation: Engineering the Fuel
To facilitate a powerful move towards the $25.50 target, the algorithm requires fuel. This fuel is the sell-side liquidity resting below the established consolidation range lows (around $16.00). The recent sharp decline was the engineered event to raid this liquidity. By driving price down aggressively, the algorithm achieves two critical objectives:
It triggers the stop-losses of existing long positions, creating a cascade of sell orders.
It induces a fresh wave of bearish sentiment, encouraging new short positions.
Large institutions can then absorb this wave of selling, accumulating their long positions at a deep discount in anticipation of the true expansionary move.
The Final Purge: One More Sweep?
It is crucial to acknowledge that the algorithm may not be finished with its accumulation. Before the true rally begins, there is a significant probability of one final, sharp sweep below the recent low near $14.50. This would be the ultimate "spring" event—a move designed to create maximum fear, cleanse any remaining weak-handed longs, and trap the last of the sellers before a violent and sustained reversal. A swift rejection from below this level would be the highest form of confirmation for the bullish thesis.
The Thesis
The current price action is interpreted as the final stage of a long-term accumulation model. The invalidation of this idea would be a sustained acceptance and weekly close below the critical lows without any sign of a powerful reclaim. The logical target, based on the algorithm's unyielding need to balance the books, remains the equal highs at $25.

GBPUSD Institutional Levels: Sell 1.3490 → Buy 1.3360🔱 GBPUSD WEEKLY SNAPSHOT — EXECUTIVE SUMMARY
✨ GBPUSD trading inside a liquidity-driven range with expansion risk
🔄 Current environment: balanced → reactive, awaiting liquidity taps
🧱 Fresh sell-side liquidity / sell zones (premium):
• 1.3460
• 1.3490 upper premium / stop-rich zone
🟢 Fresh buy-side liquidity / buy zones (discount):
• 1.3390
• 1.3360 deeper draw / max pain zone
📉 Price currently oscillating between fresh liquidity pools, not trending
🧠 Both sides are unmitigated → clean reactions likely on first touch
⚖️ Market favors mean-reversion trades until a liquidity sweep occurs
🎯 Expect sharp reactions, not chop, at marked levels
⚠️ Bias is conditional, not directional:
• Above mid-range → sellers gain control
• Below mid-range → buyers gain control
🎯 Recommended strategy:
👉 Buy from fresh buy-side liquidity
👉 Sell from fresh sell-side liquidity
🗳️ GBPUSD WEEKLY SCENARIOS — WHAT’S YOUR PLAY?
Which path do you expect for GBPUSD this week?
🅰️ Tap 1.3460–1.3490 → sharp rejection → move back into range
🅱️ Sweep 1.3360 → strong bounce → rotation higher
🅲 Full range sweep (both sides) → expansion next
🅳 Your level: drop ONE price you’re watching most 👇
________________________________________
🧠 GBPUSD MARKET LOGIC — Institutional Read
• Liquidity is stacked symmetrically above and below current price
• No strong acceptance yet → algos farming both sides
• First touch of fresh liquidity = highest R:R
• Repeated taps weaken the zone → wait for displacement
• Expansion likely after one side is fully swept
________________________________________
⏳ EXPECTATIONS GOING INTO THE WEEK
⬆️ Rallies into 1.3460–1.3490
→ Watch for rejection, displacement, or failure to accept
→ Favor sell-side reactions
⬇️ Drops into 1.3390–1.3360
→ Watch for absorption, divergence, or strong wicks
→ Favor buy-side reactions
🧨 A clean sweep + acceptance beyond either extreme
→ Signals range resolution & new directional leg

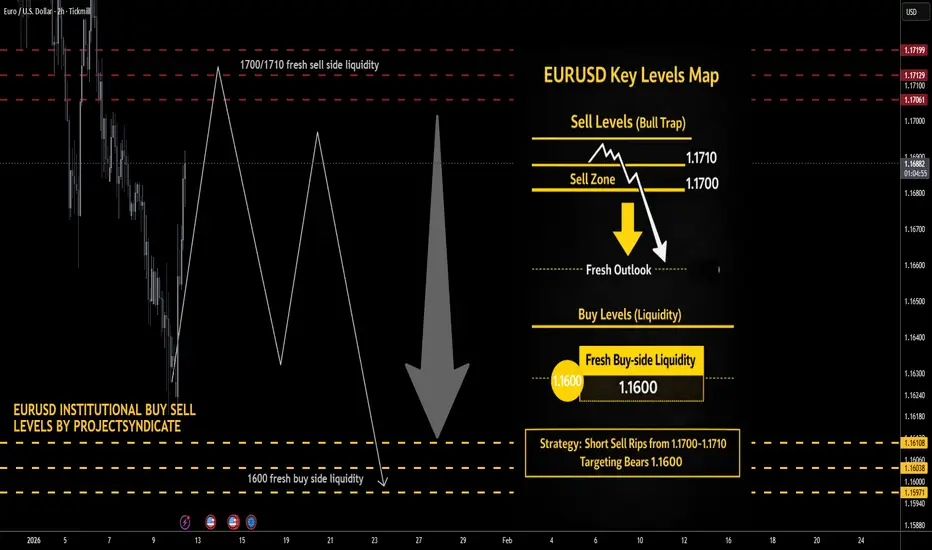
EURUSD Liquidity Trap Short: Sweep 1.1700–1.1710 → Sell the Rip🔱 EURUSD WEEKLY SNAPSHOT — EXECUTIVE SUMMARY
✨ EURUSD positioned in a sell-the-rip environment
📍 Current context: price is below your premium sell liquidity pocket, favoring corrective rallies into resistance
🧱 Fresh sell-side liquidity: 1.1700 – 1.1710
💧 Fresh buy-side liquidity: 1.1600
📉 Bias: bearish while price fails to accept above 1.1710
⏳ Expectation: rallies get capped into 1.1700–1.1710 then delivery toward 1.1600
⚠️ Invalidation: sustained acceptance above 1.1710
🎯 Downside liquidity target this week
• Primary TP and full exit: 1.1600
🎯 Strategy: short sell rips into overhead resistance
🏦 Larger accumulation is more likely only after liquidity is swept near or below 1.1600
________________________________________
🧠 EURUSD MARKET LOGIC — Institutional Read
• Sellers defend premium zones, buyers are reactive
• Upside without acceptance is distribution
• The clean narrative is premium liquidity tap then bearish shift then delivery to 1.1600
• Expect volatility spikes around scheduled macro events this week, plan entries with confirmation
________________________________________
🎯 EXECUTION PLAN — SHORT FROM OVERHEAD RESISTANCE
✅ Entry zone: 1.1700 – 1.1710
Trigger options, pick one
1. Sweep above 1.1700–1.1710 then sharp rejection and close back below 1.1700
2. Lower timeframe market structure shift bearish after tapping the zone, then sell the retest
3. Tap zone then strong bearish displacement candle, enter on pullback into that move
🛑 Risk control
• Hard invalidation: sustained acceptance above 1.1710
• Practical stop placement: above 1.1720–1.1730 to allow for stop hunts
🎯 Take profit
• Full exit: 1.1600
Optional management
• Partial de-risk at intermediate supports on the way down, then trail toward 1.1600
________________________________________
🗳️ EURUSD WEEKLY SCENARIOS — WHAT’S YOUR PLAY
Which path do you expect for EURUSD this week?
🅰️ Tags 1.1700–1.1710 then rejects cleanly then sells off to 1.1600
🅱️ Range grind below 1.1700 then liquidity builds then breakdown to 1.1600
🅲 Wick above 1.1710 bull trap then sharp rejection then impulsive drop to 1.1600
🅳 Your level: drop ONE price you’re watching most this week
________________________________________
🧩 LEVELS QUIZ — EURUSD TRADERS
1. If you’re bearish and want to short from premium, which zone is the best sell idea this week
A 1.1600
B 1.1700–1.1710
C 1.1500
2. What level is the planned full exit and liquidity draw
A 1.1710
B 1.1660
C 1.1600
3. What behavior most strongly invalidates the short idea
A Quick wick above 1.1710 then back below
B Sustained acceptance above 1.1710
C Slow drift down from 1.1680
4. True or False
A sweep into 1.1710 followed by a bearish close back under 1.1700 is a high-quality short trigger
Reply with your answers like this 1B 2C 3B 4True
ALGO/USDT - Price at Major Demand Zone, Reversal or Breakdown?On the weekly timeframe, ALGO/USDT continues to trade within a long-term bearish market structure, defined by a sequence of lower highs and lower lows. Price is currently declining toward a key historical demand zone, highlighted by the yellow box between 0.1075 and 0.0850.
This area has historically served as a strong accumulation zone, where selling pressure was absorbed and followed by notable price reversals.
---
Pattern & Market Structure
From a technical perspective, ALGO shows:
A well-defined descending trend structure
Multiple failed attempts to reclaim major resistance levels:
0.50
0.285
0.235
0.160
Recent price action indicates bearish momentum is slowing as price compresses into a high-probability demand area
This setup often reflects a late-stage downtrend, where accumulation may begin.
---
Key Levels
Major Support (Demand Zone):
0.1075 – 0.0850 → Weekly demand & accumulation zone
Resistance Levels:
0.1600 → First key resistance
0.2350 → Structural resistance
0.2850 → Mid-range resistance
0.4000 – 0.5000 → Major resistance and trend reversal confirmation zone
---
Bullish Scenario
The bullish case remains valid if price respects and holds the demand zone:
1. Strong weekly rejection candles or long lower wicks from the zone
2. Formation of higher lows on lower timeframes
3. A confirmed weekly close above 0.1600
If confirmed, upside potential includes:
0.235 as the first target
0.285 as the second target
0.40 – 0.50 as an extended bullish target
This would signal the early phase of accumulation and a potential trend reversal.
---
Bearish Scenario
The bearish continuation scenario becomes dominant if:
1. Price breaks and closes below 0.0850 on a weekly basis
2. The demand zone fails to absorb selling pressure
3. No meaningful bullish reaction occurs
In this case:
The long-term downtrend remains intact
Price may seek lower liquidity zones around 0.070 – 0.060
The historical accumulation zone becomes invalidated
---
Conclusion
ALGO is currently trading at a critical long-term decision level.
The 0.1075 – 0.0850 zone represents a major inflection point:
Holding above it → accumulation and reversal potential
Breaking below it → continuation of the macro bearish trend
Patience and confirmation are essential at this stage.
---
#ALGOUSDT #Algorand #CryptoAnalysis #WeeklyChart
#DemandZone #AccumulationZone #PriceAction
#MarketStructure #AltcoinAnalysis

#ALGO/USDT - this will go up#ALGO
The price is moving in a descending channel on the 1-hour timeframe. It has reached the lower boundary and is heading towards breaking above it, with a retest of the upper boundary expected.
We have a downtrend on the RSI indicator, which has reached near the lower boundary, and an upward rebound is expected.
There is a key support zone in green at 0.1125. The price has bounced from this zone multiple times and is expected to bounce again.
We have a trend towards consolidation above the 100-period moving average, as we are moving close to it, which supports the upward movement.
Entry price: 0.1137
First target: 0.1150
Second target: 0.1172
Third target: 0.1197
Stop loss: Below the support zone in green.
Don't forget a simple thing: capital management.
For inquiries, please leave a comment.
Thank you.

ALGORAND - Falling Wedge Large falling wedge in current formation on this daily timeframe
I expect the pattern to break with a large breakout to the upside
The falling wedge isn't very slanted but I would still call it a falling wedge
Very long term chart pattern

Silver Market Once in a Lifetime Breakout: 120/140 USD PT📌 Base case unchanged: I’m still targeting $125–$150 within 12–24 months. The next leg of the bull run should accelerate after the all-time-high (~$49–$50) breaks and sticks. Spot is circling the mid-$40s (recent highs ~$46–$47), so the setup is in place. 💎✨
🎯 Bottom line
Silver’s structural deficit + gold leadership + policy-driven cost inflation meet a fresh technical regime. The ATH break is the ignition; $65–$75 is the first destination, and the $125–$150 12–24M target stays live if real yields drift down and PV/electronics demand stays elevated despite thrifting. Manage the whipsaws; respect $38 as the cycle guardrail. BUY/HOLD bias remains warranted. 🚀💎🔥
________________________________________
📊 Technical Outlook (2-week candles)
• Structure: Multi-year Cup & Handle from 2011 → 2020 base → 2024/25 handle. The $40 neckline break is done; a weekly/monthly close > $49.50 flips the market into price discovery.
• Levels that matter:
— Resistance: $49–$50 (ATH), then $65–$75 (measured move / vacuum), interim supply near $57–$60.
— Support: $44.5–$45 (breakout retest), $41–$42 (former cap), deeper $38 and $34 (trend break if lost).
• Momentum breadth: Higher highs on price with constructive consolidation while gold prints records → classic GSR mean-reversion tailwind. 📈⚡
________________________________________
🧭 12–24 Month Path Outlook
Base (55%) – Break & run: Close above $50 triggers trend systems and discretionary chase → extension to $65–$75 by mid-’26, stair-step into $100–$125 by late ’26/early ’27; overshoot to $150 on macro squeeze. 🚀
Alt up (15%) – Blow-off: Parabolic sprint to $85–$100 immediately post-break, sharp retrace to high-$60s, then grind to $125–$150.
Pullback (25%) – Fakeout & reload: Failure at $49–$50, mean reversion to $41–$42 or even $38, rebuild positioning; timeline slips ~1–2 quarters.
Bear tail (5%) – Macro shock: USD spike + real-yield jump + PV air-pocket; lose $34 → cycle delay (target deferred, not canceled). ⚠️
________________________________________
🚦 Catalyst Scorecard — Visible & Hidden Drivers (0–10)
1. Fed path & real yields — 9.0/10 (Bullish)
The Fed cut 25 bps on Sept 17 (now 4.00–4.25%) and signaled scope for more easing this year; several officials reinforced that bias. Lower real yields are the single strongest tailwind for non-yielding metals. 🏦
2. U.S. Dollar trend — 6.0/10 (Net-Bullish for silver)
DXY has been firm the last two weeks, a minor headwind; but with the Fed easing bias, dollar upswings look tactical, not structural. Any USD rollover clears the runway. 💵
3. Gold leadership & GSR mean-reversion — 8.5/10 (Bullish)
Gold at/near record highs ~$3.75–$3.80k keeps silver in tow. GSR ~80–84 is elevated vs. bull-market medians → skew favors silver outperformance on a gold grind. 🪙⚖️
4. Structural deficit — 8.5/10 (Bullish)
Fourth straight sizable deficit; ~678 Moz cumulative drawdown since 2021. 2025 still projected to run a ~115–120 Moz deficit despite softer bar/coin demand. 📉📦
5. Industrial demand (PV/Electronics) — 7.5/10 (Bullish with nuance)
PV/electrical demand at record highs; PV up again in 2024 (+3% y/y) and installations broadened across 38 “>1GW” countries. Offsetting force: silver thrifting (0BB, copper plating) → another 10–12% loading cut likely in 2025. Net: total ounces still robust as capacity growth outpaces thrifting… for now. ☀️🔋
6. ETP/ETF flows — 7.5/10 (Bullish)
Global silver ETPs flipped to net inflows in 2024 (+62 Moz) and kept adding into 2025. SLV shows ~15,362 tonnes in trust as of Sept 26—a sizable base of “sticky” investment metal. 📊📈
7. LBMA & COMEX stocks / liquidity premia — 7.0/10 (Bullish)
LBMA silver in London: 24,646 t (Aug) — up m/m but well below pre-2020 peaks; COMEX registered ~196 Moz. Tight-ish float + delivery frictions can widen location premia during spikes. 🏭📦
8. Tariff & logistics regime — 7.0/10 (Bullish via inflation/frictions)
U.S. 50% copper tariff (Aug 1) lifts domestic copper premia and can indirectly affect by-product silver flows and refining economics. Recent gold bar tariff confusion also showed how policy can snarl bullion logistics; LBMA welcomed clarifications, and noted silver discussions continue—headline risk persists. 🚢⚙️
9. Base-metal supply shocks (by-product linkage) — 6.5/10 (Bullish)
Grasberg disruptions and Peru protest-related shutdowns point to emerging fragility in copper output; since much silver comes as a by-product, copper hiccups can tighten silver supply at the margin. ⛏️🌍
10. Mexico policy/permitting — 6.0/10 (Bullish later, volatile now)
World’s top silver producer remains mired in regulatory overhang; exploration still depressed post-2023 reforms. Any genuine permitting thaw would be years from ounces—near-term effect is restraint. 🇲🇽📜
11. India retail/investment demand — 6.5/10 (Bullish)
Silver hitting record rupee highs; local ETFs up ~50%+ YTD; retail investment +7% y/y in H1’25. Seasonal tailwinds into festivals. 🎉🇮🇳
12. China macro & manufacturing — 5.5/10 (Mixed)
Electronics appetite is steady, PV leadership intact; property stress caps jewelry, but investment demand remains opportunistic. Net: supportive on dips, headline-sensitive. 🏗️🇨🇳
13. Systematic/CTA & options positioning — 6.0/10 (Volatility amplifier)
Trend models chased the $40 break; dealer gamma turns negative above $45–$47 at times, inviting intraday whipsaws. 🎯📉📈
14. Geopolitics (Ukraine/Mideast/Taiwan) — 5.5/10 (Event-Bullish)
Safe-haven jolts remain episodic; they matter more after the ATH triggers chase behavior. 🌍🔥
________________________________________
🧨 Hidden (under-traded) catalysts
• GSR compression trade: Once $50 breaks, programmatic rebalancing from gold to silver can accelerate relative gains. (GSR in the 60s pulls silver deeper into triple digits fast.) ⚖️💥
• By-product elasticity: Copper policy & outages (tariffs, mine incidents) can reduce silver by-product feed even as PV demand hums—this is not fully priced. 🔧⛏️
• Vault/warehouse microstructure: LBMA/COMEX stock changes vs. delivery notices can suddenly widen time/location spreads → sparks short-term basis fireworks that lift spot. 📦⏳
________________________________________
🛠️ Positioning & Execution
• Core: BUY/HOLD core metal exposure; add on $44–$45 retests; reload heavier on $41–$42.
• Breakout tactics: On a weekly close > $50, ride call spreads (e.g., $60/$90 9–15M out on SI or SLV) or risk-reversals (sell $35 puts to fund $80–$100 calls).
• Risk controls: Invalidate momentum if weekly close < $38; cut leverage.
________________________________________
🧩 Fundamental NOTES
• Spot context: XAG/USD ~$46, 52-week range ~$28–$46.7. ATH ~$49–$50 (1980/2011).
• Deficit math: Metals Focus/Silver Institute show fourth straight deficit; 2025 deficit ~117 Moz amid record industrial demand and only modest supply growth.
• Supply: 2024 mined = 819.7 Moz; 2025e ≈ 835.0 Moz (+1.9% y/y). Primary mine share keeps slipping; AISC fell in 2024 (by-product credits).
• PV nuance: Silver loadings ↓ ~10–12% in 2025e, but global PV installations broadened; total silver ounces into PV remain lofty even as intensity falls.
• Vaults/ETFs: LBMA London holdings 24,646 t (Aug). SLV metal in trust 15,361.84 t (Sep 26). COMEX registered ~196 Moz.
• Macro winds: Fed cut and may cut more in 2025 → lower real yields + easier USD path.
• Policy kicker: U.S. copper tariffs live; gold bar tariffs clarified after August confusion; silver remains under policy watch—any mis-classification can jolt premia.
________________________________________

Gold Bull Market Update and Outlook Q4 2025 / Q1 2026📌 Executive Summary
• Base case (60%): The current pullback is a normal retracement within the primary bull trend. We expect consolidation through late Q4-2025 and potentially into January 2026, followed by a resumption of the uptrend in Q1/Q2-2026.
• Drivers remain intact: Persistent central-bank accumulation, reserve-diversification dynamics, and episodic macro/geopolitical risk keep the structural bid under gold.
• Positioning stance: Maintain core long exposure, add tactically on weakness into the $3.8k–$4.0k zone spot equivalent with tight risk controls, and ladder call spreads into Q2-2026.
• Risk skew: Near-term pullback risk persists position shakeouts, macro data surprises. Structural bearish risks are low unless central-bank demand materially softens.
________________________________________
🧭 Market Context & Recent Price Action
• Gold printed successive record highs into mid-October; front-month futures traded above $4,170/oz before easing. Headlines framed the rally as policy and safe-haven led, with year-to-date gains exceptionally strong.
• Central-bank demand continues to underpin the move: WGC and sell-side coverage highlight accelerating official-sector buying and diversification away from FX reserves; banks forecast higher prices into 2026.
• The current setback aligns with prior bull-market pauses (e.g., Apr–Jul 2025 and Sep 2024–Dec 2024 pullbacks), consistent with the user-stated pattern of multi-month consolidations before trend resumption.
What’s new in headlines late Oct–Nov 2025:
• Pullback is “technical and temporary,” with buy-the-dip framing from UBS; next tactical target cited around $4,200.
• Official-sector flows: Korea & Madagascar exploring reserve increases; PBoC extended buying streak into September.
• WSJ coverage stresses gold’s role in erosion of trust in fiat/central banks and the reserve-diversification theme.
________________________________________
🔑 Structural Bull Case 2025-2026
1. Official-Sector Accumulation:
o Multi-year build in central-bank gold holdings (EM-led) as a sanctions-resilient reserve asset; this remains the single most important marginal buyer narrative.
2. Reserve Diversification & Financial Geopolitics:
o Evidence that gold’s share of global reserves has risen while some institutions reassess currency composition.
3. Macro Volatility & Policy Trajectory:
o Periodic growth scares, policy pivots, and real-rate uncertainty sustain hedging demand. Street targets for late-2026 (e.g., ~$4,900 GS) anchor upside convexity.
4. Market Microstructure:
o Thin above prior highs and crowded shorts on pullbacks can fuel sharp upside re-accelerations when macro catalysts hit data, geopolitics, policy hints.
________________________________________
📊 Technical Map Top-Down
• Primary trend: Up. The sequence of higher highs/higher lows since 2024 remains intact; current move is a trend-within-trend consolidation.
• Pullback anatomy: Prior bull pauses (Apr–Jul 2025; Sep–Dec 2024) lasted 2–4 months, with troughs forming on volatility compression and momentum washouts—a template for now.
• Key tactical zones spot-equiv.:
o $3,800–$4,000: First reload area prior breakout shelf / 50–61.8% of the last leg.
o $4,200–$4,250: First resistance / re-acceleration trigger retests of breakdown pivots.
o $4,350–$4,400: High congestion; decisive weekly close above here re-opens ATH extension.
________________________________________
🗓️ Scenario Pathing Q4-2025 → Q2-2026
• Base Case 60% — “Consolidate then resume”:
o Sideways-to-lower into late Q4/Jan 2026 as positioning resets; range $3.8k–$4.2k.
o Breakout resumption in Q1/Q2-2026 as macro and official flows re-assert.
• Bullish Extension 25% — “Shallow dip, quick reclaim”:
o Softer real yields / risk flare trigger swift recapture of $4.2k–$4.4k and new highs earlier in Q1-2026.
o Catalysts: heavier central-bank prints, geopolitical shock, or earlier policy-easing rhetoric.
• Bear-Risk 15% — “Deeper flush, trend intact”:
o Hawkish macro surprise or forced deleveraging drives $3.6k–$3.7k probes; structure holds unless official-sector demand meaningfully fades
________________________________________
🧪 What to Watch High-Signal Indicators
• Official-Sector Data: Monthly updates from WGC, IMF COFER clues, and PBoC reserve disclosures. Continuation of EM purchases = green light for the bull.
• Rates & Liquidity: Real-rate direction and dollar liquidity conditions around data and policy communications.
• Microstructure: CFTC positioning inflections, ETF out/in-flows a lagging but useful confirmation when they finally turn.
• Asia Physical/Policy: China/Japan retail and wholesale dynamics; policy/tax headlines can create short-term volatility.
________________________________________
🎯 Strategy & Implementation
1) Core:
• Maintain strategic long allocation consistent with mandate e.g., 3–5% risk budget; avoid pro-cyclical reductions during orderly pullbacks.
2) Tactical Adds
• Scale-in buy program within $3.8k–$4.0k
• Optionality: Buy Q2-2026 call spreads (e.g., 4.2/4.8) on dips; fund via selling Q1-2026 downside put spreads around $3.6k–$3.7k where comfortable with assignment.
3) Risk Controls 🛡️:
• Hard-stop any tactical adds on weekly close < ~$3.6k or if credible evidence emerges of official-sector demand reversal.

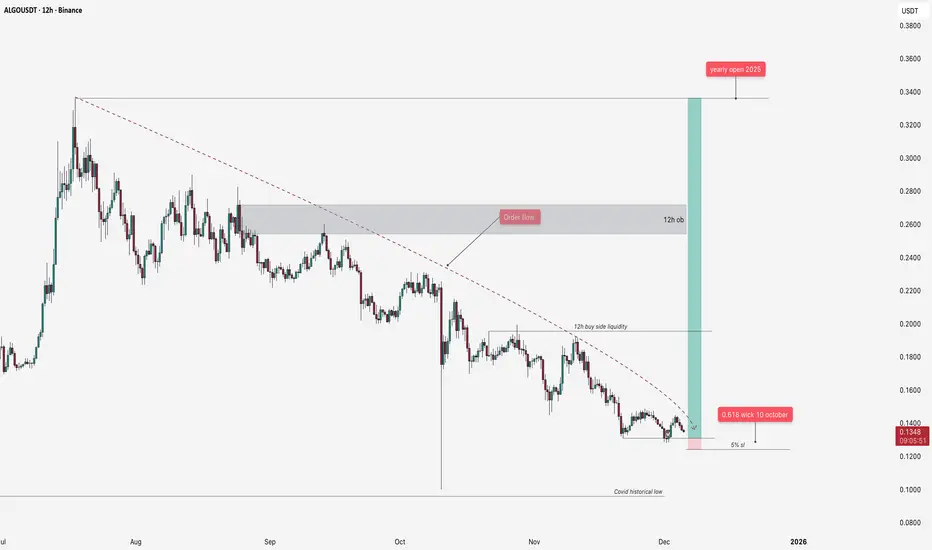
Algo trade idea for DecemberMain local trade idea for BINANCE:ALGOUSDT
Downtrend since July 2025 with sellers order flow - will be like a targets for hunt liquidity
After 10 October we formed correction 0.618 of wick D tf
Sl my personal is around 5% with 2x lev
Target Yearly open 2025
Also targets for step by step fixation Buy side liquidity (after this level sl to be)
12h order block and yearly open
#ALGO/USDT - this will go up
#ALGO
The price is moving in a descending channel on the 1-hour timeframe. It has reached the lower boundary and is heading towards breaking above it, with a retest of the upper boundary expected.
We have a downtrend on the RSI indicator, which has reached near the lower boundary, and an upward rebound is expected.
There is a key support zone in green at 0.1340. The price has bounced from this zone multiple times and is expected to bounce again.
We have a trend towards consolidation above the 100-period moving average, as we are moving close to it, which supports the upward movement.
Entry price: 0.1360
First target: 0.1374
Second target: 0.1394
Third target: 0.1417
Don't forget a simple principle: money management.
Place your stop-loss order below the support zone in green.
For any questions, please leave a comment.
Thank you.

ALGO Consolidation at Key Support | Spot Long SetupOver the last couple of days, Algorand (ALGO) has been consolidating tightly around a key support level between $0.130 and $0.135. This range has historically held well, acting as a strong base for previous upward moves. The sideways price action here suggests accumulation, with buyers stepping in to absorb selling pressure.
🎯 Trade Idea (Spot Long)
Entry Zone: $0.130 – $0.135
Take Profits: $0.145 / $0.175 / $0.225 / $0.26
Stop Loss: $0.125
This setup offers a favorable risk-reward ratio, especially with confirmation of support holding. The multi-tiered TP approach allows for scaling out profitably.
Always watch for volume confirmation and market sentiment shifts. A breakdown below $0.125 would invalidate the idea. This setup is meant for educational purposes only.
