Key stats
About VanEck Gold Miners ETF
Expense ratio
0.51%
Home page
Inception date
May 16, 2006
GDX is one of the most popular funds in the global gold-mining segment, a trading powerhouse with deep primary, secondary and derivatives markets. Following a 2013 overhaul of the fund`s index, GDX is no longer limited to US-listed firms, nor does it filter out firms that have hedged their gold exposure with derivatives. In addition, it includes firms mining other precious metals in addition to gold, so it`s not entirely pure-play gold miners. GDX includes all the major names, but the fund`s broader take on the gold-mining space means that the big firms get less weight than in our neutral benchmark. As an industry benchmark, GDX falls a bit short, but it's still hugely popular.
Classification
What's in the fund
Exposure type
Non-Energy Minerals
Stock breakdown by region

Elliott Wave Expects Gold Miners ETF (GDX) to Continue RallyShort Term Elliott Wave View in Gold Miners Junior (GDX) shows that cycle from 10.4.2023 low is in progress as a 5 waves impulse Elliott Wave structure. Up from 10.4.2023 low, wave 1 ended at 32.35 and pullback in wave 2 ended at 25.67. Wave 3 higher ended at 37.47 and dips in wave 4 ended at 32.83

Miners need more consolidation before taking off from wedgeI don't think it's quite their time yet, I see a fall, a month of meandering, before launching and hitting my green target.

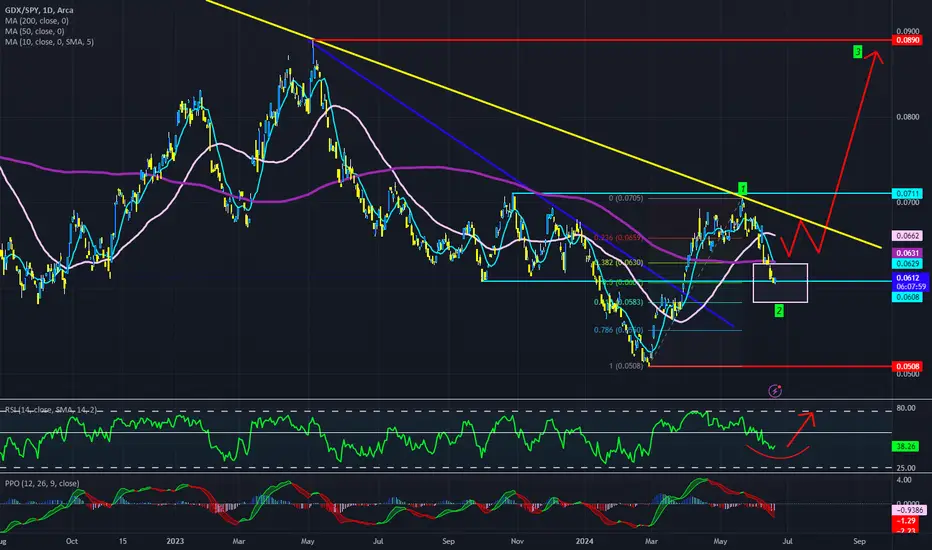
GDX (GoldMiners) vs SPX looks set to RIP higher in coming monthsChart of GDX (precious metals miners) vs SPY (SP500).
Looks to me like we are prepping to RIP higher in coming months.
Be ready.

Stay long GDX gold minersSimilar to the patterns playing out elsewhere, the "inflation trade" is still supportive of hard assets (and miners). GDX has had a nice pullback into 38% and move ave support. I've been long for quite a long time but those looking to get some exposure can use this as an opportunity.
Long 34, Stop 3

GDX break out Have been tracking Gold and the Gold miners ETF GDX... It has been a while and it appears that Gold and GDX are at least in sync again.
GDX appears to have closed the week above the long term range and just broke out, if not about to...
MACD and VolDiv have not yet crossed over but indications show

Where the market maybe going and my positions Looks to me the market is stalling up here. Vol not good and with high rates bad for tech
staying short TNA Long SQQQ Long GDX

GOLD MINERS GDX - 4 Years of pain?A inverse #HVF appears to be in progress on the #GDX
@TheCryptoSniper
Coincides with a probability that gold has put in a major secular top being pushed down by positive real rate environment.

Elliott Wave Intraday Analysis on GDX: Further Rally ExpectedShort Term Elliott Wave View on GDX suggests that rally to 35.74 ended wave 3 on April 12, 2024. From there, the ETF pullback as a double three Elliott Wave structure. Down from wave 3, wave (a) ended at 33.44 and wave (b) ended at 34.35. Wave (c) lower ended at 32.43 which completed wave ((w)). The

See all ideas