Gold next week: Key S/R Levels and Outlook for Traders🏆 Friday’s Close & Recent ATH:
Gold XAUUSD closed Friday around ~$3,990–$4,020/oz depending on venue most consolidated feeds show prints near $3.99–$4.02k at Friday close. The nearest recent intraday highs printed in the $4,030–$4,060 area across data providers this week, putting $4,000 as the immediate psychological battleground and $4,050–$4,060 as the latest short-term ATH band. YTD performance remains extraordinary 2025 YTD still showing a very large gain.
📈 Trend Structure:
Price continues to track a well-defined ascending channel on 1H/4H with clear impulsive legs out of recent consolidations. Market character = higher highs / higher lows, persistent dip-buying, and strong trend adherence into quarter-turn 25/50 handles near round thousands. Momentum has been resilient into week-end despite tariff headlines, suggesting structural demand and participation from official buyers.
🔑 Key Resistance Levels:
The most critical resistances to watch updated from Friday close ≈ $4,000:
• 4000 — immediate psychological round-number battleground.
• 4,030–4,060 — recent intraday ATH band / short-term supply recent highs printed here across venues.
• 4,075 → 4,100 — measured move / extension band if acceptance above the ATH zone occurs.
• 4,150–4,200 — stretch momentum targets on sustained risk-off and break/acceptance above 4,100 structural extension.
Quick note: different data vendors quote small differences in ticks — I used consolidated high prints to identify the ATH band.
🛡️ Support Zones:
Immediate supports step down as follows
• 3,980–3,960 intraday pivot just under Friday close.
• 3,950–3,930 multi-day base / near-week lows.
• 3,900–3,888 round-number shelf and the prior week’s consolidation band.
• Deeper structural shelves: 3,860–3,840, 3,825, 3,800 → 3,775.
A sustained break below ~3,900–3,888 would signal increasing corrective risk; daily close under ~3,825 would more clearly shift the regime.
⚖️ Likely Scenarios:
• Scenario 1 Base Case – Controlled dip toward 3,950–3,930 or the 3,900 area to reload bids, then rotation higher toward 4,030–4,060 as buyers re-engage.
• Scenario 2 Momentum Break – Quick clearance of the 4,030–4,060 ATH band → sustained acceptance above 4,075–4,100, unleashing momentum into 4,150–4,200. Overbought readings exist intraday, but structural demand has kept pullbacks shallow.
📊 Short-Term Targets:
On continuation: 4,020 → 4,030–4,060 → 4,075 → 4,100, with 4,150–4,200 as higher extensions if acceptance holds.
On retrace: 3,980 → 3,950 → 3,930 → 3,900 as the key retrace ladder.
💡 Market Sentiment Drivers updated:
• Tariff shock / geopolitical risk: President Trump announced proposals for large new tariffs reports of a 100% tariff threat and expanded export controls on Chinese imports this week, escalating trade-war risk and knocking risk sentiment — that increases safe-haven demand for gold. News outlets Reuters, AP, WaPo and market reactions were visible Friday.
• Rate & policy expectations: Markets continue to price material odds of rate easing/softer Fed path relative to earlier in the year; that reduces real yields and supports gold. Feeds and FedWatch implied pricing show elevated cut odds that underpin lower opportunity cost for gold.
• Official demand: Central bank buying has remained constructive — WGC/official stats show continued net purchases in recent months monthly buying rebounded in August. This adds structural support to dips.
• Macro/flow: Risk-off from tariff headlines, rare-earth export controls, and supply-chain concerns are the immediate drivers that could catalyze pushes toward the ATH band.
🔄 Retracement Outlook:
A tag of 3,950–3,930 or a short stop-run into 3,900–3,888 would be a typical healthy pullback inside the trend. Fast reclaim of the first support band after a liquidity flush often precedes fresh ATH tests. Breaks under 3,900 that fail to reclaim quickly increase the probability of a deeper slide into the 3,860–3,825 shelf.
🧭 Risk Levels to Watch:
• Bullish structure intact: holding above ~3,950–3,930 or more conservatively, above 3,900 keeps the bull case intact.
• Bearish line-in-sand: daily close < 3,825 weakens trend; daily close < 3,775–3,750 signals a bigger corrective phase and opens lower targets.
🚀 Overall Weekly Outlook:
Gold remains in a strong uptrend with $4,020–$4,030/ATH band $4,030–$4,060 → $4,000 as the immediate battleground after Friday’s close. Expect buyable dips while supports hold; the topside roadmap favors 4,075–4,100 and 4,150–4,200 as measured extensions if the market digests tariff news into a longer-running risk-off regime.
Algo
Gold Bull Markets Long Term Overview and 2025 Market UpdateGold Bull Markets Long Term Overview and 2025 Market Update
________________________________________
• This cycle is different: record central-bank buying + renewed ETF inflows + lower real rates = powerful tailwind.
• Price: Gold notched fresh ATHs this month (up to $3,790.82). 2025 is shaping up as the strongest year since the late 1970s.
• Relative: Gold is crushing equities YTD (≈+40% vs S&P 500 ≈+13% total return).
• Setup: A 13-year “cup-and-handle” breakout in 2024 kick-started the move.
• Outlook: Base case from the Street: $3,700 by end-’25 and ~$4,000 by mid-’26; upside to $4,500 if flows accelerate.
________________________________________
🏆 Historic Gold Bull Markets — Timeline & Stats
1) 1968–1980 “Super Bull”
• Start/End: ~$35 → $850 (Jan 1980)
• Gain: ~2,330%
• Drivers: End of Bretton Woods, oil shocks, double-digit inflation, geopolitical stress.
• Drawdown: ~–45% (1974–1976) before the final blow-off run.
2) 1999–2011/12
• Start/Peak: ~$252 (1999) → ~$1,920 (2011–12)
• Gain: ~650%
• Drivers: Commodities supercycle, EM demand, USD weakness, GFC safe-haven bid.
3) 2016/2018–Present (The “CB-Led” Cycle)
• Start Zone: $1,050–$1,200 → New ATH $3,790 (Sep 2025)
• Gain: ~215–260% (depending on 2016 vs 2018 anchor)
• Drivers: Record central-bank accumulation, sticky inflation/low real rates, geopolitics; 2024 13-yr base breakout.
________________________________________
📊 At-A-Glance Comparison (Updated 2025)
Metric 1968–80 Super Bull 1999–2012 2016/18–2025 Current
🚀 Total Gain ~2,330% ~650% ~215–260% (so far)
⏲️ Duration 12 yrs 13 yrs 7–9 yrs (ongoing)
💔 Max Drawdown ~–45% (’74–’76) ~–30% (’08) ~–20% (2022)
🏦 Main Buyer Retail/Europe Funds/EM Central Banks (dominant)
🏛️ Pattern Secular parabolic Cyclical ramps 13-yr base → breakout (’24)
Notes: current cycle characteristics validated by WGC demand trends & technical breakout in Mar 2024.
________________________________________
📈 Top 10 Stats of the Current Bull (2025)
1. Price & ATHs: Spot $3,75–$3,79k; fresh ATH $3,790.82 on Sep 23, 2025.
2. 2025 YTD: Roughly +40–43% YTD (best since the late ’70s).
3. Central Banks: 1,045 t added in 2024 (3rd straight 1k+ year). H1’25 ≈ 415 t (still elevated).
4. ETF Flows: Strongest half-year inflows since 2020, aiding the surge.
5. Gold vs Equities: Gold ≈+40% vs S&P 500 ≈+13% total return YTD.
6. Jewelry Demand: Price strength is crimping tonnage (2024 down ~11%; Q2’25 –14% y/y), even as value hits records.
7. Gold–Silver Ratio: Now around ~85–88 (silver catching up as it pushes $43–$44).
8. Macro Link: Strong safe-haven bid + rate-cut hopes supporting new highs.
9. Technical: Confirmed cup-and-handle breakout (Mar ’24) underpinning trend.
10. Street Forecasts: DB lifts 2026 to $4,000; GS baseline $4,000 by mid-’26, upside $4,500 with bigger private-investor rotation.
________________________________________
🔄 What Makes This Bull Different (2025 Edition)
• 🏦 Central-Bank Dominance — Official sector is the anchor buyer (3rd straight 1k+ tonne year in 2024; 2025 tracking strong despite Q2 deceleration).
• ⚡ Faster Recoveries — Pullbacks have been shallower and shorter vs the 1970s analog.
• 📈 Coexisting With Risk Assets — Rare combo: gold ATHs with equities up YTD suggests a macro hedge bid alongside optimism in select risk assets.
• 📐 Structural Breakout — The 13-year base cleared in 2024 set multi-year targets.
________________________________________
🎯 Strategy Ideas (2025 & Beyond)
Core
• Buy/Hold on Dips: Stagger entries (DCA) into physical (allocated), ETFs (e.g., GLD/IAU), and quality miners/royalties.
• Prefer Physical/Allocated where counterparty risk matters; use ETFs for liquidity.
Satellite/Leverage
• Silver & GSR Mean-Reversion: With the GSR ~85–88, silver historically offers torque in up-legs. Pair with high-quality silver miners.
• Factor Tilt in Miners: Focus on low AISC, strong balance sheets, growing reserves, and jurisdictions with rule-of-law.
Risk-Management
• Define max drawdown tolerance per sleeve; pre-plan trims near parabolic extensions or if macro invalidates (e.g., real-yield spike).
________________________________________
🧪 Reality Check: What Could Invalidate the Bull?
• Real yields + USD rip higher (sustained), dampening non-yielding assets.
• Sharp halt in official-sector buying (e.g., policy shifts).
• Rapid growth re-acceleration reducing safe-haven & rate-cut expectations.
________________________________________
🧭 Quick Reference Tables
🧾 Summary: Historic vs Current
Feature 1968–80 1999–2012 2016/18–2025
Total Gain ~2,330% ~650% ~215–260%
Duration 12 yrs 13 yrs 7–9 yrs (ongoing)
Correction ~–45% ~–30% ~–20% (’22)
Main Buyer Retail/Europe Funds/EM Central Banks
Pattern Parabolic Cyclical Cup & Handle → Secular
🧩 “If-This-Then-That” Playbook
• If real yields fall & CB buying persists → Ride trend / add on consolidations.
• If USD + real yields jump → Trim beta, keep core hedge.
• If GSR stays >80 with silver momentum → Overweight silver sleeve for torque.
________________________________________
🧠 Outside-the-Box Adds
💼 Role in a Portfolio (example frameworks)
• Resilience sleeve (5–10%): Physical + broad ETF.
• Offense sleeve (2–5%): Quality miners/royalties; optional silver tilt.
• Tactical (0–3%): Trend-following overlay (breakouts/consolidations).
🧭 Decision Checkpoints (quarterly)
• Central-bank net purchases (WGC).
• ETF flows (Western markets).
• Real yields (10y TIPS), USD trend, and GSR.
________________________________________
🔚 Key Takeaways (Updated)
• Relentless official-sector demand + technical breakout are the twin pillars of this cycle.
• Macro mix (policy easing expectations, geopolitics, diversification from USD reserves) supports an extended run.
• Base case: Street sees $3.7k by end-’25 and ~$4k by mid-’26, with upside to $4.5k if private capital rotation accelerates. Manage risk; embrace volatility.

Silver Market Once in a Lifetime Breakout: 120/140 USD PT📌 Base case unchanged: I’m still targeting $125–$150 within 12–24 months. The next leg of the bull run should accelerate after the all-time-high (~$49–$50) breaks and sticks. Spot is circling the mid-$40s (recent highs ~$46–$47), so the setup is in place. 💎✨
🎯 Bottom line
Silver’s structural deficit + gold leadership + policy-driven cost inflation meet a fresh technical regime. The ATH break is the ignition; $65–$75 is the first destination, and the $125–$150 12–24M target stays live if real yields drift down and PV/electronics demand stays elevated despite thrifting. Manage the whipsaws; respect $38 as the cycle guardrail. BUY/HOLD bias remains warranted. 🚀💎🔥
________________________________________
📊 Technical Outlook (2-week candles)
• Structure: Multi-year Cup & Handle from 2011 → 2020 base → 2024/25 handle. The $40 neckline break is done; a weekly/monthly close > $49.50 flips the market into price discovery.
• Levels that matter:
— Resistance: $49–$50 (ATH), then $65–$75 (measured move / vacuum), interim supply near $57–$60.
— Support: $44.5–$45 (breakout retest), $41–$42 (former cap), deeper $38 and $34 (trend break if lost).
• Momentum breadth: Higher highs on price with constructive consolidation while gold prints records → classic GSR mean-reversion tailwind. 📈⚡
________________________________________
🧭 12–24 Month Path Outlook
Base (55%) – Break & run: Close above $50 triggers trend systems and discretionary chase → extension to $65–$75 by mid-’26, stair-step into $100–$125 by late ’26/early ’27; overshoot to $150 on macro squeeze. 🚀
Alt up (15%) – Blow-off: Parabolic sprint to $85–$100 immediately post-break, sharp retrace to high-$60s, then grind to $125–$150.
Pullback (25%) – Fakeout & reload: Failure at $49–$50, mean reversion to $41–$42 or even $38, rebuild positioning; timeline slips ~1–2 quarters.
Bear tail (5%) – Macro shock: USD spike + real-yield jump + PV air-pocket; lose $34 → cycle delay (target deferred, not canceled). ⚠️
________________________________________
🚦 Catalyst Scorecard — Visible & Hidden Drivers (0–10)
1. Fed path & real yields — 9.0/10 (Bullish)
The Fed cut 25 bps on Sept 17 (now 4.00–4.25%) and signaled scope for more easing this year; several officials reinforced that bias. Lower real yields are the single strongest tailwind for non-yielding metals. 🏦
2. U.S. Dollar trend — 6.0/10 (Net-Bullish for silver)
DXY has been firm the last two weeks, a minor headwind; but with the Fed easing bias, dollar upswings look tactical, not structural. Any USD rollover clears the runway. 💵
3. Gold leadership & GSR mean-reversion — 8.5/10 (Bullish)
Gold at/near record highs ~$3.75–$3.80k keeps silver in tow. GSR ~80–84 is elevated vs. bull-market medians → skew favors silver outperformance on a gold grind. 🪙⚖️
4. Structural deficit — 8.5/10 (Bullish)
Fourth straight sizable deficit; ~678 Moz cumulative drawdown since 2021. 2025 still projected to run a ~115–120 Moz deficit despite softer bar/coin demand. 📉📦
5. Industrial demand (PV/Electronics) — 7.5/10 (Bullish with nuance)
PV/electrical demand at record highs; PV up again in 2024 (+3% y/y) and installations broadened across 38 “>1GW” countries. Offsetting force: silver thrifting (0BB, copper plating) → another 10–12% loading cut likely in 2025. Net: total ounces still robust as capacity growth outpaces thrifting… for now. ☀️🔋
6. ETP/ETF flows — 7.5/10 (Bullish)
Global silver ETPs flipped to net inflows in 2024 (+62 Moz) and kept adding into 2025. SLV shows ~15,362 tonnes in trust as of Sept 26—a sizable base of “sticky” investment metal. 📊📈
7. LBMA & COMEX stocks / liquidity premia — 7.0/10 (Bullish)
LBMA silver in London: 24,646 t (Aug) — up m/m but well below pre-2020 peaks; COMEX registered ~196 Moz. Tight-ish float + delivery frictions can widen location premia during spikes. 🏭📦
8. Tariff & logistics regime — 7.0/10 (Bullish via inflation/frictions)
U.S. 50% copper tariff (Aug 1) lifts domestic copper premia and can indirectly affect by-product silver flows and refining economics. Recent gold bar tariff confusion also showed how policy can snarl bullion logistics; LBMA welcomed clarifications, and noted silver discussions continue—headline risk persists. 🚢⚙️
9. Base-metal supply shocks (by-product linkage) — 6.5/10 (Bullish)
Grasberg disruptions and Peru protest-related shutdowns point to emerging fragility in copper output; since much silver comes as a by-product, copper hiccups can tighten silver supply at the margin. ⛏️🌍
10. Mexico policy/permitting — 6.0/10 (Bullish later, volatile now)
World’s top silver producer remains mired in regulatory overhang; exploration still depressed post-2023 reforms. Any genuine permitting thaw would be years from ounces—near-term effect is restraint. 🇲🇽📜
11. India retail/investment demand — 6.5/10 (Bullish)
Silver hitting record rupee highs; local ETFs up ~50%+ YTD; retail investment +7% y/y in H1’25. Seasonal tailwinds into festivals. 🎉🇮🇳
12. China macro & manufacturing — 5.5/10 (Mixed)
Electronics appetite is steady, PV leadership intact; property stress caps jewelry, but investment demand remains opportunistic. Net: supportive on dips, headline-sensitive. 🏗️🇨🇳
13. Systematic/CTA & options positioning — 6.0/10 (Volatility amplifier)
Trend models chased the $40 break; dealer gamma turns negative above $45–$47 at times, inviting intraday whipsaws. 🎯📉📈
14. Geopolitics (Ukraine/Mideast/Taiwan) — 5.5/10 (Event-Bullish)
Safe-haven jolts remain episodic; they matter more after the ATH triggers chase behavior. 🌍🔥
________________________________________
🧨 Hidden (under-traded) catalysts
• GSR compression trade: Once $50 breaks, programmatic rebalancing from gold to silver can accelerate relative gains. (GSR in the 60s pulls silver deeper into triple digits fast.) ⚖️💥
• By-product elasticity: Copper policy & outages (tariffs, mine incidents) can reduce silver by-product feed even as PV demand hums—this is not fully priced. 🔧⛏️
• Vault/warehouse microstructure: LBMA/COMEX stock changes vs. delivery notices can suddenly widen time/location spreads → sparks short-term basis fireworks that lift spot. 📦⏳
________________________________________
🛠️ Positioning & Execution
• Core: BUY/HOLD core metal exposure; add on $44–$45 retests; reload heavier on $41–$42.
• Breakout tactics: On a weekly close > $50, ride call spreads (e.g., $60/$90 9–15M out on SI or SLV) or risk-reversals (sell $35 puts to fund $80–$100 calls).
• Risk controls: Invalidate momentum if weekly close < $38; cut leverage.
________________________________________
🧩 Fundamental NOTES
• Spot context: XAG/USD ~$46, 52-week range ~$28–$46.7. ATH ~$49–$50 (1980/2011).
• Deficit math: Metals Focus/Silver Institute show fourth straight deficit; 2025 deficit ~117 Moz amid record industrial demand and only modest supply growth.
• Supply: 2024 mined = 819.7 Moz; 2025e ≈ 835.0 Moz (+1.9% y/y). Primary mine share keeps slipping; AISC fell in 2024 (by-product credits).
• PV nuance: Silver loadings ↓ ~10–12% in 2025e, but global PV installations broadened; total silver ounces into PV remain lofty even as intensity falls.
• Vaults/ETFs: LBMA London holdings 24,646 t (Aug). SLV metal in trust 15,361.84 t (Sep 26). COMEX registered ~196 Moz.
• Macro winds: Fed cut and may cut more in 2025 → lower real yields + easier USD path.
• Policy kicker: U.S. copper tariffs live; gold bar tariffs clarified after August confusion; silver remains under policy watch—any mis-classification can jolt premia.
________________________________________

SELL USDJPYJPY hass been on the heat recently, big spike and gap. However we are seeing a selling opportunity based off our strategy. Sell from current level 152.443 and more entries at 153.078 and stops above 153.886 and targets below the gap 145.81. Use your own risk management and risk what you can afford. Best of luck.

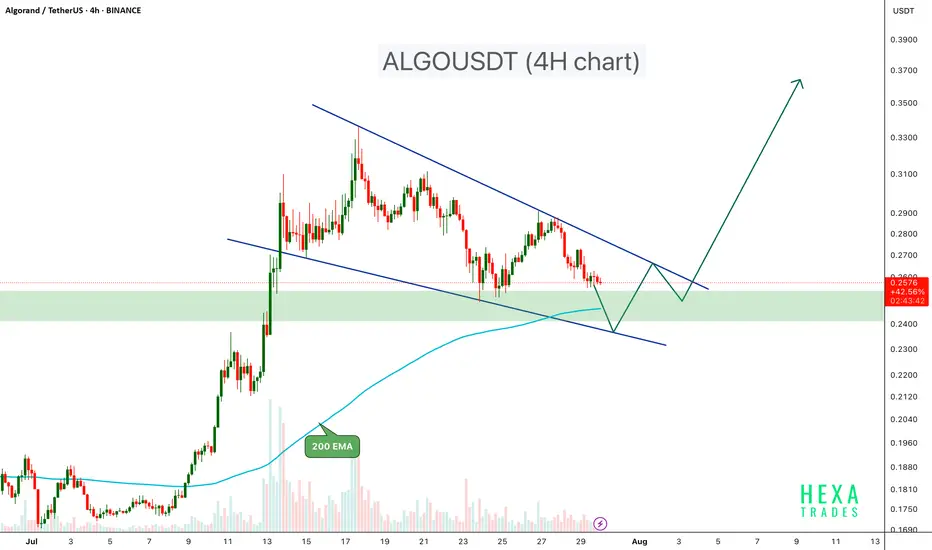
AlgorandAlgo usdt daily analysis
Time frame 4 hours
Risk rewards ratio >2.5 👈
Target = 0.33 $
I entered long position at the end of down trend
LS is so close and tight to decrease of damage

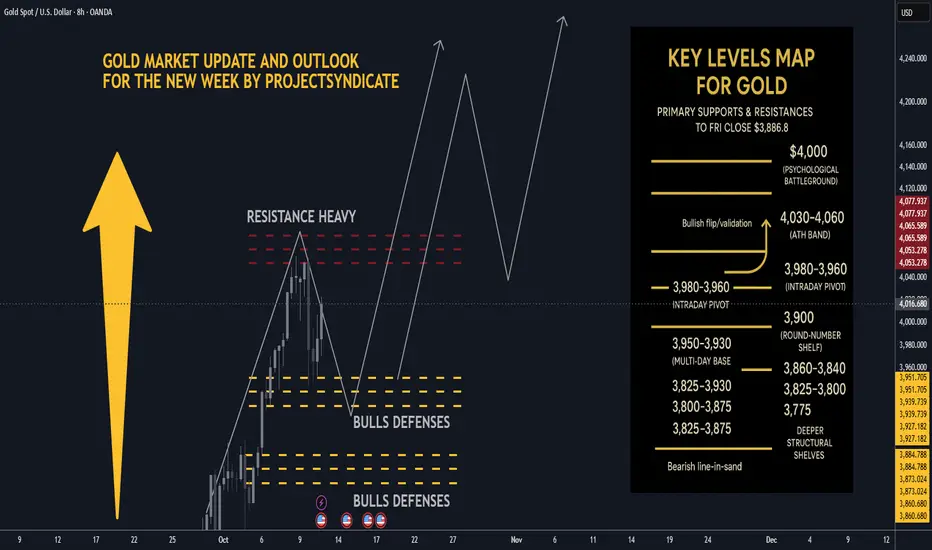
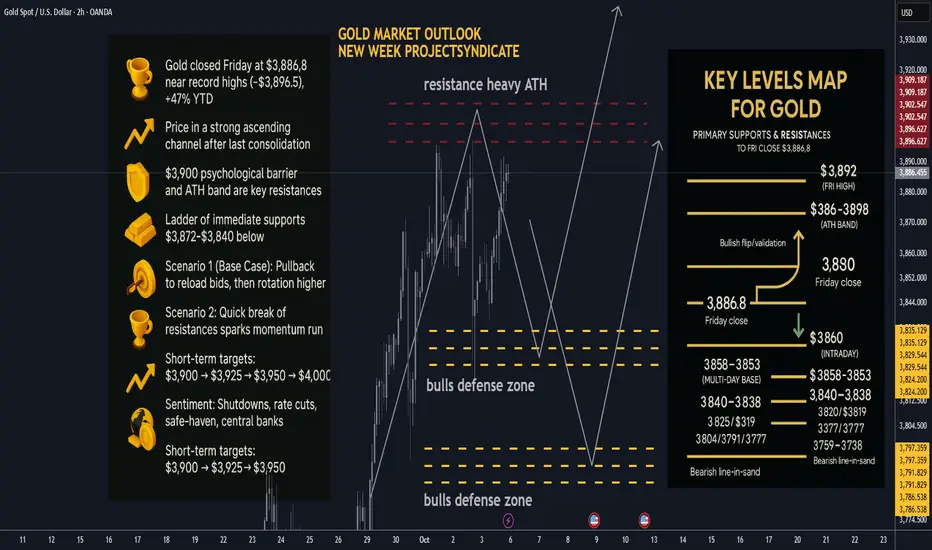
Gold next week: Key S/R Levels and Outlook for Traders🏆 Friday’s Close & Recent ATH:
Gold (XAUUSD) closed Friday at $3,886.8, after printing a session high near $3,891.9. The latest all-time high is ~$3,896.5 (Thu), putting $3,900 squarely in play as the next psychological milestone. YTD performance remains extraordinary (≈+47% in 2025).
📈 Trend Structure:
Price continues to track a well-defined ascending channel on 1H/4H with a clean impulsive leg out of the last consolidation. Market character = higher highs / higher lows, persistent dip-buying, and strong trend adherence into quarter-turn levels (25/50 handles).
🔑 Key Resistance Levels:
The most critical resistance now sits at $3,900 (psychological + round-number supply). Beyond that, watch the ATH band $3,896–$3,898 and Friday’s spike high $3,892. Break/acceptance above opens $3,925–$3,950 as measured-move extensions, with $4,000 as a probable magnet on momentum follow-through.
🛡️ Support Zones:
Immediate supports step down as follows: $3,872–$3,860 (intraday pivot), $3,858–$3,853 (multi-day base), $3,840–$3,838 (Fri low). Deeper structural shelves: $3,825–$3,820, $3,804, $3,791, $3,777. A sustained break below $3,838–$3,825 would signal a more meaningful corrective phase.
⚖️ Likely Scenarios:
• Scenario 1 (Base Case) – Pullback then push: Controlled dip into $3,858–$3,838 to reload bids, then rotation higher toward $3,900+.
• Scenario 2 – Straight break: Quick clearance of $3,892/ATH $3,896–$3,898 → $3,900, unleashing a momentum run into $3,925–$3,950.
(Overbought signals persist, but structural demand keeps dips shallow.)
📊 Short-Term Targets:
On continuation: $3,892 → $3,900 → $3,925 → $3,950, with $4,000 as stretch if acceptance holds above $3,900. On retrace: $3,858 → $3,840 → $3,825.
💡 Market Sentiment Drivers:
• Shutdown-driven data delays & uncertainty are boosting safe-haven bids; Friday’s NFP was delayed, reinforcing cut expectations.
• Rate-cut odds remain elevated into October, keeping the opportunity cost of holding gold low (FedWatch/BofA commentary).
• Official-sector demand stays constructive (central banks resumed net +15t buying in August per WGC), underpinning dips.
• Macro/geopolitical risk + tariff chatter continue to provide a tailwind; 2025’s ~47% surge underscores the regime shift.
🔄 Retracement Outlook:
A tag of $3,858–$3,853 (multi-day pivot) or a stop-run to $3,840–$3,838 is a typical “healthy” pullback zone inside trend. Swift reclaim of $3,858/53 after a liquidity flush often precedes fresh ATHs.
🧭 Risk Levels to Watch:
Holding above $3,858–$3,838 keeps the bullish structure intact. Failure/acceptance below $3,825 shifts risk toward $3,804 → $3,791 → $3,777 and opens the door to $3,759–$3,738.
🚀 Overall Weekly Outlook:
Gold remains in a power-trend with $3,892/ATH $3,896–$3,898 → $3,900 as the immediate battleground. Expect orderly, buyable dips while those supports hold; topside roadmap favors $3,925–$3,950 with $4,000 viable on a decisive breakout/acceptance.
________________________________________
🗺️ Key Gold Levels Map — Primary Supports & Resistances (Updated to Fri Close $3,886.8):
Primary Resistances: 3892 (Fri high) → 3896–3898 (ATH band) → 3900 → 3925 → 3950 → 4000.
Primary Supports: 3872–3860 (intraday) → 3858–3853 (multi-day base) → 3840–3838 (Fri low) → 3825 / 3819 → 3804 / 3791 / 3777 → 3759–3738 (deeper control).
Bullish flip/validation: Sustained acceptance ≥3900 turns dips into buys toward 3925–3950.
Bearish line-in-sand: Daily close <3825 weakens the trend; <3791 confirms a broader corrective swing.
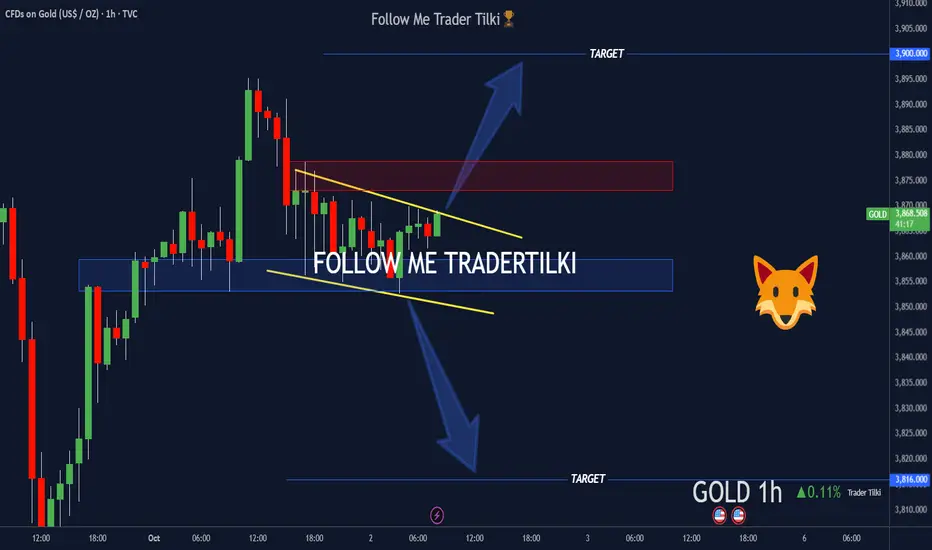
Trader Tilki’s GOLD-XAUUSD Breakdown: Silent Storm Brewing📊 XAUUSD – GOLD Critical Breakout Analysis
Hey Guys,
By popular demand, I’ve prepared the latest breakout analysis for XAUUSD-GOLD. Your support means a lot to me, so I’m sharing this breakdown based on your requests.
🔹 Buy Scenario
If we get a candle close above 3878.0, the first target will be 3900.0.
🔹 Sell Scenario
If price closes below 3850.0, then gold’s target level will be 3816.0.
Every single like is my biggest motivation to keep sharing these analyses.
Thanks to everyone showing support 🙏
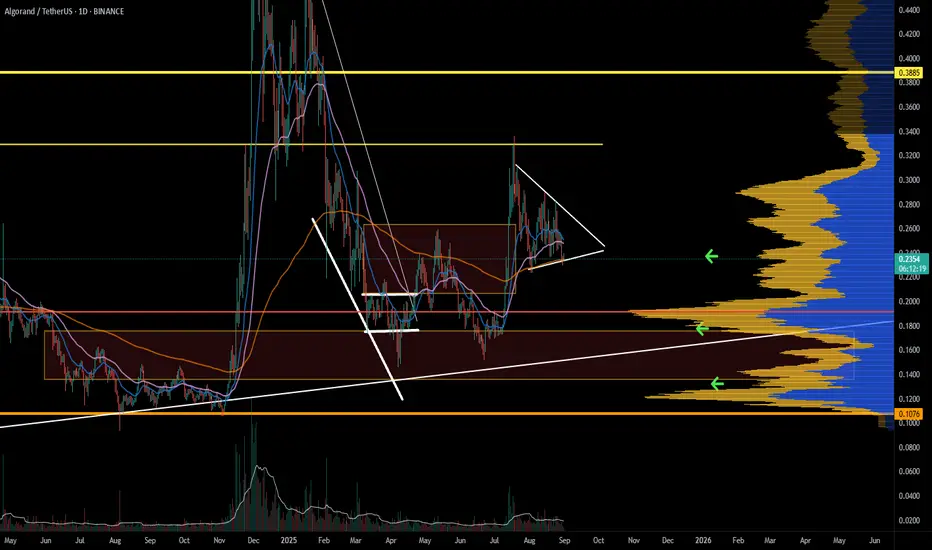
Buy Algo right here !!I am all eyes on Algo to break my trigger line (around 0.2250). then the buy setup will be activated :)
First midterm target --> 0.43

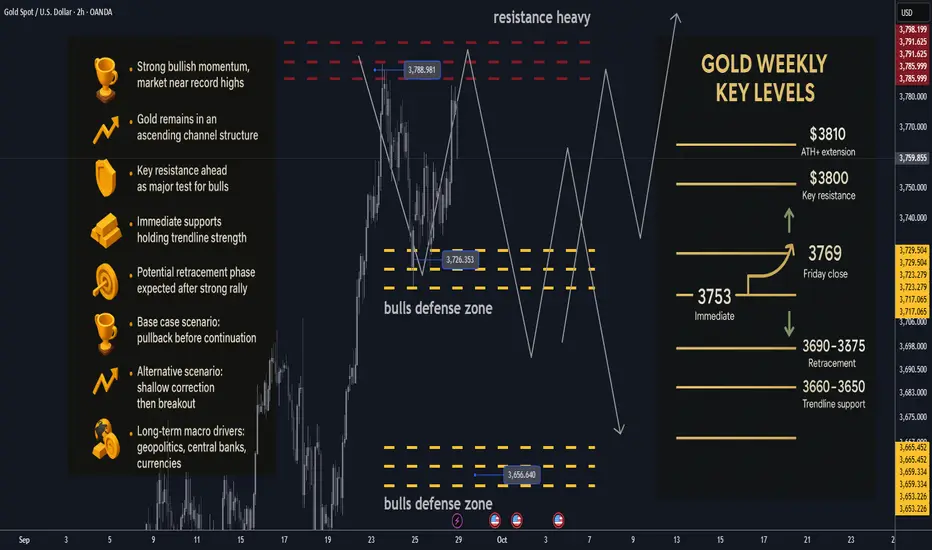
Gold next week: Key S/R Levels and Outlook for Traders🏆 Friday’s Close & Recent ATH: Gold closed the week near $3,769, not far from its latest all-time high ($3,734) as bullish momentum continues to dominate. Every dip is being met with strong buying interest, reinforcing the uptrend.
📈 Trend Structure: The market remains firmly inside an ascending channel on both 1H and 4H charts. The broader structure is bullish, with corrections appearing as healthy consolidations rather than reversals.
🔑 Key Resistance Levels: T he most critical resistance sits at $3,800, a psychological and technical barrier. Beyond that, $3,810–3,820 represents potential breakout extension targets if bulls push through.
🛡️ Support Zones: Immediate support rests at $3,753–3,755, aligned with a rising trendline. Deeper supports lie at $3,690–3,675, with stronger downside protection at $3,660–3,650. A sustained break below $3,650 would signal deeper correction risk.
⚖️ Likely Scenarios:
o Scenario 1 (Base Case) – A short-term pullback toward support before continuation higher.
o Scenario 2 – A shallow correction, followed by a direct breakout above $3,800.
Probabilities currently favor Scenario 1 due to overbought conditions.
📊 Short-Term Targets: On continuation, upside levels to monitor are $3,740 → $3,780 → $3,800, with a possible push toward $3,810 ATH+ extension.
💡 Market Sentiment Drivers: Geopolitical tensions, central bank accumulation, and persistent currency debasement concerns remain key macro tailwinds. These factors underpin the long-term bullish bias, despite near-term choppiness.
🔄 Retracement Outlook: Analysts suggest a retracement is due after the strong run-up. A controlled dip into the $3,660–3,640 zone could offer buying opportunities for swing traders targeting another leg higher.
🧭 Risk Levels to Watch: Holding above the ascending trendline (around $3,630–3,640) keeps the bullish structure intact. A decisive break below this area could trigger a deeper correction toward channel midpoints.
🚀 Overall Weekly Outlook: Gold remains in a strong bullish trajectory with $3,800 as the major battleground. Expect short-term pullbacks, but the path of least resistance is still higher, with long-term prospects pointing toward $4,000.
September 2025 Market Summary Gold and ForexProjectSyndicate Market Summary September 2025
📊 MTD performance
🟡 GOLD (XAUUSD): 3,759.65 | +286.65 (+8.31%)
💶 EURUSD: 1.1702 | +16 pips (+0.14%)
💷 GBPUSD: 1.3392 | −112 pips (−0.83%)
💴 USDJPY: 149.19 | +211 pips (+1.43%)
📈 SPX: 6,637.97 | +236.46 (+3.69%)
📈 NDX: 24,503.57 | +1,483.10 (+6.44%)
________________________________________
🗞 September overview
• 🇺🇸 The Fed cut 25 bps on September 17 and flagged the possibility of further cuts this year, reinforcing a softer USD bias and boosting gold demand.
• 🇪🇺 The ECB held rates on September 11, though left the door open for easing later.
• 🇬🇧 The Bank of England held rates and slowed quantitative tightening on September 18.
• 🇯🇵 The BoJ maintained a “hawkish hold” on September 19, started unwinding ETF/REIT holdings, and signaled possible rate risks into October — supporting JPY on abrupt USD strength.
• 🟡 Gold made a fresh intramonth high near ~$3,790, before settling slightly lower.
• Stronger U.S. economic data mid-month (jobs, yields) briefly undercut rate cut expectations, leading to a temporary gold dip, but the momentum has largely resumed.
• Tariff announcements and trade-policy uncertainty added safe-haven tailwinds to gold.
________________________________________
🟡 Gold Market Overview – September 2025
✨ Key Highlights & Drivers
• All-time high revisit: Spot gold pushed toward $3,790 mid-month on renewed enthusiasm for Fed easing and weaker USD.
• Volatility around economic surprises: Upside surprises in US data (jobs, GDP) triggered brief USD strength that pressured gold, but the downside was limited.
• Fed narrative remains gold’s ally: The dovish pivot (25 bps cut + future cuts flagged) continues to lend structural support to gold.
• ETF & institutional flows: Inflows into gold ETFs have reaffirmed investor appetite for safe-haven exposure.
• Risk / geopolitical spillovers: Oil price jitters, trade frictions, and general macro uncertainty underpin demand for non-correlated assets.
• Technical posture: After surging, gold has found interim support in the region of ~$3,650–3,700, with resistance clustering near $3,800. A sustained break above the latter could open targets toward $3,900+.
📊 Performance Recap
Gold has posted one of its strongest monthly performances of 2025, currently up ~8.7 % MTD.
Stronger parts of the rally were clustered around rate cut confirmation and safe-haven demand spikes.
🔍 Risks & Watch-Outs
• A surprise resurgence in U.S. economic strength (inflation, jobs) could push rate markets back toward dovish skepticism, pressuring gold.
• A re-strengthening USD (driven by rates or yield spreads) will be headwind for dollar‐priced gold.
• Central bank actions: further buying or selling by official sectors could tilt balance.
• Technical overextension: short-term pullbacks or consolidations are plausible given the sharp run-up.
________________________________________
💱 FX Landscape – September 2025
• EURUSD: The pair remains stuck under ~1.1700, recovering modestly from USD spikes but lacking strong directional conviction.
• GBPUSD: Under pressure through the month, sliding toward 1.3350 as sterling weakens on yield differentials and global risk dynamics.
• USDJPY: Strength in yields and risk dynamics have nudged USDJPY higher, though BoJ vigilance and intervention risk temper runaway moves.
Broader theme: while risk sentiment supports carry / USD strength, central bank policy cycles and macro surprises are injecting volatility and preventing runaway trends.
________________________________________
📝 Summary & Key Takeaways
✅ What Worked in September
• Gold leveraged dovish central bank messaging and USD softness to consistently outperform across risk regimes.
• Positioning toward safe havens paid off in a month marked by macro surprises and geopolitical noise.
• FX markets remained choppy, with no clear trending momentum — caution was rewarded.
⚠️ What to Watch Going Forward
• U.S. data flow — especially inflation, jobs, and PCE — could reshape Fed expectations and thus gold/FX direction.
• USD momentum — a reversal in dollar strength could compress gold gains; sustained USD weakness could accelerate the bull run.
• Intervention / central banks — any surprises from BoJ, PBoC, or central banks stepping into gold or FX markets could upend positioning.
• Technical zones — if gold can break and hold above $3,800, it may open new leg toward $3,900+; failure may invite a pullback toward $3,650–3,700.

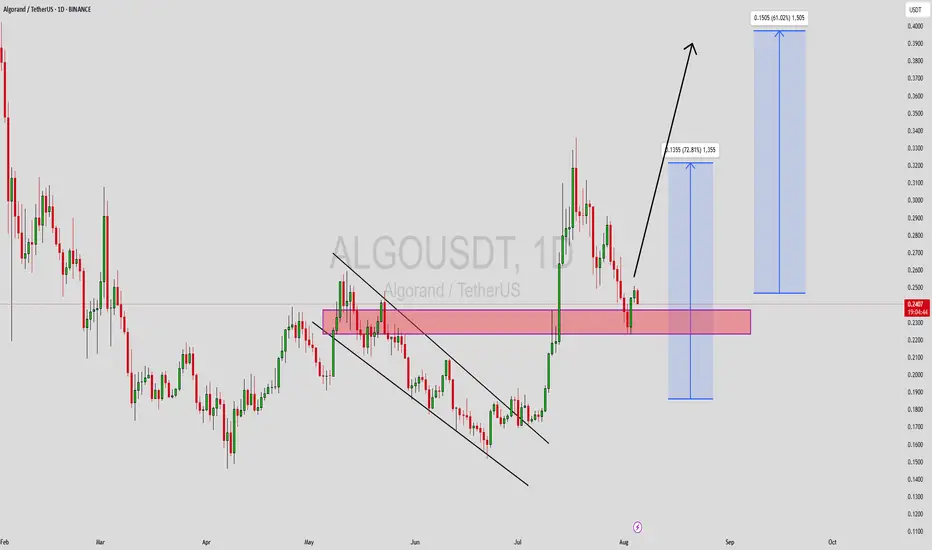
ALGO/USDT - Swing Setup | Low-Risk Long Targeting +273%🚀 Trade Setup Details:
🕯 #ALGO/USDT 🔼 Buy | Long 🔼
⌛️ TimeFrame: 1D
--------------------
🛡 Risk Management (Example):
🛡 Based on $10,000 Balance
🛡 Loss-Limit: 1% (Conservative)
🛡 The Signal Margin: $409.84
--------------------
☄️ En1: 0.2258 (Amount: $40.98)
☄️ En2: 0.2056 (Amount: $143.44)
☄️ En3: 0.1924 (Amount: $184.43)
☄️ En4: 0.1799 (Amount: $40.98)
--------------------
☄️ If All Entries Are Activated, Then:
☄️ Average.En: 0.1992 ($409.84)
--------------------
☑️ TP1: 0.2835 (+42.32%) (RR:1.73)
☑️ TP2: 0.336 (+68.67%) (RR:2.81)
☑️ TP3: 0.4171 (+109.39%) (RR:4.48)
☑️ TP4: 0.549 (+175.6%) (RR:7.2)
☑️ TP5: 0.7437 (+273.34%) (RR:11.2)
☑️ TP6: Open 🔝
--------------------
❌ SL: 0.1506 (-24.4%) (-$100)
--------------------
💯 Maximum.Lev: 2X
⌛️ Trading Type: Swing Trading
‼️ Signal Risk: 🙂 Low-Risk! 🙂
--------------------
🔗 www.tradingview.com
❤️ Your Like & Comments are valuable to us ❤️

Algo Bullish FlagAlgo formed a bullish wedge and it's about to break the trend line.
Wait for it to break the resistance and when it established above we can enter.
Stops at 0.22.

ALGOUSDT – Swing Trade Setup at Key SupportAlgorand (ALGO) recently posted an impressive 29%+ rally, showing renewed strength in the altcoin space. After topping out, price is now pulling back into a significant support zone around $0.23, aligning with previous structure and demand levels.
This retracement could offer a high-probability long setup for swing traders. The support zone has historically acted as a launchpad for upside moves. A confirmation bounce or strong bullish candle from this area could lead to the next leg up.
🔹 Trade Setup:
Entry Zone: Around $0.23
Take Profit Targets:
🥇 $0.28 – $0.33
🥈 $0.45 – $0.50
Stop Loss: Just below $0.22
A daily close below $0.22 would invalidate the setup and suggest further downside. Watch for volume confirmation and price structure near the zone.

ALGO is heating up for an expansionALGO is consolidating, with a bias to the upside. However, we know that market makers like to play games, and the current momentum on LTF is down. Prepare to buy some dips.
Gold September Seasonality (Last 10 Years: 2015–2024)Gold is heading into September after a monster run in 2024/25. Unlike the “September slump” you hear about in crypto, gold’s last decade shows mostly mild, tactical moves in September—often driven by real yields, the dollar, and physical demand cycles. Once any early-month wobble plays out, dips have tended to be opportunities within the prevailing trend.
📊 Gold September Seasonality (Last 10 Years: 2015–2024)
Yearly September Returns
Year 📈 Return
2024 🟢 +4.99%
2023 🔴 −3.73%
2022 🔴 −2.32%
2021 🔴 −4.59%
2020 🔴 −3.70%
2019 🔴 −2.55%
2018 🔴 −1.93%
2017 🔴 −1.44%
2016 🟢 +1.02%
2015 🔴 −0.27%
📌 At-a-glance stats (2015–2024)
📉 Mean (10-yr): −1.45%
⚖️ Median: −2.13%
🔴 Red months: 8 out of 10
❌ Worst September: 2021 (−4.59%)
✅ Best September: 2024 (+4.99%)
📅 Recent Performance (last 3 years)
2024: 🟢 +4.99% → strongest September in the set
2023: 🔴 −3.73% → higher real yields weighed on bullion
2022: 🔴 −2.32% → strong USD + aggressive Fed hikes
➡️ Average of last 3 years: 🔴 −0.35%
➡️ Average of last 5 years (2020–2024): 🔴 −1.87%
________________________________________
🔎 Key Insights
• Gentle September bias: Over the last decade, September has skewed slightly negative for gold (mean −1.45%), but the drawdowns are modest compared to risk assets.
• Cycle matters more than calendar: 2020–2023 saw consistent reds as the dollar firmed and real yields rose; 2024 flipped green as rate-cut expectations and central-bank demand underpinned prices.
• Long-term seasonality ≠ last-decade reality: Multi-decade studies often show gold firming into late summer/early autumn (festival/jewelry demand, restocking), but the last 10 years were dominated by policy and yields—diluting that classic pattern.
________________________________________
🚀 Macro & Market Context
• 2019–2020: Trade tensions into COVID—gold corrected in Sep ’19 (−2.6%) and more so in Sep ’20 (−3.7%) after August’s spike to new highs.
• 2021: Fed taper talk + rising real yields → weakest September (−4.6%).
• 2022: King Dollar & rapid hikes → another red September (−2.3%).
• 2023: Real yields kept pressure on bullion (−3.7%).
• 2024: Sentiment flipped on policy expectations and persistent central-bank demand → solid +5.0% September.
________________________________________
🧭 Takeaway
Gold’s September over the last decade has leaned slightly bearish, but mostly in controlled, single-digit moves. The signal isn’t “sell September,” it’s “watch real yields, the USD, and physical flows.” When those line up, the calendar fade loses its bite—as 2024 showed.

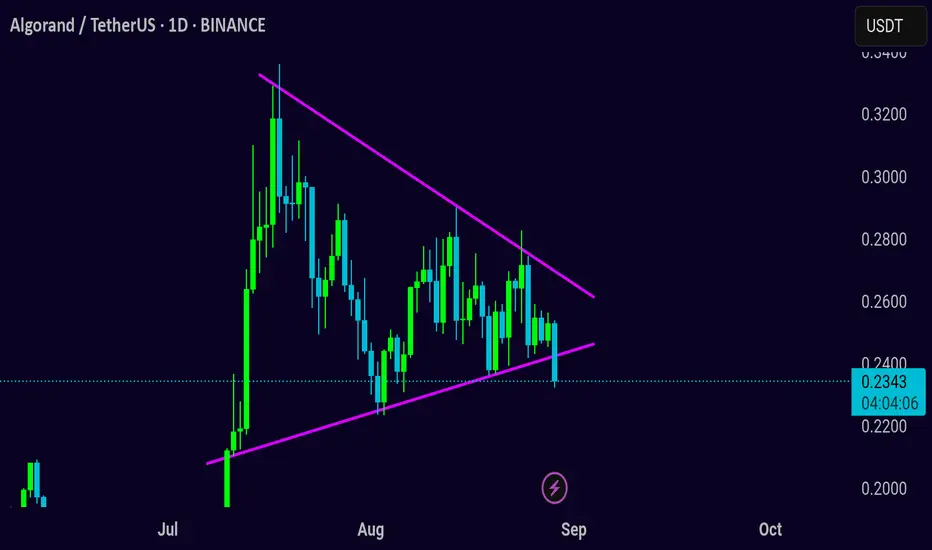
AlgoUsdt IdeaALGOUSDT UPDATE:
ALGO is currently trading around $0.2350. ALGO is breaking down a symmetrical triangle on the daily time frame. The possible scenarios are if the price successfully breaks the triangle and gives a daily close, then we may see bearish momentum in #ALGO. Otherwise, if it pumps from here and trades inside the triangle again, then it may go towards the upper resistance trendline of the triangle. Keep an eye on it.
Four Coins for the Longer Run – My PlanWhen it comes to crypto, I’m definitely not the “buy & hold to the moon 🚀” type of trader. I prefer realistic targets, good entries, and a clear plan.
That being said, there are a few coins where I’m willing to have more patience, aiming for a 3x or more return.
For the first three (ADA, ALGO, XDC), the ETF story could play a big role in the coming year. FET is a different case, but one I still like. Let’s go one by one.
ADAUSD
- After the ATH above 3 in 2021, ADA collapsed more than 90%, bottoming in 2023 near 0.23.
- That bottom marked the start of a long accumulation phase, followed by an upside breakout in Nov 2023.
- Each correction since then has formed higher lows (0.3 → 0.5), showing strength.
- July’s rise looks constructive, and last week price also broke the falling trendline.
📌 Plan:
Accumulate around 0.9 and below, with DCA reserve if we see 0.65–0.67 zone.
Target: 2.3 in the first phase. Above that, I’ll reassess for a possible run toward ATH.
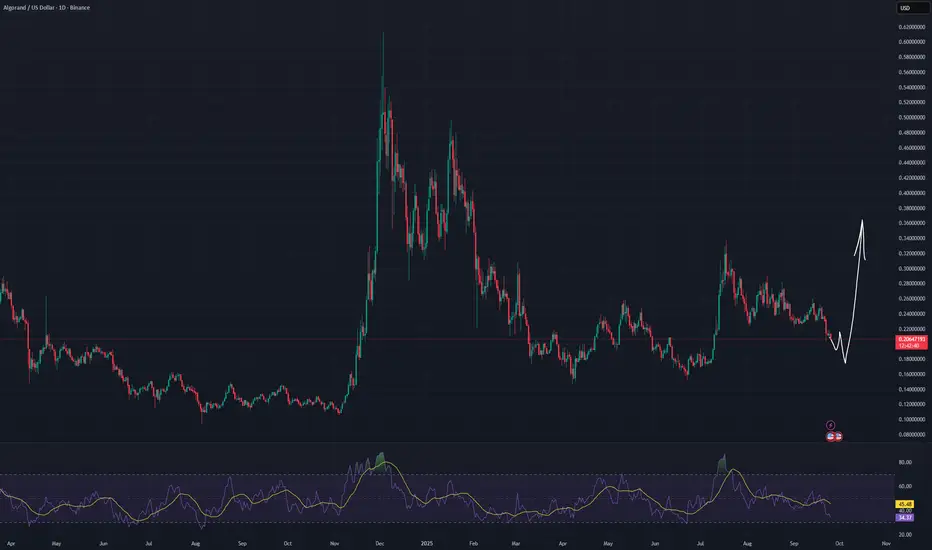
ALGO
- ALGO’s drop was even harsher, losing more than 90% from its peak.
- Found bottom near 0.1, and despite the spike late last year, it’s mostly still sideways accumulation.
For me, this is exactly the kind of base-building I like to see before a real run.
📌 Plan:
Buy near 0.2, keep reserves for a DCA if it drops again to 0.1.
Target: at least 0.7, then I’ll evaluate if market conditions favor holding further.
XDC
- XDC is more speculative, but also more explosive.
- The structure shows that a 3x to 5x move isn’t unrealistic once momentum picks up.
- With potential ETF headlines in play, it could be a nice upside surprise.
📌 Plan:
First buy zone around 0.07, with DCA reserves at 0.045.
Target: 0.15 in the first stage.
FET – Not About ETFs, But Strong Potential
- Different case here – no ETF talks, but I like the project.
- Already holding from around 0.4.
- If price dips to 0.55, I’ll add more.
📌 Target: 2.0 USD.
Final Thoughts
I’m not aiming for x100 fairy tales. My strategy is simple:
- Enter at accumulation levels
- Use DCA wisely
- Take profits at realistic targets

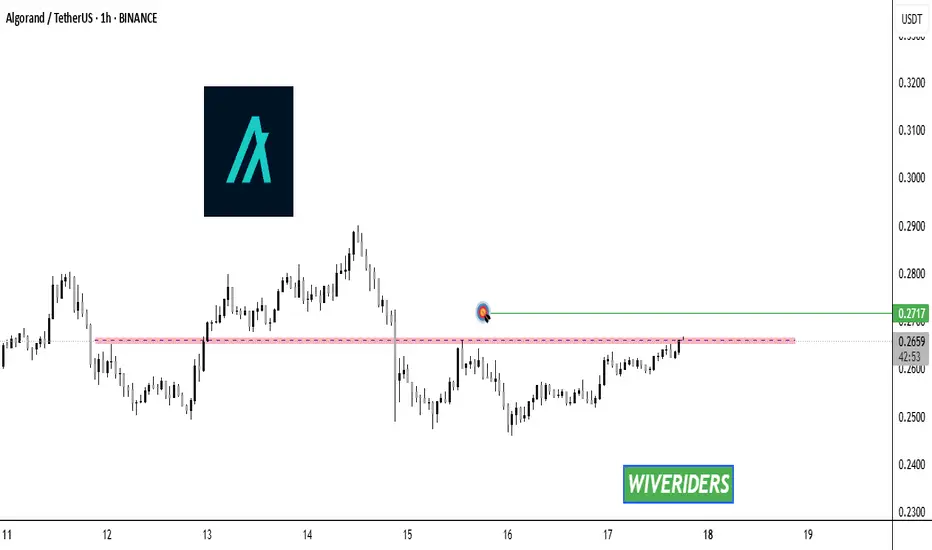
ALGO Breakout Alert! 🚨 EURONEXT:ALGO Breakout Alert! 🚨
EURONEXT:ALGO is currently testing the red resistance zone 🔴
If price breaks out, the first target will be the green line level 🎯
A confirmed breakout here would signal bullish continuation and could drive further upside ✅
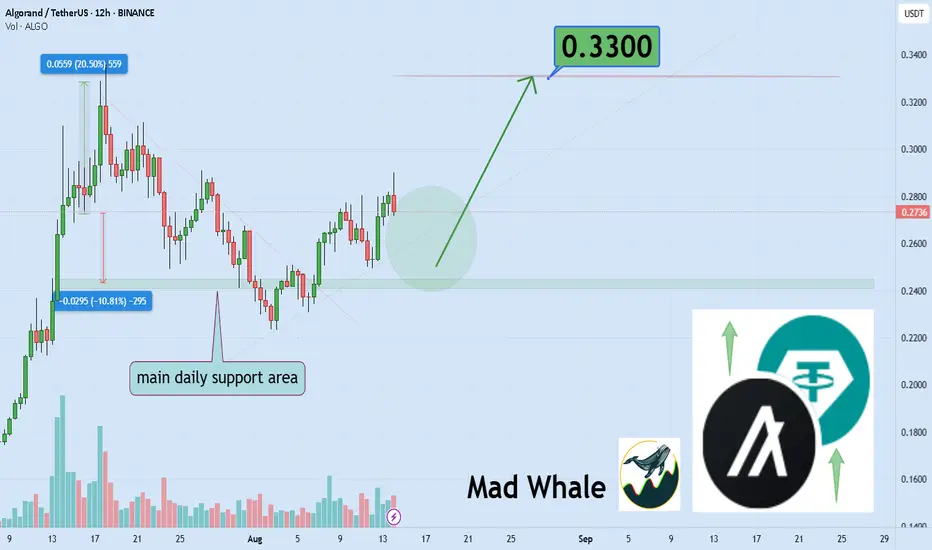
Algorand Trading Volume Signals Potential 20% Gain To 0.33Hello✌️
Let’s analyze Algorand’s price action both technically and fundamentally 📈.
🔍Fundamental analysis:
Algorand has updates coming new wallet, quantum-proof security, and enterprise tools.
Big moves like 100M USDC minted and partnerships with FIFA & TravelX show real-world use.
If the roadmap works out, demand might rise, but ALGO’s still far from its all-time high. 📈🚀
📊Technical analysis:
BINANCE:ALGOUSDT shows solid trading volume with a nearby daily support level. If this zone holds, a potential 20% upside could be expected, aiming for $0.33. Monitor the price closely and manage risk accordingly. 📈🛡️
✨We put love into every post!
Your support inspires us 💛 Drop a comment we’d love to hear from you! Thanks, Mad Whale
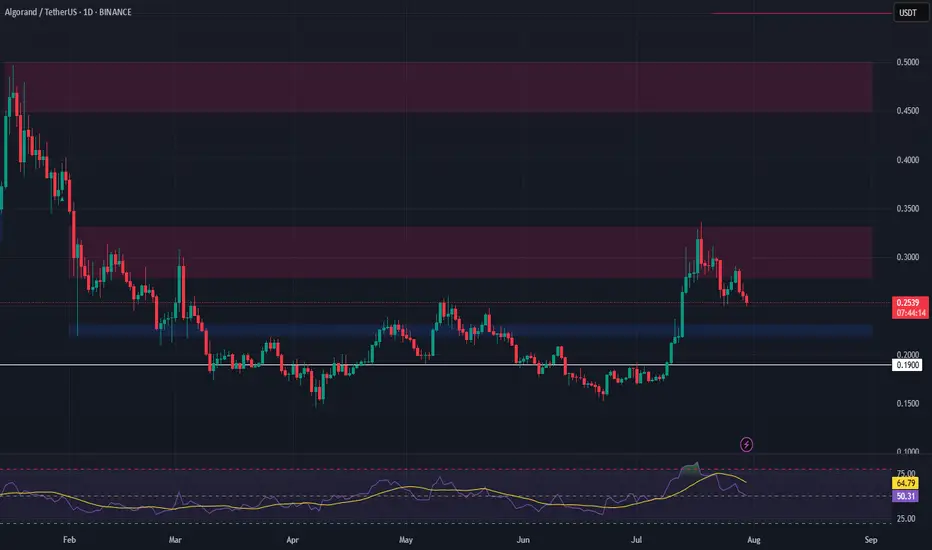
ALGOUSDT Forming Bullish WaveALGOUSDT is currently demonstrating a Bullish Wave Pattern, a strong technical signal that often precedes a significant upward price movement. This pattern typically forms in trending markets, suggesting a series of higher highs and higher lows that indicate sustained buying interest. With this wave structure unfolding, the market appears to be favoring a continuation of the current uptrend, making ALGO an appealing candidate for mid-term gains.
The volume profile is showing a steady increase, which supports the pattern’s validity and hints at rising momentum. A strong volume base during the formation of bullish wave patterns is often an early indication of institutional accumulation or renewed retail participation. With key support levels holding firm and resistance levels gradually weakening, the setup points to a potential price surge of 50% to 60% or more if bullish momentum continues.
Algorand’s fundamentals are also contributing to growing investor interest. Known for its scalable blockchain technology and low transaction fees, ALGO has seen increasing adoption in DeFi and enterprise-level blockchain solutions. This growing utility, combined with the current bullish technical setup, enhances the coin’s attractiveness for both swing traders and long-term holders.
In summary, ALGOUSDT’s bullish wave pattern coupled with rising volume and positive sentiment could signal the start of a powerful upward move. Traders should keep an eye on breakout zones and confirmation candles to capitalize on this emerging opportunity.
✅ Show your support by hitting the like button and
✅ Leaving a comment below! (What is You opinion about this Coin)
Your feedback and engagement keep me inspired to share more insightful market analysis with you!
ALGO Swing Trade – Waiting for Pullback to Key SupportAfter a 100%+ surge, ALGO is now retracing and approaching a critical support zone. A dip into this area could offer a strong entry for the next leg higher.
📌 Trade Setup:
• Entry Zone: $0.22 – $0.23
• Take Profit Targets:
o 🥇 $0.28 – $0.33
o 🥈 $0.45 – $0.50
• Stop Loss: Just below $0.19
ALGOUSDT Forming Bullish Flag ALGOUSDT is currently trading inside a well-defined bullish Flag pattern on the 4-hour chart, a structure known for its bullish breakout potential. The price recently tested a significant demand zone, which previously acted as a base for a strong upward move earlier in July.
Key Points:
Bullish Flag Structure: Price is compressing within converging trendlines, forming lower highs and lower lows a classic bullish flag pattern.
Support Zone: The $0.24 – $0.255 area has acted as a strong demand zone, providing reliable support.
Bounce Potential: A bullish reaction from the lower flag boundary and demand zone could lead to a move toward the upper trendline and potentially trigger a breakout.
200 EMA Support: The 200 EMA is currently providing dynamic support, reinforcing the bullish setup.
Breakout Confirmation: A breakout above the flag resistance with strong volume could initiate a rally toward the $0.30 – $0.40 zone.
Cheers
Hexa