#ALICE/USDT – Potential Trend Reversal After Long Accumulation#ALICE
The price is moving within a descending channel on the hourly timeframe. It has reached the upper boundary and is heading towards breaking it. A retest of this boundary is expected.
The Relative Strength Index (RSI) is showing an upward trend, as it has approached the upper boundary. A bearish reversal is expected.
There is a key support zone in green at 0.1703. The price has bounced from this zone several times and is expected to bounce again.
A consolidation trend is observed above the 100-period moving average, which we are approaching. This trend supports a decline towards this level.
Entry Price: 0.1726
Target 1: 0.1759
Target 2: 0.1797
Target 3: 0.1837
Stop Loss: Above the green support zone.
Remember this simple thing: Money management.
For any questions, please leave a comment.
Thank you.
ALICEBUSD

#ALICE/USDT – Potential Trend Reversal After Long Accumulation#ALICE
The price is moving within a descending channel on the hourly timeframe. It has reached the lower boundary and is heading towards a breakout, with a retest of the upper boundary expected.
The Relative Strength Index (RSI) is showing a downward trend, approaching the lower boundary, and an upward bounce is anticipated.
There is a key support zone in green at 0.1650. The price has bounced from this level several times and is expected to bounce again.
The indicator is showing a trend towards consolidation above the 100-period moving average, which we are approaching, supporting the upward move.
Entry Price: 0.1700
First Target: 0.1750
Second Target: 0.1786
Third Target: 0.1841
Stop Loss: Below the green support zone.
Don't forget one simple thing: Money Management.
For inquiries, please leave a comment.
Thank you.

#ALICE/USDT – Potential Trend Reversal After Long Accumulation#ALICE
The price is moving within a descending channel on the 1-hour frame, adhering well to it, and heading for a strong breakout and retest.
We have a bearish trend on the RSI indicator that is about to be broken and retested, which supports the upward move.
There is a major support area in green at 0.3306, which represents a strong support point.
We are heading for consolidation above the 100 moving average.
Entry price: 0.4168
First target: 0.3473
Second target: 0.3580
Third target: 0.7300
Don't forget a simple matter: capital management.
When you reach the first target, save some money and then change your stop-loss order to an entry order.
For inquiries, please leave a comment.
Thank you.

#ALICE/USDT#ALICE
The price is moving within a descending channel on the 1-hour frame, adhering well to it, and is heading for a strong breakout and retest.
We have a bearish trend on the RSI indicator that is about to be broken and retested, which supports the upward breakout.
There is a major support area in green at 0.3500, which represents a strong support point.
We are heading for stability above the 100 moving average.
Entry price: 0.3849
First target: 0.3989
Second target: 0.4097
Third target: 0.4234
Don't forget a simple matter: capital management.
When you reach the first target, save some money and then change your stop-loss order to an entry order.
For inquiries, please leave a comment.
Thank you.

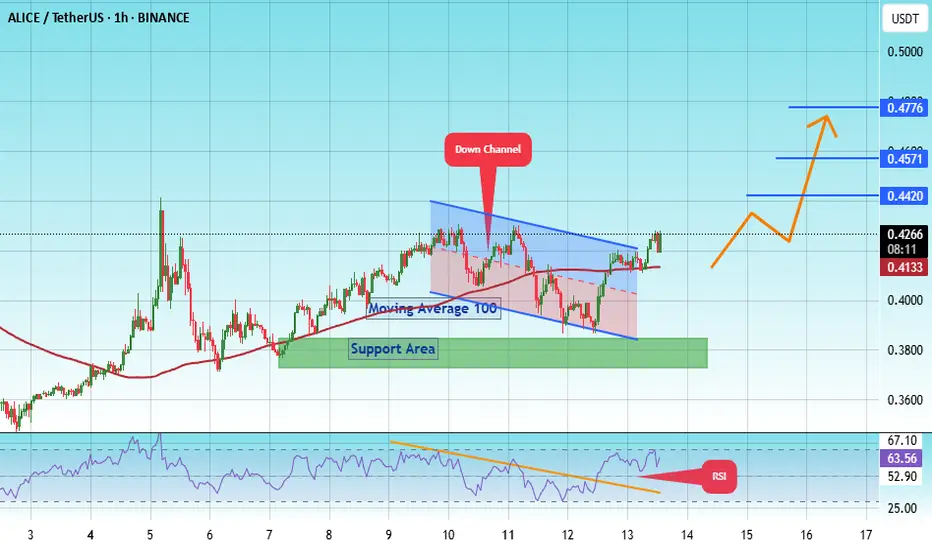
#ALICE/USDT Ready to go higher !#ALICE
The price is moving within an ascending channel on the 1-hour frame, adhering well to it, and is on track to break it strongly upwards and retest it.
We have support from the lower boundary of the ascending channel, at 3888.
We have a downtrend on the RSI indicator that is about to break and retest, supporting the upside.
There is a major support area in green at 0.3777, which represents a strong basis for the upside.
Don't forget a simple thing: ease and capital.
When you reach the first target, save some money and then change your stop-loss order to an entry order.
For inquiries, please leave a comment.
We have a trend to hold above the 100 Moving Average.
Entry price: 0.4250
First target: 0.4420
Second target: 0.4571
Third target: 0.4776
Don't forget a simple thing: ease and capital.
When you reach the first target, save some money and then change your stop-loss order to an entry order.
For inquiries, please leave a comment.
Thank you.
#ALICE/USDT#ALICE
The price is moving within a descending channel on the 1-hour frame, adhering well to it, and is on its way to breaking it strongly upwards and retesting it.
We are seeing a bounce from the lower boundary of the descending channel, which is support at 0.4560.
We have a downtrend on the RSI indicator that is about to break and retest, supporting the upward trend.
We are looking for stability above the 100 moving average.
Entry price: 0.4835
First target: 0.5028
Second target: 0.5263
Third target: 0.5533

#ALICE/USDT#ALICE
The price is moving in a bearish channel on a 4-hour frame and is holding it strongly and is about to break it upward
We have a bounce from the green support area at 1.10
We have a tendency to stabilize above the Moving Average 100
We have a downtrend on the RSI indicator that is about to break higher and supports the rise
Entry price 1.26
The first goal is 1.57
Second goal 1.91
Third goal 2.32

#ALICE/USDT#ALICE
The price has been moving in a bearish flag since April 2022
We are now on the verge of breaking that pattern by breaking the downtrend
Supported by oversold on MACD
Current price 1.030
First goal 1.18
Second goal 1.255
The rise will be supported by the break of Moving Average 100
You must pay attention to the correction points on the chart

#ALICE/USDT LONG#ALICE
The price has been moving in a bearish flag since April 2022
This pattern was broken by breaking the downtrend
Supported by my sell saturation on the MACD on a daily frame
Current price 1.18
First goal 1.79
Second goal 2.25
The rise is supported by the moving average 100 break of
We have a lot of bullishness in Bitcoin

#Alice/Usdt
#Alice
The chart represents a bullish prediction for the ALICE cryptocurrency, indicating that it is preparing for a massive breakout and 2-3x price increase.
Once the descending channel is broken, we expect a strong bullish trend
With significant oversold support that supports the rise in the mid-term.

ALICEUSDT - Falling Wedge Pattern!!ALICEUSDT (1D Chart) Technical analysis
ALICEUSDT (1D Chart) Currently trading at $1.67
Buy level: Above $1.65
Stop loss: Below $1.37
TP1:$1.80
TP2: $2.2
TP3: $2.5
TP4: $2.9
Max Leverage 2x
Always keep Stop loss
Follow Our Tradingview Account for More Technical Analysis Updates, | Like, Share and Comment Your thoughts

ALICE %50 growth after my signal ,more upsideALICE /USDT
We bought it very low at early bullish signals and made over 50% gains in spot
But that not the end ,
now it’s testing the daily resistance
I expect a small pullback first
More upside will come ONLY AFTER breaking-out
And there , newcomers can buy
Remember: never long below resistance

ALICEUSDTHere we have a historycal chart of Alice and if the history is repeated we can make a very good profit

ALICEUSDTALICE looks good and I think we can trust it and publicly we see a positive movement in the coming days

ALICEUSDT, The price is moving in downward trendHello everybody
Alice is one the most popular token of game in blockchain that is ...
If you wanna learn the movement of ALICE you can check previous analysis of it .
According to the chart and as you can see after the price broke the support level that is resistance level at this time the trend of the market until is downward and now we need to have recovery and have some pullback then its ready to drop again and make new target BUT EVERY THINGS IS DEPENDS ON BTC MARKET.
If you wanna take in position, dont forget use stop loss and observe to capital management then take position.
Previous analysis :
Good Luck
Abtin


ALICE hey traders, there is Alice, we need a close above the blue line for 1D bar to get the green line (short term's targets)
the yellow lines (long term's targets) and the stop loss is a close under the red line for 1D bar
DON'T ENTER BEFORE THE CLOSING!!
.
trade carefully guys and don't forget the risk management & take profits.
.
.
.
.
.
.
.

ALICEUSDT LOOKS BULLISHALICEUSDT can be taken long above breaking of 25 level.
targets levels are on chart.
very good risk :reward.

Alice 12h Continued growth — difficult, but possibleThe $22.50-23.50 selling zone from our previous Aliceusdt idea has fully worked out.
But if you look at it, you will see that according to our idea, the price of Aliceusdt did not reach the previously expected buying zone. It's true, but we followed this pair, and we saw the strength and the stubbornness of the buyers, who wanted to drive the price Alice up without a deep correction. Therefore, we took a long position right before the strong move of the Aliceusd price upwards.
You can read more about the trade and the logic of entry in the statistics of our 2-year Trade Marathon, which we periodically publish here.
Now you can see on the Aliceusd chart that there are still buyers who are willing to hold the Alice price and push it up.
The main condition is to keep the price above $16.50 and then there will be a very high chance of doubling it to the $33 area.
If this scenario works out, of course, that it will be necessary to analyze the crypto market situation in more detail again. But preliminary, our assumption is that in further, Aliceusdt price may start a thorough correction to the area of $8.50 .
_____________________
Do you like the idea fulfilment? Does it help you trade and make a profit?
Do you want more forecasts from us?
Give us motivation! (Like, comment and donate). These little things won't make us rich, but they will warm the trader's soul while writing the next idea!

ALICEUSDT Trade ideaStop loss : 14.35
Take Profit 1 : 15.66
Take Profit 2 : 16
Take Profit 3 : 17.50

ALICE/USDT 1HOUR UPDATE Welcome to this quick
Alice/usdt analysis.
I have tried my best to bring the best possible outcome me in this chart.
Reason of trade :- alice/usdt analysis is triangle ready and green zone fast by the dip.
And Alice/usdt is fundamentals is strong is metaverse !
Entry:- cmp And green zone
Traget:- 30% to 35%
Stoploss:- $11.45
Remember:-This is not a piece of financial advice. All investment made by me is under my own risk and I am held responsible for my own profit and losses. So, do your own research before investing in this trade.
Happy trading.
Sorry for my english it is not my native languages.
Do hit the like button if you like it and share your charts in the comments section.
Thank you...


alice gunna pump.Hey,
updating Alice,
nothing to add more but
we structuring C wave of the sec wave.
Touching 11.20$ will have us recounting≈analysis fails
SL of this trade is 10.47 still.
Targets been set already on previous posts
gud entry point.
I'd rather think we will finish this correction with $btc atm and they will go to their targets same time.
