Target 40% CAGR: 2026 High-Alpha PortfolioObjective: I’m targeting a 40% CAGR with this allocation. It’s an aggressive goal, but I believe it’s achievable by concentrating capital into "monopoly-moat" tech while using a structural hedge to buy the dips.
The Asset Mix:
Growth Engine (75%):
The AI Backbone: NVDA (20%) / AVGO (15%) / TSM (10%). Pure infrastructure play.
Software Scale: PLTR (10%) / MSFT (5%) / AMZN (5%). High-margin recurring revenue.
Disruptor: TSLA (10%). High-beta kicker for autonomy/robotics.
Capital Preservation (25%):
BRK.B (10%) / GLD (10%) / GS (5%). These are my "shock absorbers." They provide the liquidity and stability needed to survive volatility.
Execution Logic: By pairing high-beta assets with non-correlated hedges, I’m optimizing the Sharpe Ratio to ensure I can stay fully invested even during market corrections.
Management:
Quarterly Rebalancing: I will rebalance weights back to these targets every 90 days. This systematically forces me to sell overvalued winners and rotate into undervalued laggards.
Public Record: Logged on IBKR/OKX. Posting here for real-time transparency and accountability.
ALPHA-C

XLM - My top pick for a potential AltseasonCRYPTOCAP:XRP is a beast. One of the best asymmetric opportunities in crypto.
But levering it directly is how people get wiped:
Long calls = capped risk, total loss possible
Daily leverage bleeds over time
Futures are… futures
There’s a simpler approach: high-beta proxies .
These are assets tightly correlated to CRYPTOCAP:XRP that tend to move more, both up and down — and during risk-on regimes, that beta can convert into alpha .
CRYPTOCAP:SOLO Ultra-high beta, but liquidity risk is real.
NYSE:FLR Lower beta, improving fundamentals, still volatile.
Then there’s BITRUE:XLMXRP
An CRYPTOCAP:XRP fork led by an original founder, with deep liquidity and a multi-billion dollar market cap. Big enough to survive drawdowns, small enough to move fast.
Market caps:
CRYPTOCAP:SOLO — $63M
NYSE:FLR — $940M
CRYPTOCAP:XLM — $7.4B
The BITRUE:XLMXRP pair tells the story.
Long-term downtrend, yes — but during risk-on phases, CRYPTOCAP:XLM has repeatedly overshot CRYPTOCAP:XRP .
Why?
Retail reflexivity
Faster marginal flows
Lower unit-price psychology
Altseason rotation dynamics
If flows stay narrow and institutional, CRYPTOCAP:XRP likely leads.
If altseason arrives, history says CRYPTOCAP:XLM ’s beta can turn into alpha .
Moderate risk.
Extreme upside.
CRYPTOCAP:XLM is my top high-beta proxy for an CRYPTOCAP:XRP run ✨

Risk Management: The Art of Long-Term Survival
Risk Management
Imagine a hero standing at a crossroads with three paths.
If he takes the road to the right, he will face a serious challenge with a difficulty level of 100. At the end of this path, however, he will be rewarded with five gold bars.
The middle road leads to ten gold bars, but the hero will encounter not one, but three challenges along the way. Each of them is no less difficult than the one on the right-hand road. Taken together, their total difficulty amounts to 300.
The left road involves a less demanding challenge with a difficulty of 60, but the reward is modest — only one gold bar.
Which path would you choose if you were in the hero’s place?
Now suppose the hero chose a balanced level of risk, but along the way he was bitten by a snake and never even reached the challenge.
This is exactly what risk-taking in financial markets looks like.
In the real world, risk is first and foremost the probability of loss.
Risk is an inevitable consequence of the fact that the future is unknown. At any given moment, there are far more possible outcomes than those that ultimately materialize. It is precisely this gap — between the range of potential outcomes and the single realized result — that gives rise to risk. The future cannot be viewed as a predetermined or predictable script; it is a spectrum of possibilities that includes both favorable and unfavorable outcomes.
An investor may estimate the range of the most likely scenarios and base their expectations of the future on them. However, even the most probable event offers no guarantee that it will actually occur.
Risk comes in many forms, and the probability of loss is only one of them. Another important type is the risk of missed opportunities — the risk of taking too little risk. Staying on the sidelines can cause an investor to miss a recovery or a growth phase and ultimately drop out of the investment process altogether.
Particularly destructive is the risk of selling at the bottom. In this case, the investor not only locks in losses but also forfeits the chance to participate in the subsequent recovery, which often leads to a permanent exit from the market.
There are also risks associated with rare but catastrophic events. These risks may remain hidden for a long time, creating the illusion that a strategy is safe — until they suddenly materialize with severe consequences, as in the example of the hero and the snake.
Risk has a contradictory and deceptive nature. It depends not only on the asset or the market itself, but also on the behavior of market participants. When people feel safe and confident, they tend to act less cautiously, and actual risk increases.
Conversely, when risk is recognized and perceived as high, behavior becomes more restrained, and risk may decrease.
Paradoxically, rising prices often increase risk, while falling prices can make an asset safer — even though most people intuitively perceive the opposite.
Risk management is not a one-time action or a reaction to a crisis; it is a continuous process.
Since it is impossible to know in advance when adverse events will occur, risk control must be present at all times, not only during periods of obvious threat.
The essence of a sound approach is not the complete avoidance of risk, but its conscious acceptance, analysis, and limitation. An investor takes on risks they understand, can diversify, and are adequately compensated for.
Ultimately, the investor’s task is to build an asymmetric outcome profile: to participate in upside when events unfold favorably, and to lose less when negative scenarios materialize.
Such asymmetry is a hallmark of true skill and reflects a deep understanding of probability distributions, hidden risks, and acceptable loss limits.
How to Form Your Own Risk Assessment in a Specific Situation
To address this question, it is useful to turn to the work of Ed Seykota. One of his core ideas can be summarized as follows:
Risk is not the size of a potential loss in itself, but the probability of that loss occurring given the current market structure.
An important implication follows from this:
The profit-to-loss ratio (risk/reward) is not an independent criterion of trade quality.
The risk of a specific trade is determined by two key factors:
the market environment,
the distribution of profits and losses.
However, the decisive element is not the absolute size of the potential profit, but the probability of achieving it, as defined by the market context
Consider a situation where the potential profit is relatively small compared to the possible loss. From a formal risk/reward perspective, such a trade appears unattractive. But if the market conditions suggest that the probability of a positive outcome is high — for example, around 90% — the risk no longer appears unreasonable. In this case, the trade is justified not by the magnitude of the payoff, but by the stability of the probabilistic edge.
An individual trade, taken in isolation, is meaningless. What matters is how similar situations play out over a large sample size.
Even with a very high probability of success, risk becomes unjustified if:
a negative scenario is capable of destroying a significant portion of the capital;
or a single rare loss outweighs the cumulative result of many successful trades.
This is why, within any robust system, probability and loss control must always go hand in hand. High probability without loss limitation is not trading — it is gambling.
Unjustified Risk
Suppose a trader manages to earn 5% on their account over the course of a month , while the benchmark — for example, the Nasdaq — delivers a return of 8% over the same period. What does this imply?
To answer this, we turn to the concept of alpha .
Alpha is a metric that measures how much a strategy’s or trader’s performance deviates from the benchmark return, after accounting for the level of market risk taken.
If a trader engages in active intraday trading — assuming operational, market, behavioral, and tail risks — yet achieves a return lower than that of the benchmark, this indicates that risk was taken without adequate compensation . The critical issue is not the mere presence of risk, but the relationship between risk and outcome.
By its nature, intraday trading involves high engagement, frequent decision-making, exposure to market noise, commissions, slippage, and psychological pressure. All of these factors increase the strategy’s total risk profile. If, despite this, the final result underperforms a passive benchmark, alpha becomes negative. This means that each unit of risk taken was not only unrewarded, but actually worsened the overall financial outcome.
In such a case, alpha does more than simply indicate “underperformance relative to the market.” It highlights the inefficiency of the risk taken . The trader is effectively performing a more complex and uncertain task while achieving a result that could have been matched — or exceeded — through passive exposure, without active trading and its associated risks.
This is precisely what constitutes unjustified risk: risk that does not increase expected returns and does not improve the distribution of outcomes.
Thus, intraday trading with returns below the benchmark is an example of risk-taking without economic rationale. Alpha here serves not as a goal, but as a diagnostic tool. If alpha is negative, it indicates that the trading risk is not merely unjustified — it is value-destructive relative to a passive alternative.
Integration into Trading
1. Market Context Comes Before the Trade
In real trading, the first object of analysis is not the entry, not the stop, and not the take-profit — it is the state of the market itself.
The key question you must answer is:
Is there a recurring market situation here that historically shifts the probability in my favor?
If the situation is not repeatable and lacks a clear internal logic, the trade is not considered at all — regardless of how attractive the risk/reward ratio may look.
2. Probability Matters More Than Potential Profit
Once the situation has been identified, the focus shifts not to profit, but to the probability of the scenario playing out.
In practical terms, this means:
You must understand why the market is more likely to continue the move rather than reverse.
The reason for entry should explain why continuation is more probable, based on the logic of market participants’ behavior — not merely be the result of a formal signal.
Even if the potential profit is relatively small, a trade may still be justified if:
The probability of success is consistently above random;
The situation is reproducible over a large sample size.
3. Loss Is Defined in Advance — and Rigidly
A loss is not something to “figure out along the way.”
It is defined before entering the trade and is not revised in the hope that the market will “come back.”
The core integration rule is simple:
No single loss should be capable of damaging the integrity of the system
This implies:
Strictly limited risk per trade;
No scenarios in which one unfavorable outcome wipes out the results of many successful trades.
4. Serial Thinking Instead of Evaluating Individual Trades
True integration happens at the mental level. You stop evaluating trades in terms of “profit or loss.”
Each trade is viewed as:
One element within a series;
One roll of the dice with a known probability bias.
In practice, this leads to:
No emotional reaction to a single loss;
No euphoria from a single winning trade.
5. Trade Selection Instead of Increased Activity
Integrating this approach almost always reduces the number of trades.
You enter the market only when:
The market provides a readable context;
The scenario has a statistical edge;
The risk is clearly defined in advance.
If the market does not offer these conditions, you do not “look for trades” — you wait.
6. Evaluating Results by Process, Not by Money
In real trading, success is not measured by daily PnL, but by:
Adherence to the logic of situation selection;
Discipline in loss limitation;
Consistency of execution.
A losing day can be a perfect day if all decisions were made within the framework of the system.
Risk Management Framework in Investing
Risk should be distributed not only across trading instruments, but also across sources of returns.
A portfolio composed of assets dependent on a single growth scenario creates an illusion of diversification while remaining structurally fragile. True diversification implies exposure to different sectors, asset classes, and underlying economic processes.
An important element of risk management is time diversification. Entering positions in stages reduces the risk of poor timing and mitigates the impact of short-term market fluctuations. Investing the full amount at a single price point turns an investment into a timing bet rather than a conviction in the underlying idea.
Liquidity risk must also be taken into account. An asset that cannot be sold without a significant discount carries hidden danger. Liquidity matters not during calm periods, but during times of stress, when exiting a position may become critically important.
Diversification also means being willing to keep part of the capital out of the market. Holding free liquidity reduces decision-making pressure and allows the investor to respond to opportunities that arise during periods of panic. Full capital deployment increases the risk of forced actions.
Risk reduction becomes necessary when uncertainty rises. Increasing correlations between assets, changes in macroeconomic conditions, growing leverage, or excessive market optimism are signals to reassess portfolio structure. In such periods, capital preservation takes precedence over returns.
An increase in investment risk is acceptable only when there is a sufficient margin of safety. Expanding exposure to higher-risk assets is justified when capital is growing, the investment horizon is long, and acceptable losses are clearly defined. An investor does not increase risk in an attempt to “catch up with the market.”
Portfolio structure should reflect not only the investor’s expectations, but also their ability to withstand unfavorable periods. There is no universal allocation; however, practical guidelines help keep risk within manageable limits.
Portfolio Structure Guidelines
Low-risk allocation serves as the foundation and stabilizer of the portfolio.
Typically, it represents 50–70% of total capital . This segment includes highly liquid assets with relatively predictable behavior. Its purpose is not to maximize returns, but to preserve capital and reduce overall portfolio volatility.
Moderate-risk allocation usually accounts for 20–40% of the portfolio. These are assets with growth potential but without critical dependence on a single scenario. They generate the core long-term returns and absorb part of the market’s fluctuations.
High-risk allocation is limited to 5–15% of capital. This segment includes assets with high volatility, asymmetric payoff potential, and an elevated probability of deep drawdowns. Losses in this zone must never threaten the integrity of the entire portfolio. If an asset can go to zero, its position size must be small enough for that outcome to be non-critical.
Rebalancing and Capital Discipline
Rebalancing is a mandatory component of risk management. As high-risk assets appreciate, their weight increases automatically, and part of the gains should be reallocated toward more stable segments. During market declines, the portfolio structure is reviewed based on changing conditions rather than emotional reactions.
Increasing exposure to high-risk assets is appropriate only when capital is growing, the investment horizon is long, and potential losses are clearly understood. Reducing exposure becomes necessary during periods of heightened uncertainty, macroeconomic shifts, or declining personal risk tolerance.
A portion of the portfolio should be held in cash. Cash is not inactivity or a missed opportunity — it is an asset that serves both defensive and strategic functions.
Typically, cash represents 10–30% of the portfolio , depending on market conditions and uncertainty. During stable growth phases, it may sit near the lower end of this range. In periods of elevated volatility, uncertainty, or after prolonged market rallies, increasing the cash allocation becomes prudent.
A cash position reduces overall portfolio risk and alleviates psychological pressure.
Free liquidity allows decisions to be made calmly, without the need to sell assets under unfavorable conditions.
The key principle lies not in finding the perfect percentage, but in maintaining the chosen structure . Discipline in risk allocation is more important than precision in initial calculations.
A Risk Management Framework in Trading
Risk management in trading does not begin with entering a trade; it begins with accepting the fact that any trade can end in a loss. A trader who is not internally aligned with this reality will inevitably violate their own rules. Accepting losses as a legitimate outcome is a fundamental condition for survival in the market.
Position sizing is more important than the entry point. Even a strong idea loses its value if its size is disproportionate to potential adverse scenarios. A trader is not required to predict direction perfectly, but they are obligated to control the consequences of being wrong.
Every trade must be “paid for” in advance. The potential loss must be known and psychologically accepted before entry. For one trader, an acceptable risk may be one percent of capital; for another, five percent. These figures are not universal truths — they reflect individual tolerance for uncertainty, trading style, and time horizon. What matters is not the number itself, but strict adherence to it.
For a beginner trader, an acceptable risk per trade is typically a loss of no more than one to two percent of the account. This level of risk allows the trader to endure a series of losing trades without causing critical damage to capital and, just as importantly, to psychological stability. Under these conditions, the risk-to-reward ratio should be no less than 1:2 and, in more favorable setups, should approach 1:3. This means that the potential profit of a trade should be at least twice, and preferably three times, greater than the potential loss. With such an approach, a trader maintains a positive mathematical expectancy even when a portion of trades ends in losses.
No single trade is decisive. The market is a sequence of attempts, not a single trial. Focusing on the outcome of an individual trade undermines discipline and distorts risk perception.
Refusing to exit is also a decision — and it carries risk. Holding a losing position in the hope of a reversal is not a neutral action; it is an active choice to increase uncertainty.
Periods of growth require no less caution than periods of decline. Confidence reinforced by a streak of successful trades often becomes the source of the largest losses. Growth in capital is a reason to reduce risk, not to increase it.
The best kind of risk is one that allows for error. A strategy that leaves no room for mistakes is doomed in the long run. Resilience matters more than precision.
The goal of risk management is not to eliminate losses, but to preserve the ability to continue trading. A trader wins not when losses are avoided, but when losses do not deprive them of the ability to take the next step.
This post is based on our own experiences and research we've gathered from books and various platforms.
Enjoy!

Extra tax on Cypriot bank profits As the year draws to a close, Cyprus is once again entering turbulent political territory. AKEL has revived its proposal for an extraordinary tax on bank profits, insisting that credit institutions must contribute more to the fiscal burden created by soaring inflation and rising interest rates over the past three years. The new bill covers the tax years 2025 and 2026 and introduces a solidarity levy on the portion of net interest income that has increased by more than 40% compared with 2022, taxed at a rate of 20%.
This measure—much like last year—targets Bank of Cyprus first and foremost, as the country’s largest lender and the main focus of political pressure over bank profitability. However, the implications now extend beyond a single institution. Should the proposal pass, Eurobank and Alpha Bank would also be directly affected due to their recent expansion in Cyprus through the acquisitions of Hellenic Bank and Astrobank. Although not the core targets of political scrutiny, any additional tax burden would feed into their consolidated financial results, reshaping their strategic plans in the local market.
What elevates the stakes this time is not just the substance of the tax but the political arithmetic. The same proposal was rejected last year by the narrowest of margins — 25 votes in favour, 25 against, and four abstentions. Even a minor shift in today’s balance could swing the outcome.
The environment is also significantly different for Eurobank and Alpha Bank. Their increased exposure to the Cypriot market means Cypriot taxation is no longer a peripheral consideration but a material component of group-level performance. With both banks still in the process of integrating and restructuring their new subsidiaries, an unexpected tax shock limits their investment capacity, hampers digital transformation plans, and injects uncertainty into long-term capital allocation.
AKEL argues that banks’ recent profit surge stems not from organic growth but from the windfall effects of ECB rate hikes. The party points to a European Commission report showing that similar windfall taxes in Baltic countries did not harm financial stability. Banks, however, counter that they already pay a 0.15% levy on deposits—over €500 million contributed in the last decade—and warn that further taxation could disrupt credit supply and destabilize the operating framework of a small, open economy.
As the bill heads back to Parliament, the outcome is anything but certain. A single vote could again decide whether Cyprus imposes an extraordinary levy on its banking system. If approved, Bank of Cyprus will bear the immediate burden—yet the ripple effects on Eurobank and Alpha Bank may prove equally consequential. If rejected, few doubt the debate will return, fueled by persistent social pressure and ongoing scrutiny of bank profitability.

Sub-sector Relative Performance - study.Studying the RP of sub-sectors after the "tariff crash" to see if it had any predictive power.
NASDAQ:SOXX : 80% to the top. 112% return.

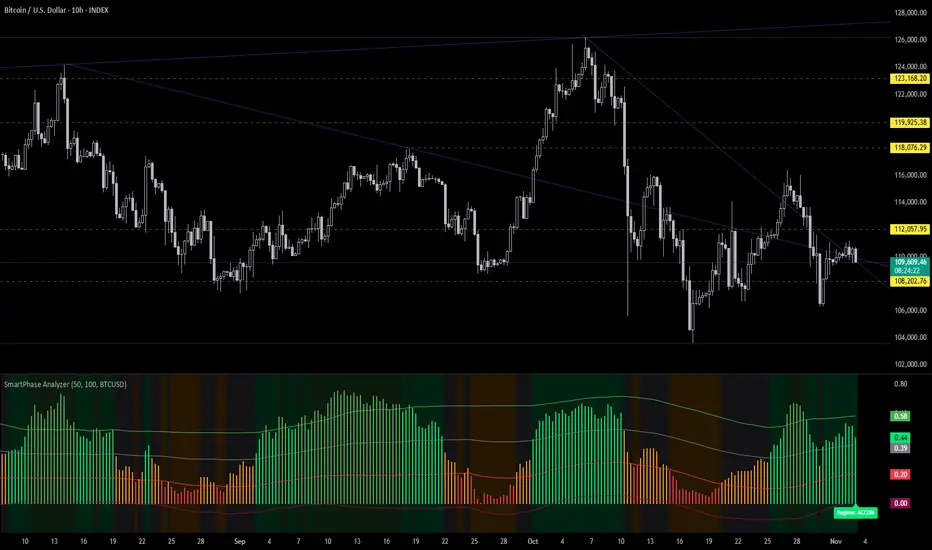
Temporal Drift Alpha | Rotating Volatility | Hidden Rhythm🧠 Deep Dive: Hidden Alpha in Odd Intraday Charts
Been experimenting lately with non-standard intraday timeframes on TradingView — specifically the 10-hour chart — and it’s producing some really interesting results.
My 1D strategies only needed minor calibration to fit intraday conditions (mainly risk and signal sensitivity tweaks), but once adjusted, they started performing significantly better on 10H than on standard 4H / 12H / 1D setups.
Here’s why I think it’s happening 👇
⚙️ 1. Uneven time alignment = session drift
10H doesn’t divide evenly into 24H, so candle start times rotate across the global trading cycle (Asia → London → NY).
That means each bar is pulling from a different combination of regional liquidity and volatility windows — you’re not seeing the same “slice” of the day over and over.
- 06:00 → overlaps Asia close + London open
- 16:00 → overlaps US open
- 20:00 → catches late NY + early Asia handoff
This rotation keeps repeating every couple of days, giving you asynchronous snapshots of how the market behaves between sessions — and that’s where inefficiencies tend to hide.
📊 2. Structural alpha exposure
By breaking away from the standard 8H / 12H / 1D alignment, you end up:
- Capturing transition volatility (session overlaps)
- Avoiding compressed daily smoothing
- Getting more responsive structure shifts for trend/momentum setups
It’s basically giving you a rotating volatility lens. You’re still seeing the full picture, but through different angles each cycle.
🧩 3. Strategy behavior differences
On the 10H:
- Momentum filters trigger cleaner — fewer false breaks
- Mean reversion signals reset faster after exhaustion
- BB, RSI, EMA-type systems react smoother, since the noise from hard session resets (like 00:00 UTC) is reduced
I’m seeing way fewer “dead zones” between signals — and overall smoother PnL curves, even with identical logic.
📈 4. Practical takeaway
Odd-hour timeframes like 10H act like a “rotating frame sampler” for the market.
They shift through liquidity regimes automatically — giving you a natural form of temporal diversification.
If your 1D systems are solid but a bit laggy or overly smoothed, try re-anchoring them on 10H, 14H, or 22H and recalibrating your risk and confirmation filters slightly.
There’s legit structural alpha buried in how these bars cut across the global cycle.
🧠 TL;DR
10H charts = not random noise.
They’re asynchronous time slices that expose unbalanced session transitions — something most backtests miss.
I’ll be running deeper tests on return bias and volatility clustering per candle start hour (06:00, 16:00, 20:00, etc.), but early signs point to repeatable behavior .
This could be one of those tiny structural edges that compounds over time.
Sometimes alpha isn’t in new indicators — it’s in how we slice time. ⏳⚡️
Griffain is looking goodGriffain is looking good, with a huge potential of 40% returns. Right now it is trading in a descending triangle. Being a low supply token, it can easily jump to the target.
Not a Financial Advice

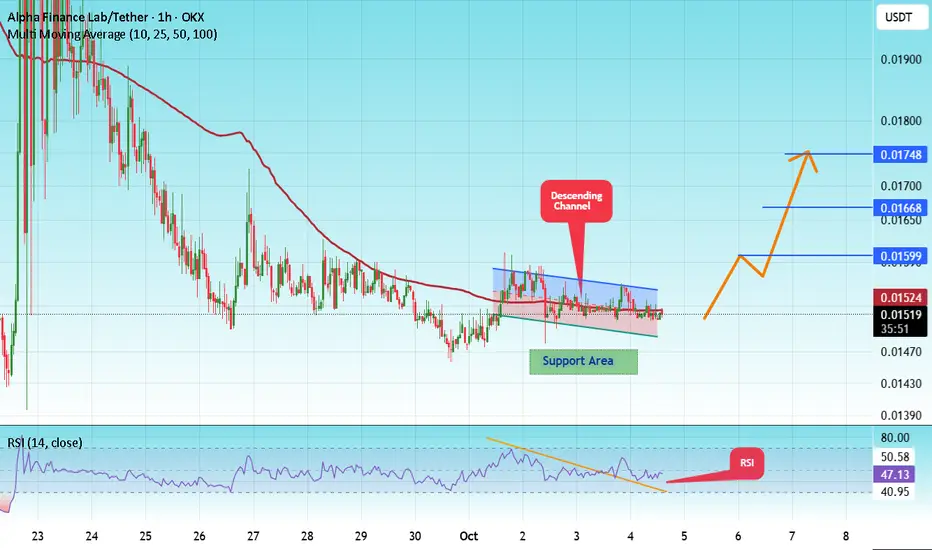
#ALPHA/USDT#ALPHA
The price is moving in a descending channel on the 1-hour frame and is expected to break and continue upward.
We have a trend to stabilize above the 100 moving average once again.
We have a downtrend on the RSI indicator that supports the upward move with a breakout.
We have a major support area in green that pushed the price higher at 0.01450.
Entry price: 0.01521.
First target: 0.01600.
Second target: 0.01668.
Third target: 0.01748.
To manage risk, don't forget stop loss and capital management.
When you reach the first target, save some profits and then change the stop order to an entry order.
For inquiries, please comment.
Thank you.
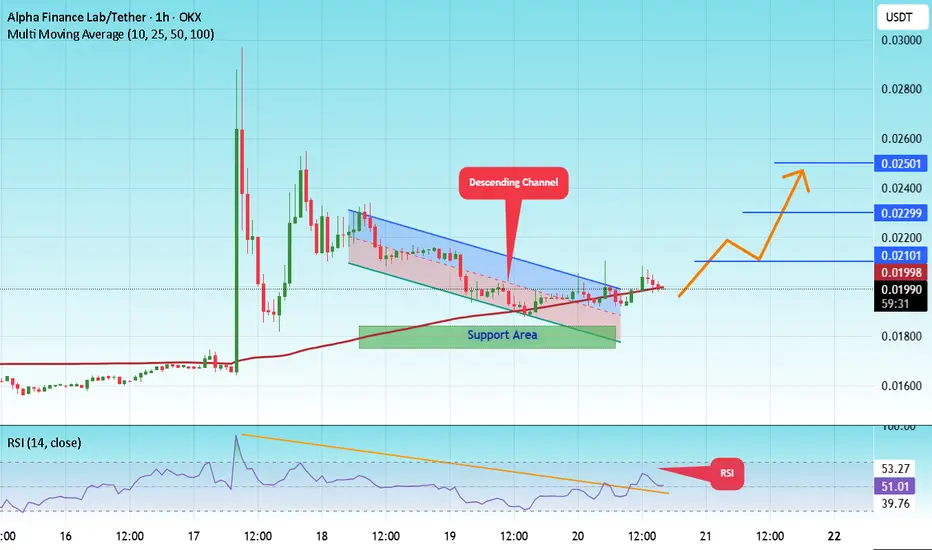
#ALPHA/USDT — The Final Battle at the Descending Trendline!#ALPHA
The price is moving in a descending channel on the 1-hour frame and is expected to break and continue upward.
We have a trend to stabilize above the 100 moving average again.
We have a downtrend on the RSI indicator that supports the upward move with a breakout.
We have a major support area in green that pushed the price higher at 0.01750.
Entry price: 0.01990.
First target: 0.02100.
Second target: 0.02300.
Third target: 0.02501.
To manage risk, don't forget stop loss and capital management.
When you reach the first target, save some profits and then change the stop order to an entry order.
For inquiries, please comment.
Thank you.
Why bother playing fair?This is a very unique instrument to trade.
The standard: professional, delta neutral market makers run the game.
Here directional takers are in control.
~2 billion USD daily volume
~3 billion market cap (15 billion fully diluted)
~3% liquidity: 1 million USD
~90% controlled supply
They have their own algorithms abusing level 3 data (stoploss/liquidation prices)
With unlimited buy/sell power, abusing god mode positions (exempt from liquidation, margin limits and requirements)
That and the super thin liquidity
Causing maximum pain on leverage traders.
There is barely any liquidity on their own books.
Market makers are not participating, exchanges are not participating.
Operating on the principle that most traders will not realize their profits
And use their liquidation price as a stop loss.
They make around 15% (!!!) of trade value per liquidation, by far the highest yield for liquidation of any exchange. (1$ price liquidation price gets filled at 0.85$)
And from my research, it seems they are handled by their own liquidators, bypassing maker orders on the books completely.
Push price into liquidations, let go, leave no liquidity for profitable positions to exit
Repeat.
The scheme is on par with FTX and LUNA.
Will it fail the same way? It could.
If it does, who will take the fall?
Their anonymous founder?
Trade with extreme caution.

Dirty Game (Keep Your Eyes Open)A no-KYC perp, launches token and allows traders (and themselves) 50x leverage directly from launch.
Peddles binary options and their own stablecoin
Let's not assume they abuse level 3 orderbook data (stops/liquidations/entry) to churn endless volume/'clearance fees'
And surely, hopefully, they don't build up unbacked debt in their system (god mode positions, FTX style)
It will likely play out okay, but this is one of those 'could explode' plays.
This one has a heavy duty handler.
Very experienced, very ruthless.
I see it playing out similarly to HYPE, but a lot more shameless.
There is no intention of playing fair.
They are not trying to convince you they are a long-term play like HYPE.
This is not just a harvest on gamblers/leverage traders, it is also a harvest on market makers.
Smart market makers will not touch this, most will play it double safe and lose, some will lose big.
ASTER PLAYBOOK:
Run price up hard and fast using, heavily leveraged seed money, while being immune to liquidations > ENTICE
Paint a cute chart > BUILD CONFIDENCE
Abuse level 3 data and god mode to harvest liquidations > ACCUMULATE STABILITY FUND
(run lows, tap highs, repeat)
Use stability funds to further run up price.
With HYPE;
the game slowed down when their risks got highlighted.
built up vultures who actively try to eat off their plate, limiting upside
has a 3x/10x max, where as this goes 50x
transparency makes it hard to be as shameless, but also attracted more capital that way
How high will it go?
It all depends on how much capital they fool into their game.
My guess, they will run it to some nice number while volatility is high (5$/10$), before slamming it 70-90% down.
Then low volatility churn for a year and try again.
None of this is financial advice.

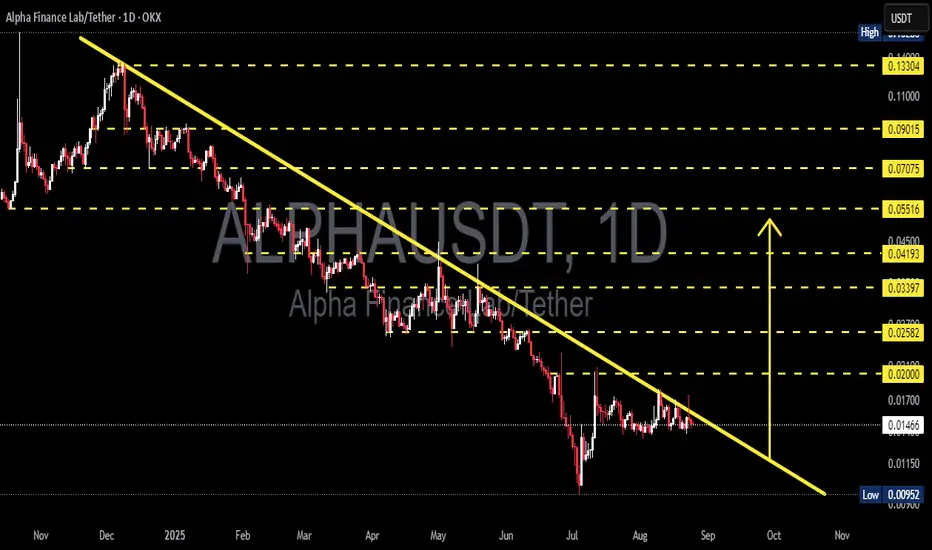
ALPHA/USDT — The Final Battle at the Descending Trendline!Full Daily Analysis
Since early 2025, ALPHA/USDT has been locked in a strong downtrend, forming a series of lower highs and lower lows along a descending trendline (yellow line). Selling pressure remains dominant, yet price action is now consolidating right below the trendline, with a tightening range that signals an explosive move ahead. The market is preparing for a major decision — breakout or rejection.
---
🔎 Structure & Price Pattern
Primary Trend: Long-term downtrend (dominant since Q1 2025).
Current Pattern: Compression zone under descending resistance — a setup often leading to a strong breakout or breakdown.
Nearest Support: 0.00952 (key low).
First Resistance: 0.02000 (psychological + structural level).
Key Levels Above: 0.02582 → 0.03397 → 0.04193 → 0.05516 → 0.07075 → 0.09015.
---
🚀 Bullish Scenario
If price successfully breaks out and closes a daily candle above the trendline (~0.016–0.017):
1. First confirmation: strong bullish daily close + rising volume.
2. Initial Target: 0.02000.
3. Next targets: 0.02582 → 0.03397 → 0.04193.
4. Mid-term potential: 0.05516 up to 0.07075 (+380% from current price).
5. Indicator signals: RSI >50, daily MACD bullish crossover.
📌 Note: A breakout retest of the trendline as support often provides a safer swing entry.
---
🔻 Bearish Scenario
If price fails at the trendline and faces strong rejection:
1. Downside path: revisit minor support 0.012–0.011.
2. Main target: 0.00952 (key chart low).
3. If 0.00952 breaks, further downside to new lows (check weekly chart for deeper historical levels).
4. Bearish confirmation: strong rejection candles + rising selling volume + RSI below 50.
---
🎯 Key Takeaways & Trading Strategy
ALPHA/USDT is approaching a decisive moment.
Breakout above the trendline → potential trend reversal toward 0.02–0.02582.
Rejection from the trendline → continuation of the bearish cycle toward 0.00952.
Aggressive traders: may scale in right after breakout confirmation with tight stops.
Conservative traders: wait for daily close + retest before positioning.
Risk management: never risk more than 1–3% per trade. Fakeouts are common in crypto — patience and discipline are key.
---
“ALPHA/USDT has been trapped under a heavy downtrend for months. Now price is consolidating just below the descending trendline — the decisive move is coming soon. Will ALPHA break out into a new bullish phase, or will bears push it back to the 0.0095 low?
Wait for daily close confirmation before making moves. Remember: in every opportunity lies risk, and proper risk management is your best weapon.”
#ALPHA #ALPHAUSDT #Crypto #Altcoin #TechnicalAnalysis #Breakout #Bullish #Bearish #CryptoTrading #SwingTrade #RiskManagement
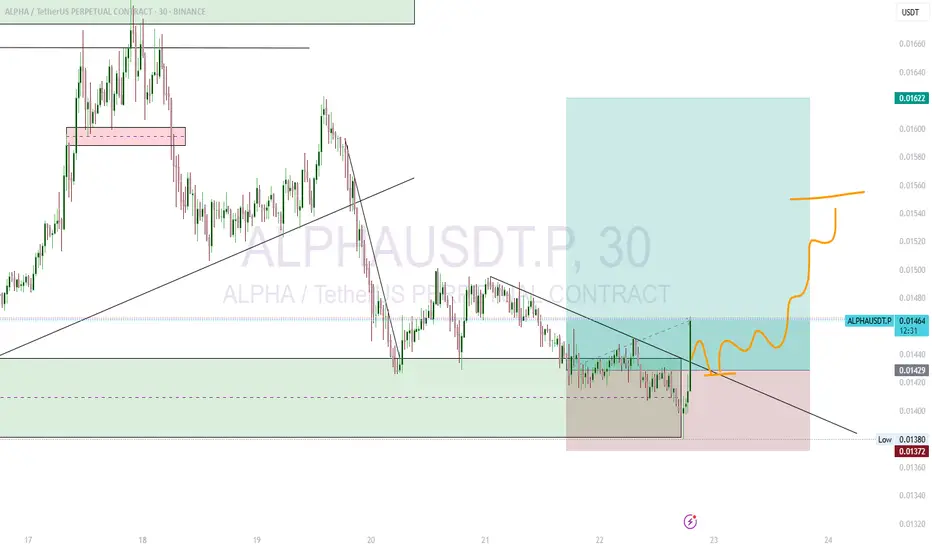
Alpha USDT AnalysisAfter the recent INDEX:BTCUSD Bitcoin (BTC) short dump, some altcoins are starting to show strength and are breaking out. We might see a small correction before the altcoin season officially begins.
Chart Analysis for BINANCE:ALPHAUSDT.P ALPHA/USDT:
Breakout: The chart shows a potential breakout above a downward-sloping trendline.
Correction: The orange line illustrates a potential path, suggesting a small correction or retest of the breakout level before a significant upward move.
Target Price: The potential target for this move is around the $0.01622 level.
Stop-Loss: A stop-loss is placed at $0.01372 to manage risk.
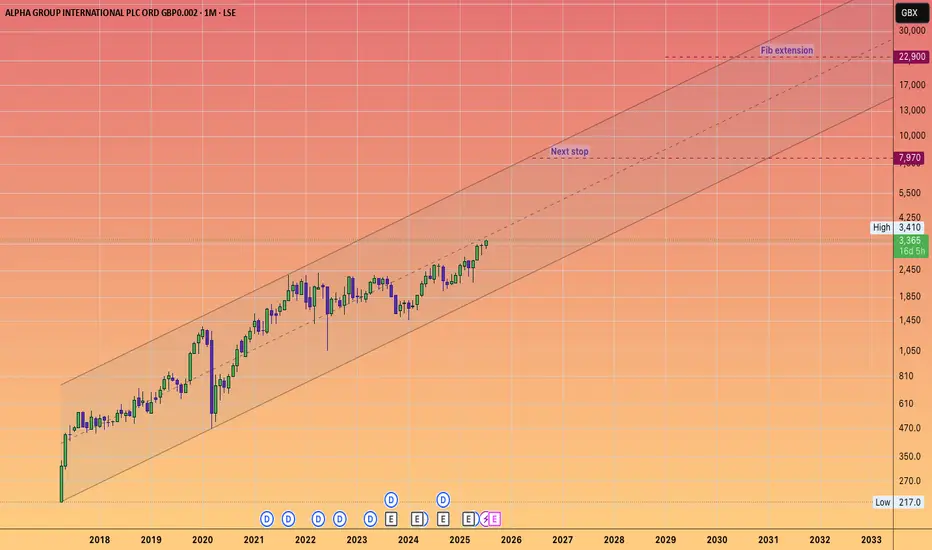
ALPHA GROUP INTERNATIONAL will keep its momentum going!#ALPHA is a fintech company that offers currency risk management and payment solutions.
With a price-to-earnings ratio of approximately 12,
it signifies a solid investment for a growth-oriented fintech firm that is increasing its earnings by about 20 to 25% annually.
In light of the #UKX breaking through and reaching new highs, and beginning to accelerate towards my long-standing projections that the FTSE would hit 5 figures, ALPHA appears to be a unique opportunity in the UK markets, which, as we know, are relatively sparse compared to the USA.
Given the inability to purchase shares of #Revolut, it is likely that capital will flow into this ticker.
#ALPHA /USDT breakdown alert#ALPHA
The price is moving within a descending channel on the 1-hour frame and is expected to break and continue upward.
We have a trend to stabilize above the 100 moving average once again.
We have a downtrend on the RSI indicator that supports the upward break.
We have a support area at the lower limit of the channel at 0.01111, acting as strong support from which the price can rebound.
Entry price: 0.01156.
First target: 0.01288.
Second target: 0.01400.
Third target: 0.01512.
To manage risk, don't forget stop loss and capital management.
When you reach the first target, save some profits and then change the stop order to an entry order.
For inquiries, please comment.
Thank you.

ALPHAUSDT 1D Analyss ALPHA ~ 1D Analysis
#ALPHA Buy after successfully breaking through this resistance line with a short-term target of at least 15%++.

ALPHAUSDT | Sellers in Control—Key Resistance Levels DefinedALPHAUSDT shows a brief uptick, but the underlying strength remains with sellers. Buyers have yet to demonstrate sustained conviction, and this suggests any rally may be engineered rather than genuine.
🔴 Manipulation Target: Red Line
A slight advance today appears aimed at the area marked by the red line, where liquidity may be swept before a reversal. This level serves as a likely pivot for engineered moves designed to trap uninformed participants.
🔴 Core Resistance: Red Box
Beyond the red line, the red box identifies the primary seller domain. Price has stalled here repeatedly, confirming that sellers guard this zone aggressively. Until ALPHAUSDT clears the red box on substantial volume and with clear low‑time‑frame breakouts, the bearish bias remains intact.
📉 How to Trade This Setup
Short Entries
• Look for price to approach the red line and fail to hold—this often precedes a stronger reversal into the red box.
• Confirm with a clean breakdown on lower time frames and a negative divergence in CDV to validate seller dominance.
Risk Management
• Place stops just above the red box or red line, depending on your preferred trigger, to cap potential losses.
Stay Patient
• If price unexpectedly breaks above these levels with convincing volume and retests as support, only then will I reconsider the bearish view.
By focusing on where genuine selling pressure resides, and waiting for real confirmations, you avoid getting caught in manipulative spikes and trade with confidence.
📌I keep my charts clean and simple because I believe clarity leads to better decisions.
📌My approach is built on years of experience and a solid track record. I don’t claim to know it all but I’m confident in my ability to spot high-probability setups.
📌If you would like to learn how to use the heatmap, cumulative volume delta and volume footprint techniques that I use below to determine very accurate demand regions, you can send me a private message. I help anyone who wants it completely free of charge.
🔑I have a long list of my proven technique below:
🎯 ZENUSDT.P: Patience & Profitability | %230 Reaction from the Sniper Entry
🐶 DOGEUSDT.P: Next Move
🎨 RENDERUSDT.P: Opportunity of the Month
💎 ETHUSDT.P: Where to Retrace
🟢 BNBUSDT.P: Potential Surge
📊 BTC Dominance: Reaction Zone
🌊 WAVESUSDT.P: Demand Zone Potential
🟣 UNIUSDT.P: Long-Term Trade
🔵 XRPUSDT.P: Entry Zones
🔗 LINKUSDT.P: Follow The River
📈 BTCUSDT.P: Two Key Demand Zones
🟩 POLUSDT: Bullish Momentum
🌟 PENDLEUSDT.P: Where Opportunity Meets Precision
🔥 BTCUSDT.P: Liquidation of Highly Leveraged Longs
🌊 SOLUSDT.P: SOL's Dip - Your Opportunity
🐸 1000PEPEUSDT.P: Prime Bounce Zone Unlocked
🚀 ETHUSDT.P: Set to Explode - Don't Miss This Game Changer
🤖 IQUSDT: Smart Plan
⚡️ PONDUSDT: A Trade Not Taken Is Better Than a Losing One
💼 STMXUSDT: 2 Buying Areas
🐢 TURBOUSDT: Buy Zones and Buyer Presence
🌍 ICPUSDT.P: Massive Upside Potential | Check the Trade Update For Seeing Results
🟠 IDEXUSDT: Spot Buy Area | %26 Profit if You Trade with MSB
📌 USUALUSDT: Buyers Are Active + %70 Profit in Total
🌟 FORTHUSDT: Sniper Entry +%26 Reaction
🐳 QKCUSDT: Sniper Entry +%57 Reaction
📊 BTC.D: Retest of Key Area Highly Likely
📊 XNOUSDT %80 Reaction with a Simple Blue Box!
📊 BELUSDT Amazing %120 Reaction!
📊 Simple Red Box, Extraordinary Results
I stopped adding to the list because it's kinda tiring to add 5-10 charts in every move but you can check my profile and see that it goes on..

Stella (Alpha) Starts to Recover From True-BottomLet's start with the linear chart.
ALPHAUSDT is trading at bottom prices and here we can appreciate two sessions recently with really high volume. When the bottom is getting close, we tend to see whale accumulation happening.
The second high volume session came in 28-April.
The session that produced the correction bottom was the week of 5-May. Now ALPHAUSDT is turning green.
The orthodox end of the bear market happened June 2022 and the ensuing action is the same consolidation pattern we've been seeing through many charts. The difference is that here we have lower lows. Some produce higher lows others lower lows, still, it is the same market phase. A transition period from neutral to bullish. Look at the linear chart again and you can see the action being 100% flat.
Now, once we hit bottom, there is no other place left to go but up.
» ALPHAUSDT already hit bottom just two weeks ago; it is getting ready to grow. Long-term growth. This is an easy buy and hold.
Namaste.

Alpha Bank Shows Impressive Performance Alpha Bank Shows Impressive Performance in the First Nine Months of 2024, with Positive Indicators Boosting Investor Confidence and Paving the Way for Upgraded Forecasts for the Rest of the Year.
Alpha Bank reported adjusted net profits of €666 million, showing a 16% annual increase, while net profits reached €489 million. The impressive increase in earnings per share to €0.27 highlights the bank's profitability, with a return on equity of 14.4%.
Net interest income showed a 2% annual increase, while fee income saw an impressive rise of 11%, reaching €306 million. This growth in fee income reflects the bank’s success in diversifying its revenue streams and expanding into payment and wealth management services.
The non-performing exposure (NPE) ratio stands at a low 4.6%, underscoring the resilience of the bank’s portfolio and prudent risk management. Meanwhile, the cost of risk has been significantly reduced to 63 basis points, contributing to the improvement in the bank’s asset quality.
The increase in loans by 8% and deposits by 10% reflects strong customer confidence and the continuous strengthening of the bank’s portfolio. Alpha Bank seems to be adapting exceptionally well to the increased market needs, especially in the business loan segment.
The bank’s balance sheet is well-structured to withstand interest rate reductions, with strong capital adequacy and a proper asset allocation. This provides stability and protection against potential market fluctuations, with minimal impact on net interest income.
The increased demand for business loans is reflected in a 67% rise in corporate loans since 2018, with Alpha Bank outperforming the sector average in loan growth. The positive trend in loan demand is expected to continue, offering further growth opportunities.
Alpha Bank holds a leading position in wealth management, with the largest mutual funds under management in Greece. The expected increase in fee income by 2026, particularly in the payments and wealth management sectors, supports the bank's strategy for revenue diversification.
The bank is on track for further growth in earnings per share, with an expected return reaching €0.35 by 2026, thanks to continuous improvements in operational efficiency and strong financial performance.
Alpha Bank’s capital adequacy is higher than the average of Greek banks, with a CET1 ratio of 15.5%, while over 30% of its market cap is expected to be distributed as dividends by 2026. This strong capital base enables management to reward shareholders while maintaining sufficient capital reserves.
Detailed Financial Data of Alpha Bank for the First Nine Months of 2024
Net Interest Income
Net interest income amounted to €1.243 billion for the first nine months of 2024, showing an annual increase of 2%. Despite stable interest income in recent quarters (€410 million in Q3 2024), the bank manages to maintain a steady income in its core area.
Fee Income
Fee income reached €306 million, up 11% compared to the same period in 2023. This increase confirms the effectiveness of the bank’s strategies to diversify its revenue sources, primarily through payment services and wealth management.
Trading and Other Income
Trading and other income saw an impressive 81% increase, reaching €95 million. This reflects the bank’s success in seizing opportunities in the markets and other investment activities.
Operating Income and Expenses
Operating income for the first nine months of 2024 amounted to €1.643 billion, up 6% compared to the previous year.
Total operating expenses remained steady at €627 million, with no change, indicating successful cost management despite increased activity. The combination of revenue growth and expense stability demonstrates the bank’s improved efficiency.
Pre-Provision Income
Pre-provision income increased by 11%, reaching €1.016 billion. This increase is particularly significant as it strengthens the bank’s resilience to potential risks and lays the groundwork for healthy growth.
Impairment Losses
Impairment losses decreased by 20%, amounting to €173 million. This reduction is very positive, reflecting the improvement in the bank’s portfolio quality and reduced need for provisions against bad loans.
Profit Before Tax
Profit before tax amounted to €838 million, marking a significant increase of 18% compared to the same period last year. This increase reflects the positive impact of cost management and increased revenues.
Net Profit After Tax
Net profit after tax amounted to €489 million, showing a slight decrease of 2% compared to 2023. Although this decrease might seem negative, it is offset by the increase in adjusted net profits.
Adjusted Net Profit After Tax
Adjusted net profit after tax increased by 16%, reaching €666 million. This increase reflects the bank's strong financial performance and positive results without the impact of extraordinary expenses or other adjustments.
Alpha Bank Shares Show Several Positive Indicators According to Analysts:
Undervalued Market Price: Alpha Bank shares are trading at levels significantly below their estimated fair value, with a 55.5% discount. This means it offers substantial value for investors seeking to benefit from its potential future appreciation.
Earnings Growth Forecast: Alpha Bank’s earnings are forecasted to grow at an annual rate of 18.2%, significantly exceeding both the market average and savings rates. Additionally, historical data show a 25.5% annual growth in earnings over the past five years.
Analysts’ Consensus for an Upward Trend: Analysts are optimistic and agree that Alpha Bank’s stock price will rise by around 49.2% over the next year. This reflects market confidence in the company’s potential.
Valuation Based on Price-to-Book Ratio (PB): The price-to-book ratio for Alpha Bank shares is at 0.5x, indicating that the market values the stock at a very low level compared to its net book value. This suggests the stock could be a good buying opportunity relative to its sector.
Strong Financial Health: Alpha Bank shows adequate deposit levels and healthy loan levels, with an appropriate loan-to-deposit ratio of 70%. Although non-performing loans are at 3.8%, this percentage is not high enough to pose a risk, and the company has sufficient provisions for bad loans.
Expected Revenue Growth: Although the forecasted annual revenue growth is 7.9%, this rate is positive for the company’s growth prospects, surpassing the market forecast (5.1%).
Technical Analysis
The technical analysis of Alpha Bank’s stock shows a strong upward trend, supported by various indicators and support and resistance levels.
Moving Averages (EMA)
The Exponential Moving Averages (EMAs) for 20, 50, 100, and 200 periods indicate an upward trend, with the stock trading above all these levels, signaling strong bullish momentum.
Relative Strength Index (RSI)
The RSI is at 80.72, indicating that the stock is in the overbought zone. While this suggests high demand and bullish momentum, it also poses a risk for a possible correction.
MACD (Moving Average Convergence Divergence)
The MACD line (0.0359) is above the signal line (0.0278), indicating an upward trend. The positive value of the Histogram (0.0081) further reinforces the bullish trend.
Trading Volume
Volume is on an upward trend, with a total volume of 1.777 million. The increase in volume supports the upward movement, as it indicates growing investor interest in buying the stock.
Fibonacci Levels
The Fibonacci levels confirm support and resistance points:
0.618 level at 1.4680 serves as support.
Level 1 at 1.4960 also acts as a significant support level.
Support and Resistance Levels
R1 (Resistance 1): 1.5495, which has been exceeded, with the current stock price slightly above this level.
R2 (Resistance 2): 1.5795, which could act as a point of slowing the upward trend.
S1 (Support 1): 1.4275, providing fundamental support in case of a correction.

ALPHA Structure Analysis - 50-day EMA breakoutYesterday, BINANCE:ALPHAUSDT cleanly broke and closed above the 50-day EMA, which it hadn't been able to reclaim since December 2024. It also retested the previous $0.042-$0.052 demand zone, which acted as resistance.
Check the weekly chart below for more context:
Key Levels
• $0.024-$0.034: Main demand zone, dating back to October 2020
• $0.042-$0.052: Previous demand zone and current resistance
• ~$0.070: Previous key S/R, currently reinforced by 1-year EMA, and potential resistance
• $0.115-$0.137: Main supply zone
Trigger
I am looking for a retest of the 50-day EMA (~0.035) as support for a long entry, with a clear invalidation below the recent $0.025 swing low, targeting the main supply zone with the other key levels outlined above as partial TP targets.

ALPHA is Ready To Fly (8H)ALPHA has encountered a key zone filled with strong buy orders.
The volume of these orders appears sufficient to potentially pump ALPHA to higher levels.
On the chart, we also have bullish confirmations, such as the formation of a CH (Change of Character) and the breakout of the trigger line.
As long as the green zone holds, ALPHA can move toward the target profit (TP) levels marked on the chart.
However, a daily candle closing below the invalidation level would invalidate this analysis.
Do not enter the position without capital management and stop setting
Comment if you have any questions
thank you

#ALPHA/USDT#ALPHA
The price is moving within a descending channel on the 1-hour frame, adhering well to it, and is heading for a strong breakout and retest.
We are seeing a bounce from the lower boundary of the descending channel, which is support at 0.0293.
We have a downtrend on the RSI indicator that is about to be broken and retested, supporting the upward trend.
We are looking for stability above the 100 moving average.
Entry price: 0.0300
First target: 0.0306
Second target: 0.0314
Third target: 0.0323

ALPHA Is Ready To Fly (8H)ALPHA has encountered a key zone filled with strong buy orders.
The volume of these orders appears sufficient to potentially pump ALPHA to higher levels.
On the chart, we also have bullish confirmations, such as the formation of a CH (Change of Character) and the breakout of the trigger line.
As long as the green zone holds, ALPHA can move toward the target profit (TP) levels marked on the chart.
However, a daily candle closing below the invalidation level would invalidate this analysis.
Do not enter the position without capital management and stop setting
Comment if you have any questions
thank you
