Alphabet - This stock is reversing now!🔪Alphabet ( NASDAQ:GOOG ) is reversing very soon:
🔎Analysis summary:
Alphabet created a textbook all time high break and retest back in mid 2025. The recent rally has therefore been totally expected. But now, Alphabet is totally overextended, retesting a major resistance trendline and about to also create bearish confirmation.
📝Levels to watch:
$300
SwingTraderPhil
SwingTrading.Simplified. | Investing.Simplified. | #LONGTERMVISION
Alphabetanalysis

Alphabet - The exceptional short setup!🔒Alphabet ( NASDAQ:GOOG ) is reversing right now:
🔎Analysis summary:
Alphabet is clearly indicating a major bearish move. With the current retest of major resistance, Alphabet is slowly reversing. Since Alphabet is also massively overextended, really everything is pointing towards a move lower. Just give it a couple of days to reverse.
📝Levels to watch:
$300
SwingTraderPhil
SwingTrading.Simplified. | Investing.Simplified. | #LONGTERMVISION

Just In: Alphabet Inc. (NASDAQ: GOOG) Surging in Early PremarketShares of Alphabet Inc. (NASDAQ: NASDAQ:GOOG ) is experiencing a notable uptick of 0.63% in early market trading on Monday albeit market condition. The asset last close trading session was up 1.67% on Friday.
In recent news, A Spanish consumer rights association on Friday said it had launched preliminary legal action against Google for allegedly collecting sensitive personal data and violating their right to privacy.
The Association of Communication Users (AUC) says the US tech giant collected data about users' personal opinions, religion, sexuality and health through applications and the Android operating system, supporting their claim with a study by a Dublin-based university professor.
"Technology and the desire to provide a service have taken precedence over putting in place safeguards to protect people's privacy," AUC secretary general Bernardo Hernandez told AFP.
"The issue of privacy is extremely scandalous because not even the bare minimum is protected," he added, saying Google could have provided the same services without unnecessarily collecting "an excessive amount of data."
Analyst Summary
According to 44 analysts, the average rating for GOOG stock is "Strong Buy." The 12-month stock price target is $307.02, which is a decrease of -0.52% from the latest price.
Important Dates
The next estimated earnings date is Tuesday, February 3, 2026, after market close. The stock price has increased by +62.30% in the last 52 weeks.

Alphabet - This rally will soon be over!🪦Alphabet ( NASDAQ:GOOG ) will end its rally soon:
🔎Analysis summary:
Starting back in 2025, Alphabet created a major bullish break and retest. Following this behavior, we witnessed an expected strong rally of about +120%. But with the current retest of the upper resistance trendline, Alphabet will soon create a healthy retracement.
📝Levels to watch:
$300
SwingTraderPhil
SwingTrading.Simplified. | Investing.Simplified. | #LONGTERMVISION

Alphabet (NASDAQ: $GOOGL) Stock: 2025 Continues BullishAlphabet’s stock continues its remarkable performance in 2025, surging nearly 70% year-to-date as strong fundamentals and aggressive AI expansion fuel investor confidence. Much of the momentum comes from Alphabet’s rapidly growing cloud division and the continued rollout of Gemini, its advanced AI model powering enterprise workloads, search upgrades, and next-generation productivity tools. This expansion has pushed Alphabet’s market valuation close to $4 trillion, establishing it as one of the fastest-growing mega-caps this year.
Another major catalyst is Google’s deepening presence in India’s digital infrastructure. The Adani Group recently announced a $5 billion co-investment with Google to build a large-scale data center aimed at supporting India’s rising cloud, AI, and storage needs. This move comes shortly after Google committed $15 billion to an AI-focused data center cluster in Andhra Pradesh. Together, these investments reinforce Alphabet’s expanding footprint across one of the world’s fastest-growing markets and strengthen long-term revenue prospects.
From a technical standpoint, GOOGL remains strongly bullish after breaking above a long-held ascending trendline that acted as multi-year resistance. The breakout triggered a sharp rally, pushing the stock to the current price around $320. Momentum indicators show extreme strength, with the MACD at record highs and RSI firmly overbought—signals that suggest the uptrend remains intact but may face volatility.
The next psychological resistance sits at $350, a level traders will watch closely. On the downside, immediate support lies at $291, followed by a stronger structural zone at $255. As long as price stays above the former trendline and these supports, the broader bullish structure remains dominant.

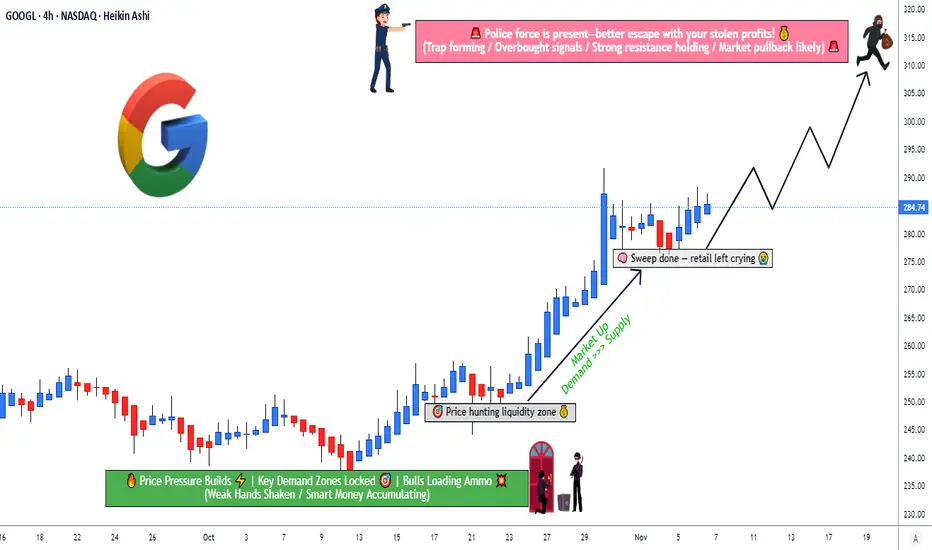
Can GOOGL Sustain Its Bullish Run Before 320 Resistance Hits?🎯 GOOGL HEIST: Operation Alphabet Escape Plan 💰
Alphabet Inc. (NASDAQ) - Swing Trade | Multi-Layer Entry Strategy
📊 THE SETUP
Sentiment: 🟢 BULLISH | Timeframe: Swing Trade | Risk Level: Medium
🎲 ENTRY STRATEGY: "THIEF LAYERING"
Strategic multi-level buy accumulation using limit orders
Layer-by-Layer Approach:
🔵 Layer 1: $270.00 (Initial entry - 30% position)
🔵 Layer 2: $275.00 (Support zone - 35% position)
🔵 Layer 3: $280.00 (Strength builder - 35% position)
Why This Works? Multiple entries reduce average cost basis and allow maximum capital efficiency. If price rejects higher, you've got fills at lower zones. If it pumps, you're already in! 💡
🛑 STOP LOSS PROTECTION
Hard Stop: 🚨 $265.00 (Below support structure)
This represents a 1.9% risk from Layer 1 entry — disciplined risk management at its finest.
⚠️ Risk Acknowledgment: Your stop loss, your rules. We're traders, not financial advisors. Adjust based on YOUR risk tolerance and account size. This is educational strategy sharing, not personalized financial advice.
🎖️ PROFIT TARGETS & ESCAPE ROUTES
Primary Target: 📈 $310.00
Strong resistance zone forming
Overbought conditions developing
Action: Take 50-60% profits here
Secondary Target: 🏆 $320.00
Police barricade zone (extreme resistance)
High trap probability at this level
Action: Scale out remaining 40-50% OR tighten stops to breakeven
Exit Philosophy: Greed kills traders. Take profits systematically. The best trade is one where you sleep well at night. 😴
⚠️ Profit Note: Your targets, your timing. Scale exits based on market conditions, volume confirmation, and YOUR comfort level.
🔗 RELATED PAIRS TO MONITOR (Correlation Watch)
🔵 NASDAQ:MSFT 📱 — High Correlation (Tech Sector) | If MSFT breaks down, GOOGL faces sector headwinds. Watch for divergence signals here first.
🔵 NASDAQ:QQQ 🔺 — 0.85+ Correlation (Nasdaq-100) | QQQ weakness = potential GOOGL pullback signal. This is your sector health check before entry.
🔵 AMEX:IWM 📊 — Inverse Correlation (Rotation Risk) | Russell 2000 strength = growth money leaving mega-caps. If small-caps pump, tech might cool off.
🔵 NASDAQ:TLT 💳 — Interest Rate Proxy | Rising bonds = tech pressure; falling bonds = tech friendly. Fed policy flows directly through here.
🔵 TVC:VIX 😰 — Volatility Index | VIX spike = risk-off, potential GOOGL liquidation. Above 20 = reduce position exposure.
Key Insight: Watch QQQ and MSFT first. They're your canary in the coal mine. If sector is weak, reconsider your entry conviction. 🚨
💎 STRATEGY SUMMARY
✅ Bullish bias with disciplined multi-entry accumulation
✅ Defined risk with hard stop at $265
✅ Staged profit-taking to lock gains systematically
✅ Correlation awareness prevents surprise sector rotations
🎬 FINAL THOUGHTS
Remember: This is the Thief Strategy™ — a fun, educational framework for swing trading, NOT financial advice. Trade at your own risk. Position sizing, stop losses, and profit targets should reflect YOUR unique situation, risk tolerance, and account size.
The heist only works if you ESCAPE with profits. Don't get caught holding the bag! 💼🚪
✨ If you find value in my analysis, a 👍 and 🚀 boost is much appreciated — it helps me share more setups with the community!
#GOOGL #AlphabetInc #SwingTrade #TechAnalysis #TradingStrategy #NASDAQ #TradingIdeas #MultiLayers #RiskManagement #Bullish #ThiefStrategy #TradingCommunity #TradingView #Technical #StockMarket
Alphabet Momentum Surges as Berkshire’s Bet $5 billion stakeAlphabet Inc. (NASDAQ: NASDAQ:GOOG ) closed at $299.65 on Friday and briefly pushed above $302 in after-hours trading, extending its strong 2025 rally. The momentum accelerated after Berkshire Hathaway revealed a new $5 billion stake, making Alphabet one of its largest U.S. holdings. The move reinforces investor conviction in Alphabet’s long-term AI roadmap, especially as capital expenditures surge.
Alphabet’s Q3 earnings on Oct. 29 highlighted the company’s powerful growth engine. Revenue rose 16% year over year to $102.3 billion, while net income increased 33% to $35 billion. EPS jumped 35% to $2.87 as operating efficiency improved across Google Services and Cloud.
Google Cloud delivered another breakthrough quarter, generating 34% growth and $15.2 billion in revenue. The segment continues to benefit from rising AI workloads and enterprise adoption. YouTube and Search also outperformed, driving strong ad-based revenue expansion.
Capital expenditures remain a key theme. Alphabet raised its 2025 CAPEX outlook twice, now guiding for $91–$93 billion, driven by AI chips, new data centers, and expanded compute clusters. Despite heavy investment, free cash flow remains exceptionally strong at $73.6B over the last 12 months.
Berkshire’s Vote of Confidence
Berkshire’s acquisition of 17.9 million GOOG shares signals deep belief in Alphabet’s AI dominance and multi-segment strength. With nearly $100B in cash and consistent double-digit revenue growth, Alphabet remains one of the most financially resilient companies in big tech.
Technical Outlook
NASDAQ:GOOG has been strongly bullish since the April low at $140. The stock also broke through an ascending-trendline resistance in August and continues to climb toward new all-time highs. As long as price stays above this breakout zone, bullish continuation remains likely.

Google Stock (NASDAQ: $GOOGL) Rises on Nano Banana Pro UpdateGoogle parent Alphabet (NASDAQ: NASDAQ:GOOGL ) introduced Nano Banana Pro, an upgraded version of its AI image-editing and generation platform powered by Gemini 3 Pro. The update improves text legibility inside AI-created images—one of the most persistent challenges for image models—and integrates deeper reasoning features from Gemini 3, enabling more consistent output and broader creative control.
The tool will also be available across Google Search’s AI Mode, the Gemini API, Google Ads, and Flow, the company’s filmmaking platform. Free-tier Gemini users will receive limited access quotas, a move designed to increase usage while showcasing the improved capabilities.
The launch comes just days after Google unveiled Gemini 3, a major release aimed at closing competitive gaps with OpenAI. According to The Wall Street Journal, the earlier launch of Nano Banana in August significantly accelerated user growth and retention, making this enhanced version a strategic release. While ChatGPT still leads in usage, Google’s rapid iteration suggests a strong push toward regaining market share across creative and enterprise AI applications.
Technical Analysis:
Alphabet shares have been bullish overall, recently breaking above a long-respected trendline to the upside. This breakout confirms ongoing upward momentum supported by improving AI fundamentals, rising cloud demand, and investor optimism around new product rollouts.
The stock did pull back on Friday following the Nano Banana Pro announcement, but the technical structure remains intact. The trendline breakout continues to act as a strong foundational level, and buyers may re-enter if price revisits that zone. A sustained hold above recent highs opens room toward the next major target region, while failure to reclaim momentum could trigger a short-term retest before continuation.
Overall, Google’s AI expansion supports the broader bullish bias, with fundamentals and technicals aligning for potential upside continuation.

Alphabet’s to Invest $6 Billion in Germany as Stock Eyes $300Alphabet Inc. (NASDAQ: GOOGL) surged to new highs this week as reports surfaced that Google plans to invest approximately €5 billion ($5.8 billion) in Germany to expand its data center and infrastructure footprint. According to sources cited by Reuters, the plan includes the construction of a new data center in Dietzenbach, near Frankfurt, and the expansion of an existing facility in Hanau. Both projects reinforce Google’s growing commitment to Europe’s largest economy and its long-term push toward artificial intelligence and climate-neutral innovation.
The investment marks one of Google’s most significant in Europe, aligning with its broader strategy to enhance data processing power and sustainability. A press conference is scheduled for Tuesday, where German Finance Minister Lars Klingbeil is expected to provide additional details. Analysts view this expansion as a strong signal of confidence in Europe’s digital economy and AI-driven transformation.
On the technical front, Google’s stock has been on a powerful uptrend, recently reaching around $290 after breaking through long-term resistance. The bullish momentum shows little sign of slowing, with traders eyeing the key psychological level of $300 as the next major target.
Volume and trend structure remain supportive, with an ascending trendline acting as a potential area of support in case of a retracement. A bounce from that region could further fuel continuation toward fresh record highs.
With strong fundamentals backed by a major European investment and a bullish technical setup, Google appears poised to extend its rally. Investors will be watching whether this momentum can push GOOGL beyond $300, a move that could signal the next chapter of growth for one of the world’s leading tech giants.

Is This the Perfect Entry Zone for the Next GOOGL Upside Run?🎯 GOOGL: The "Thief's Heist" Trading Strategy | Layered Entry Playbook 📊
💼 Asset: ALPHABET INC. (GOOGL)
Market: NASDAQ | Style: Swing/Day Trade Hybrid
🎭 The Setup: Bulls Running the Show
Bias: 🟢 BULLISH
Listen up, trading family! 👋 GOOGL is setting up what I call the "Thief's Entry Strategy" - a layered approach that lets you accumulate positions like a professional poker player stacking chips. No FOMO, no chasing - just calculated, methodical entries that would make Ocean's Eleven jealous. 🎰
🚪 Entry Strategy: The "Thief Layering" Method
Instead of going all-in at one price (rookie move 🙅♂️), we're using multiple limit orders to build our position:
📍 Layered Buy Limits:
Layer 1: $240.00
Layer 2: $245.00
Layer 3: $250.00
💡 Pro Tip: You can add more layers or adjust levels based on your risk appetite and account size. This method reduces average cost and minimizes timing risk - basically, you're stealing better prices while everyone else panic-buys at the top! 😎
Alternative: If you prefer simplicity, current market price entry works too - but where's the fun in that? 🤷♂️
🛡️ Risk Management: The "Escape Route"
Stop Loss: $235.00
⚠️ Reality Check: Dear Thief OG's (Original Gangsters of Trading), this is MY stop loss level based on technical structure. YOU need to assess your own risk tolerance, position size, and account management rules. Your money = your rules. Trade at your own risk, always! 🎲
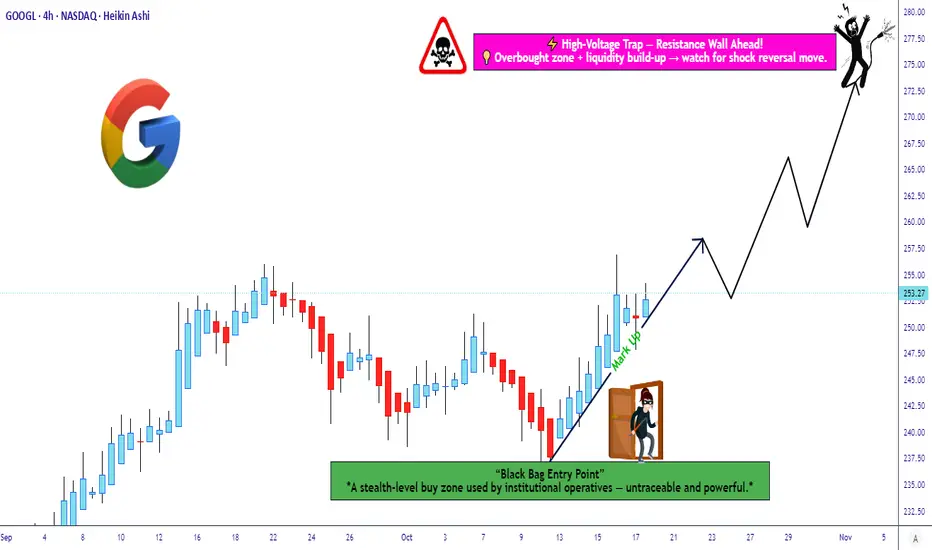
🎯 Target Zone: The "Electric Fence"
Take Profit: $275.00
This level represents a confluence of:
⚡ Strong resistance zone (high voltage wall!)
📈 Potential overbought conditions
Bull trap territory where late buyers get caught
Strategy: Scale out as we approach target. Don't be greedy - banks get robbed, but smart thieves get away clean! 💰
⚠️ Reality Check #2: This is MY target. You might want to take profits earlier, hold for more, or scale out in portions. Your trading plan, your decision. Secure the bag at your own discretion! 💼
🔗 Related Pairs to Watch (Correlation Play)
Keep your eyes on these tech titans - they often move in sympathy:
NASDAQ:MSFT - Microsoft Corp | Big tech correlation, AI play
NASDAQ:AAPL - Apple Inc. | FAANG/tech sector leader
NASDAQ:META - Meta Platforms | Ad revenue correlation with GOOGL
NASDAQ:NVDA - NVIDIA | AI infrastructure play
NASDAQ:QQQ - Nasdaq 100 ETF | Overall tech sector health indicator
Why it matters: If these pairs show weakness, GOOGL might follow. If they're pumping, wind's at our back! 🌊
📊 Key Technical Points
✅ Support holding at current structure
✅ Bullish momentum building on lower timeframes
✅ Risk-reward ratio favorable with layered entries
✅ Volume profile suggesting accumulation phase
🎬 The "Thief Style" Philosophy
This isn't financial advice - it's a trading game plan based on technical analysis and strategic positioning. The "Thief" approach means:
Stealth entries (layering in)
🧠 Smart exits (not overstaying the party)
🎯 Calculated risk (always know your out)
🎪 Having fun while staying professional
📉 Trading involves substantial risk of loss and is not suitable for everyone. Past performance is not indicative of future results.
✨ If you find value in my analysis, a 👍 and 🚀 boost is much appreciated — it helps me share more setups with the community!
🏷️ Tags:
#GOOGL #Alphabet #StockMarket #SwingTrading #DayTrading #TradingStrategy #TechnicalAnalysis #StockAnalysis #NASDAQ #TechStocks #LayeredEntry #RiskManagement #TradingIdeas #PriceAction #SupportAndResistance #ThiefStrategy #FAANG
Trade smart, stay safe, and remember: the market doesn't care about your feelings - only your strategy matters! 🎯💪
Alphabet - The textbook break and retest!📧Alphabet ( NASDAQ:GOOGL ) will head much higher:
🔎Analysis summary:
If we look at the chart of Alphabet we can basically only see green lines. And despite the recent correction of about -30%, Alphabet remains in a very bullish market. Looking at the recent all time high break and retest, there is a chance that we will see new all time highs soon.
📝Levels to watch:
$200
🙏🏻#LONGTERMVISION
Philip - Swing Trader

GOOGL Raid Plan: Bulls Set to Hijack the Chart!💎🚨**Operation GOOGL Grab: Robbery in Progress! Swing & Run!**🚨💎
🌟Hi! Hola! Ola! Bonjour! Hallo! Marhaba!🌟
Dear Money Makers & Silent Robbers, 🤑💰💸✈️
Get ready for another high-stakes market heist – this time, we’re raiding the vaults of GOOGL (Alphabet Inc.) using the Thief Trading Strategy™. Based on sharp technical intel and subtle fundamental whispers, the setup is clear: the bulls have cracked the code, and it’s time to grab our loot.
🟢 🎯 ENTRY POINT - THE LOOT ZONE
"The vault is wide open!"
Snatch your bullish entry anywhere on the chart, but the pros will place limit buys on recent pullbacks (15m/30m zones), either on swing lows or highs. The pullback is your door in — don’t miss it!
🛑 STOP LOSS - ESCAPE ROUTE
Set the Thief SL at the recent 2H swing low (162.00).
But remember, each robber’s risk appetite is unique — adjust your SL based on your size, cash, and courage.
🎯 TARGET - GETAWAY MONEY
💼 Main Target: 186.50
Or if heat rises early, vanish with your gains before the full score hits. Disappear like a ghost — profit first, questions later!
🧲 FOR SCALPERS – THE QUICK GRAB
Only ride the long wave — shorting is off-limits in this mission.
If your wallet is loaded, dive in. If not, join the swing crew.
Use trailing SL to protect your cash stack 💰.
📈 THE SETUP – WHY THIS RAID WORKS
The GOOGL Market is bursting with bullish energy — a classic Red Zone robbery moment.
Overbought tension, fakeouts, trend shifts — exactly where we love to strike! Consolidation and reversals = opportunity for the brave.
📣 TRADING ALERT - NEWS AHEAD!
🚨 Avoid entries during news releases – they trigger alarms!
Use trailing SL to lock in your stash, especially during high-volatility windows.
🔍 TIPS FROM THE THIEF’S DESK
Stay updated with the latest whispers — from fundamentals to geopolitical noise, COT positioning to sentiment swings. The market changes faster than a thief on the run — so adapt fast!
💖 Show some love: 💥Hit that Boost Button💥
Let’s fuel this robbery plan with more power and precision.
Every day in the market is a new heist — let’s win like thieves, not sheep. 🏆💪🤝❤️🚀
I'll be back soon with another masterplan...
📡 Stay sharp, stay hidden — and always aim for the vault. 🤑🐱👤🎯

$141 Stop, $207 Target — Bullish Setup on GOOGL with 1.4RMarket Context
Alphabet Inc. (GOOGL) is showing renewed bullish momentum on the 2-week chart. After a healthy correction earlier in the year, price action is now turning decisively upward, reclaiming its long-term trendline and bouncing off a major support level. This setup suggests a shift in market sentiment from consolidation to breakout mode, with significant upside potential.
Key Technical Levels
• Key Support – $151.90
This zone has acted as a major demand level and was tested multiple times. The recent bounce from here reaffirms its strength and underscores the market’s willingness to buy dips at this level.
• Stop Loss – $141.49
Positioned just below the Key Support, this stop loss accounts for volatility while protecting against a full breakdown. A close below this level would invalidate the bullish thesis.
• Resistance Level 1 (TP1) – $191.91
This price level marks a prior swing high and represents the first bullish target.
• Resistance Level 2 (TP2) – $207.32
A clear breakout beyond TP1 sets up the path toward this higher resistance, which also aligns with historical supply from mid-2021.
• Trendline Reclaim
The multi-year ascending trendline, breached temporarily, has now been reclaimed with conviction — a strong bullish signal on higher timeframes.
Trade Setup
• Entry Zone: $168.00 – $169.00
• Take Profit 1 (TP1): $191.91 (approx. 14% upside)
• Take Profit 2 (TP2): $207.32 (approx. 23% upside)
• Stop Loss: $141.49 (just below Key Support)
• Risk–Reward Ratio: Approximately 1.43
Price Action & Trend Confirmation
After establishing a series of higher lows, GOOGL has rebounded from the $151.90 zone with strength, forming a bullish engulfing candle on the 2W chart. This move brought the price back above the long-term trendline — a textbook bullish signal when viewed on a macro timescale. The structure now favors trend continuation, especially if the price holds above the $168–$170 zone in the short term.
Risk Management and Strategy
The stop loss below $151.90 is deliberately placed at $141.49 to avoid premature exit from minor volatility. This level is safely beneath the most recent swing low and gives the trade breathing room to develop. A partial exit at TP1 locks in gains while preserving capital for the extended move to TP2, where major resistance could trigger broader market attention.
Conclusion
GOOGL is setting up for a high-probability breakout from a clean technical base. With the price respecting long-term support, reclaiming the trendline, and establishing bullish momentum, the path of least resistance is upward. The trade offers a solid reward-to-risk profile and aligns with institutional-style setups often seen prior to extended rallies.
In short: GOOGL looks ready to move, and this is a setup bulls won’t want to ignore.

Alphabet (GOOGL) Shares Drop Over 7% in a Single DayAlphabet (GOOGL) Shares Drop Over 7% in a Single Day
According to the Alphabet (GOOGL) stock chart, yesterday’s main trading session opened around $163.70 but then saw a sharp decline, hitting an intraday low of approximately $148 per share. By the close, bulls managed to recover only a small portion of the losses. As a result, Alphabet (GOOGL) shares fell by more than 7% during the session – marking the worst performance among the S&P 500 constituents (US SPX 500 mini on FXOpen).
Why Did GOOGL Shares Fall?
The drop followed remarks by Eddy Cue, Apple’s Senior Vice President of Internet Software and Services, who:
→ noted a decline in search traffic on Safari;
→ revealed plans to expand Safari’s search capabilities using artificial intelligence.
These developments heightened concerns over Google’s dominance in search and its advertising revenue. According to media reports, analysts are warning of rising competition from AI-powered search platforms such as OpenAI, Grok, and Perplexity.
Technical Analysis of Alphabet (GOOGL) Shares
In our 23 April analysis, we identified a descending price channel and emphasised the psychological significance of the $150 level, which had served as a key support in 2024.
Since then, bulls showed confidence by pushing the price above the red channel. In addition, the chart has begun to outline a potential ascending trend channel (marked in blue).
However, yesterday’s statement from competitors shifts the outlook. The current GOOGL stock price is positioned at the lower boundary of the blue channel – which could act as support, reinforced by the psychological $150 level.
On the other hand, a bearish breakout below this area may revive the downtrend that began in February, potentially paving the way for a test of this year’s lows.
This article represents the opinion of the Companies operating under the FXOpen brand only. It is not to be construed as an offer, solicitation, or recommendation with respect to products and services provided by the Companies operating under the FXOpen brand, nor is it to be considered financial advice.

Alphabet (GOOGL) Shares Hover Near Psychological LevelAlphabet (GOOGL) Shares Hover Near Psychological Level Ahead of Earnings Report
On 31 March, we noted that bearish sentiment could push Alphabet’s (GOOGL) share price towards the psychological level of $150. As the current price chart suggests, GOOGL is now trading close to that very level.
Moreover, the price is approximately equidistant from the recent highs and lows (marked A and B), which may be interpreted as a sign of balanced supply and demand — and a wait-and-see stance from market participants ahead of Alphabet’s Q1 earnings release (scheduled for tomorrow, 24 April).
Awaiting the GOOGL Earnings Report
With the Nasdaq 100 index (US Tech 100 mini on FXOpen) having fallen by around 13.5% since the beginning of the year, investors are approaching tech earnings with caution. According to Barron’s, three key themes are expected to dominate the narrative:
→ management forecasts amid continued uncertainty around the White House’s tariff policy;
→ plans for major capital investment in AI-related infrastructure;
→ signs of softening consumer demand.
Given the current climate of uncertainty, Alphabet’s earnings report could prove particularly influential — serving as a benchmark for shaping market expectations ahead of other major tech company reports.
Technical Analysis of Alphabet (GOOGL)
The $150 level has served as key support throughout 2024, and over the coming days it may act as a springboard for a new price movement, potentially driven by the earnings results.
From a bearish perspective, the market remains in a downward trend (indicated in red) following a breakout below the lower boundary of a previously active rising channel (marked in purple) that had held since last autumn. However, if Alphabet’s management maintains an upbeat outlook for 2025, this could give the bulls the confidence to challenge the upper limit of the red channel.
This article represents the opinion of the Companies operating under the FXOpen brand only. It is not to be construed as an offer, solicitation, or recommendation with respect to products and services provided by the Companies operating under the FXOpen brand, nor is it to be considered financial advice.

Breaking: Alphabet ($GOOG) Shares Drop 7% in PremarketAlphabet Inc. (NASDAQ: NASDAQ:GOOG ) witnessed a significant 7% drop in premarket trading on Wednesday, driven by investor concerns over slowing cloud growth and the tech giant’s hefty $75 billion investment into artificial intelligence (AI) infrastructure. This figure far exceeded Wall Street’s projected $58 billion, raising doubts about the necessity and efficiency of such high spending.
AI Investment and Competitive Pressure
Alphabet has been aggressively investing in AI research and its integration across Google Search, Cloud services, and other platforms. However, the emergence of China’s low-cost DeepSeek AI model—which reportedly rivals leading U.S. AI models—has triggered discussions about whether Big Tech companies need to allocate billions toward AI advancements.
Cloud Growth Concerns
Alphabet's cloud division reported a 30% revenue increase to $11.96 billion in Q4, but this marked a slowdown compared to the 35% growth in Q3. In contrast, Microsoft Azure saw a 31% increase, while Amazon Web Services (AMZN) is projected to post only a 19% rise. Despite the slowdown, analysts believe the surging demand for AI-powered cloud computing will keep the long-term outlook positive for Alphabet’s cloud business.
Advertising Challenges
Beyond AI and cloud investments, Alphabet is grappling with fierce competition in the digital advertising space. With marketers increasingly shifting to social media-driven ad platforms like Meta’s Facebook and Instagram, and ByteDance’s TikTok, Google’s traditional ad model faces mounting pressure.
Technical Analysis
At the time of writing, NASDAQ:GOOG shares are down 6.75%, signaling a potential bearish continuation pattern. The stock appears poised to form a gap-down pattern, a bearish technical indicator that may lead to further downside pressure.
- Support Levels:* The first minor support lies at $197, aligning with the 78.6% Fibonacci retracement level. A breakdown below this level could result in gap-filling towards $185-$190.
- Major Structural Support: The BOS (Break of Structure) level is set at $155. A dip to this level could trigger further bearish sentiment and result in deeper losses.
- Moving Averages: Despite the premarket decline, NASDAQ:GOOG remains above key moving averages, suggesting that the broader trend remains bullish unless further downside momentum builds.
- RSI Positioning: Prior to this drop, the Relative Strength Index (RSI) was at 64, indicating that the stock was not overbought. This means the decline is not necessarily a reaction to overvaluation but rather a response to external market forces and investor sentiment.
Market Sentiment and Analyst Outlook
While some brokerage firms have cut their price targets on Alphabet, the median price target now stands at $220—still above its current premarket trading price of $191.20. Alphabet’s stock had gained 9% in 2024 before this drop, outperforming Amazon’s 10.3% gain and Microsoft’s -2.2% decline.
Conclusion
Despite the current dip, Alphabet’s long-term prospects in AI and cloud computing remain strong. The significant AI investment could prove to be a long-term advantage if it strengthens Alphabet’s competitive positioning. However, traders should closely monitor key support levels ($197 and $155) and whether the stock can hold above key moving averages.
For long-term investors, the recent drop could present a buying opportunity, but in the short term, further downside volatility is possible as market sentiment adjusts to Alphabet’s spending strategy. The coming days will be crucial in determining whether NASDAQ:GOOG can recover swiftly or continue its downward trajectory.

Google: Room to Head HigherFor the past two months, GOOGL has been stuck in a sluggish sideways phase, with even its latest breakout attempt quickly sold off. During the magenta wave , we still expect a new high, though a direct transition into the subsequent wave remains technically possible. In our 33% likely alternative scenario, we would have to reckon with a significantly delayed continuation of the overarching upward cycle. In this case, GOOGL would still be working through the (intermediate) correction of the green wave alt. , which would bottom below the support at $147.22.

Google: There We Go!Since late October, the Alphabet stock has been rejected twice at the $181.61 resistance. This Monday, though, it achieved an impulsive rally above this critical level. This advance aligns perfectly with our primary scenario by propelling the magenta wave further upward, and we expect additional gains as this movement progresses. However, the development of the ongoing upward impulse would be significantly delayed in our 33% likely alternative scenario. In this case, Alphabet’s stock would still be working on the corrective green wave alt. and sell off below the support at $147.22.

Google: At the Resistance!Driven by bullish momentum in the tech sector, Google’s stock has recently gained as expected. The resistance at $181.61 has presented a key hurdle in recent weeks. However, our primary wave count indicates that this level will be surpassed next during the ongoing magenta wave . This bullish impulse should conclude significantly higher in the chart, thereby setting a new all-time high. Conversely, there’s a 38% chance for our alternative scenario, which suggests an extended wave alt. correction.

Googling Gains: Long Trade Insights for AlphabetNASDAQ:GOOGL is a MUST HOLD for future gains.
Following up on last week's call, price did hit our ideal entry point and we are now long and strong. Stop loss has been re-adjusted at break even. Any bystanders, below is the ideal entry STRATEGY
Bullish time at mode trend has just been confirmed.
* Expiry is set for the end of November
* Targets of $189 and $201's at first.
* Ideal entry DCA low $170’s
* Stop at $169

GOOGLE Rockets! 15-Min Surge Hits All Targets – What's Fueling?ALPHABET (GOOGLE) Analysis:
Alphabet Inc. (GOOGL) experienced a powerful upward movement in the 15-minute timeframe, achieving all set profit targets with ease using the Risological Swing Trader.
The momentum from a strong earnings report has aligned with a positive risk sentiment across US equity indexes, sparking increased buying interest in tech giants like Alphabet.
Here’s a breakdown of the trade and supporting market context:
Entry : $164.75
Targets Achieved:
TP1: $167.07
TP2: $170.81
TP3: $174.56
TP4: $176.88
Stop Loss (SL): $162.87
Market Sentiment:
Recent quarterly earnings reports have fortified investor confidence, with broader equity indexes advancing. Alphabet's strong fundamentals and growth projections contributed to the bullish sentiment, encouraging traders to follow through on this aggressive buying trend.
With all targets hit in a single session, this upward momentum for Alphabet highlights robust institutional interest and solid fundamentals. Keep an eye on further tech earnings, which may continue to impact Alphabet's trajectory in the upcoming sessions.

Google - Textbook break and retest!NASDAQ:GOOGL might retest the previous breakout level before continuing the uptrend.
The entire chart of Alphabet (Google) is green, yet I do expect a (short term) move lower first. For almost a decade, Alphabet has been retesting and respecting a major support trendline before then breaking out of the ascending triangle formation just a couple of months ago. I just expect Alphabet to retrace back to the breakout level before then creating new all time highs.
Levels to watch: $150
Keep your long term vision,
Philip - BasicTrading

GOOGL may be ready to rally with the other Magnificent 7.NASDAQ:GOOGL has not performed as well as other Magnificent 7 names, which are currently trading much higher than their August 5th lows. If NASDAQ:QQQ continues to build above its daily 50 SMA, and other technology names in this space continue to move higher, GOOGL may start to move higher as well. GOOGL has held demand at the retest of the previous all-time high and may break out of a falling wedge on the weekly chart.
