SUI at the macro golden pocketCRYPTOCAP:SUI has only printed series of 3 wave structures on the weekly time frame showing no impulsive motif wave despite large returns. This suggests its all corrective or a leading diagonal.
Wave (B) is underway and currently at the golden pocket Fibonacci retracement, finding support in a High Volume Node. The altCoin golden pocket, 0.786, sits at $0.646, a likely terminal target.
Weekly RSI is printing unconfirmed bullish divergence but has not yet reached oversold. The bears are in control.
I think we are going to see bottoms soon enough. Dumping on a low liquidity Saturday is a suspicious move that could trigger a capitulation event.
Safe trading
ALT

SOL, holding up well but short term weakness continuesCRYPTOCAP:SOL weekly bearish divergence continues to play out until we get oversold are a bullish divergence to negate. There is room to fall. The running flat is negated and the pattern looks like a normal ABC correction.
Price lost the weekly 200EMA and pivot, bears are in control.
Wave 4 has a terminal target of the 0.38 Fibonacci retracement at $72, where we expect a bottom and move to new highs, $600 target.
I think we are going to see bottoms soon enough. Dumping on a low liquidity Saturday is a suspicious move that could trigger a capitulation event.
Safe trading

HBAR almost at altCoin golden pocketCRYPTOCAP:HBAR hit my short term downside target $0.1 and is heading to the altCoin golden pocket 0.786 Fibonacci retracement, a high probability wave 2 bottoming area for low cap , volatile assets. Vol-70.
This is also a major High Volume Node, $0.7
Weekly RSI is getting oversold but with no divergence.
I think we are going to see bottoms soon enough. Dumping on a low liquidity Saturday is a suspicious move that could trigger a capitulation event.
Safe trading

DOGE, not impulsiveCRYPTOCAP:DOGE weekly support line is lost, wave 4 appears to still be alive. NOthing impulsive, heavy overlapping price action.
Weekly RSI has room to fall until oversold. Price is approaching the altCoin golden pocket 0.786 Fibonacci retracement where it is likely to find support.
Safe trading

ONDO, so much for the RWA narrativeLSE:ONDO is almost at all time low. the Real World Asset (RWA) narrative is still around but never really took and instead punishing anyone with capital who belives.
Weekly RSI is oversold, the Fibs have nearly be ran completely. Its the last stand for ONDO. No weekly 200EMA and well below the weekly pivot.
I think we are going to see bottoms soon enough. Dumping on a low liquidity Saturday is a suspicious move that could trigger a capitulation event.
Safe trading

ETH Hitting the golden pocket in wave 2, high prob bottomCRYPTOCAP:ETH
ETH weekly bearish divergence has been playing out since the test of the previous all time high. This is a high probability terminal point for Elliot wave 1. Wave 2 is expected to at least pullback to the golden pocket, .618 Fibonacci retracement, where price sits now.
Price lost the weekly 200EMA and pivot and closed below, not good, but could also sweep this area and turn around.
Weekly RSI has room to fall but is getting to oversold with no divergence.
Wave 3 should be powerful move into price discovery.
Safe trading

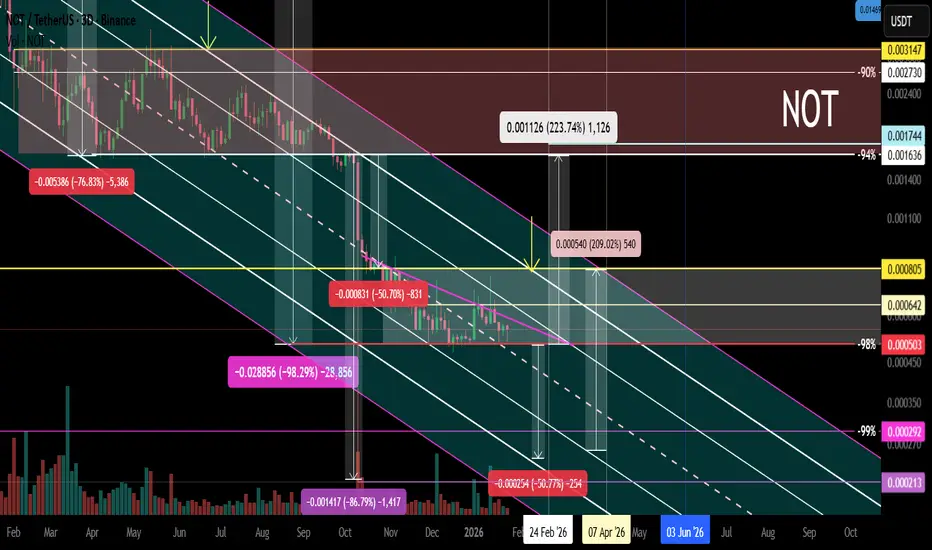
NOT Local trend. Sideways -98%. Reversal zones 27 01 26Logarithm. 3-day time frame.
The price in the main trend is still in a downward channel with a given volatility range.
Medium-term - locally , another sideways trend has formed (the third in a downward channel), but the decline is already -98% (not counting the futures long, which was previously down by -99%). Typically, such low-liquidity hype scams decline by -94-98% (with rare exceptions of -99% or a complete scam project, based on some fiction).
It's important to understand that the creators of such cryptocurrencies always sell at any price (they're created for profit, under the hype). But at low price levels (-94-99%), a dilemma arises:
1️⃣ invent a reason for a scam and abandon the project;
2️⃣ or reverse the trend and temporarily restore faith in the scam cryptocurrency. This will, in turn, continue selling.
You can exploit this and profit from it. But, in the long term, it's best to be cautious with such assets. This applies to absolutely all cryptocurrencies created for hype and with no real future use. When trading such dying former super-hypes, manage your risks. This is the foundation. If you can't manage it, avoid it.
FET global trend. Ascending channel. Wedge. AI hype. 01 2026Logarithm. 1-month time frame. Linear chart without market noise. The idea is to visually understand the long-term trend direction of this cryptocurrency. The AI monopolists—giants of the non-cryptocurrency world—are using it.
Medium-term and local.
FET secondary trend. Wedge. Fractals. AI hype. January 2026

FET secondary trend. Wedge. Fractals. AI hype. January 2026Logarithm. 1-week time frame. Classic trading based on reversal zones and the resulting wedge formation.
This zone is in the main trend (entire trading history). 1-month time frame. Suitable for long-term investment for those for whom trading is not their occupation.
FET global trend. Ascending channel. Wedge. AI hype. 01 2026
Markets move according to their market phases:
1) accumulation + sometimes part of it capitulation;
2) participation, that is, a price rise towards distribution;
3) distribution + sometimes part of it super hype;
4) decline, that is, a price drop towards accumulation zones and a repetition of the "golden ring of Baal's calf (Baal)"...
That is, markets move according to the seasonality of the action of large capital “without personal” (supply/demand).

LTC global trend. Ascending channel. Triangle. January 2026Logarithm. 1-month time frame. Linear chart without market noise. Designed for visual understanding of long-term trend direction.

XRP, 200EMA rejection, local uptrend intactCRYPTOCAP:XRP
🎯Price printed a bullish engulfing 3 white knight candle pattern, reclaiming the daily pivot now being tested as support. The daily 200EMA served as resistance as price was swiftly rejected. Overcoming this is the goal for the bulls.
📈 Daily RSI negated bearish divergence, RSI is resting quickly, a good sign for the bulls.
👉 Analysis is invalidated below the swing low $1.8, keeping the downtrend alive.
Safe trading

SUI, volatile, but local uptrend intactCRYPTOCAP:SUI
🎯Price printed a 3 white knight bullish engulfing pattern, reclaiming the daily pivot, now being tested as support. Wave 2 of a new uptrend appears to be underway. Wave 3 has a first target of the daily 200EMA, followed by $3.1
📈 After negating the bearish divergence, daily RSI has unconfirmed hidden bullish divergence forming.
👉 Analysis is invalidated below $1.31, keeping the downtrend alive
Safe trading

SOL, uptrend intactCRYPTOCAP:SOL
🎯Price caught a bid moving bullishly above the daily pivot, now being tested as support. Wave 2 of a new motif wave appears to be underway with an inital target of the daily 200EMA.
📈 Daily RSI is back to the EQ, restting quickly. A good sign for bullish continuation.
👉 Analysis is invalidated below wave C, $110
Safe trading

ONDO, rekt, fresh low...LSE:ONDO
🎯Price printed a 3 white knight bullish engulfing pattern, jumping above the daily pivot before being rejected hard to fresh lows, keeping the downtrend intact. The 0.786 Fibonacci retracement has been penetrated as price loses the High Volume Node support. S1 pivot is the next target, $0.3.
📈 Daily RSI is showing unconfirmed bullish divergence.
👉 Analysis is invalidated above $0.5 swing high.
Safe trading

HBAR, Bears in control, strong rejectionCRYPTOCAP:HBAR
🎯Price caught a strong bid on bullish divergence, but was rejected just as hard. Price is below the daily pivot and 200EMA, which is bearish, showing the downtrend is intact. The next downside target is the S1 pivot at $0.0893.
📈 Hidden bearish divergence played out at a High Volume Node. Bullish divergence is now forming, but unconfirmed.
👉Analysis is invalidated below the swing low, keeping wave 2 alive. We are very close to this level.
Safe trading

FET looking for new lows, downtrend in tact, h. bear divNYSE:FET
🎯The downtrend is intact, with wave 2 appearing complete. Wave 3 down is strong and hard. Price appears to want to continue lower to test the altCoin golden pocket at 0.786 Fibonacci retracement.
📈 Daily RSI went too high, too fast, and printed hidden bearish divergence at a High Volume node. The rejection was hard and swift.
👉 Analysis is invalidated above wave 2 swing high, $0.3.
Safe trading
ETH, trying to breakout, multiple attempts 200EMA and R1 pivotCRYPTOCAP:ETH
🎯Wave 1 appears to have completed a leading diagonal. Wave 2 appears complete with the recent higher low, but we need to break above wave 1 for confirmation. Price was rejected at the daily 200EMA and R! pivot, but is attempting to break through again. Overcoming this will be very bullish, especially as we are above the daily pivot.
📈 Daily RSI is printed hidden bearish divergence, followed by another bearish divergence. A move above wave (1) is essential to negate this, or prices could head to new local lows.
👉 Analysis is invalidated below wave (2)
Safe trading

DOGE, testing daily pivot as support, not much changed in a weekCRYPTOCAP:DOGE
🎯 Price printed a bullish engulfing 3 white knight candle pattern. It is above the daily pivot, yet testing as support. A critical level to hold. DOGE is still below the daily 200EMA. Overcoming this will be very bullish. The Elliot wave count remains tricky, so I will await more confirmation.
📈 Daily RSI printed bullish divergence, then negated the bearish divergence. The RSI shot up too hard and fast, which often results in a reversal. The reversal took place and tested the daily pivot as suggested last week.
👉 Analysis is invalidated below the swing low, keeping the downtrend alive
Safe trading

AAVE Hidden bearish divergence on the daily playing outEURONEXT:AAVE
🎯 The path from last week’s analysis is being followed, so far. Price printed a bullish engulfing candle breaking above the daily pivot, but was ultimately rejected at the R1 pivot, now testing the daily pivot and High Volume Node as support. The downtrend is intact. The first target for continued upside is the daily 200EMA and High Volume Node resistance at $210. Overcoming the daily 200EMA will add confluence to a major bottom being in. Wave (C) of triangle wave (D) appears to be underway.
📈 Daily RSI printed hidden bearish divergence which is playing out.
👉 Analysis is invalidated if we drop below $148, keeping wave (B) alive.
Safe trading

OrAI (Orachain) AI. Trend. Death, or a Little Later? 01 11 2026Logarithm 1 week. The idea is more educational. In my opinion, it's a dying project simulating utility, fueled by the hype of AI agents. During the hype, it was around $100-$80. Now it's $0.64. That's a price drop of -99.4%. Just think about it...
I also specifically showed buying at the “bottom” between -99 and -99.4, a whopping -40%.
Therefore, when trading something like this, you need to understand that TA (besides understanding the trend direction and reversal zone on a large time frame), the logic of price movement on assets with such liquidity (the "developers pouring in" money and the crowd joining in), is a convention, especially in terms of support/resistance levels.
If desired, the creators of such crypto projects can achieve instantaneous death (sell their remaining crypto coins at the market price and come up with an excuse, such as "we were hacked").
Or, conversely, they can create a “pump stick” with a large percentage, followed by a huge amount of positive news on the community's social media to "restore the faith" of holders and traders. The same applies to selling remaining coins. If you, as a trader, control your risks by following risk management and understand the nature of manipulation, you can catch this moment and profit from it.
🔵 Main trend . A descending channel with a large percentage increment. Developers pump a large percentage and sell while there is liquidity. Then they delist from exchanges and die. Several similar projects, with “new faces” of creators, have already been created using the proceeds to fuel hype. This is practically the case, and we must accept this. The price is at dynamic support within the internal channel. A rebound would be rational (to sell off the remaining stock before delisting from the exchanges with the main liquidity where it is traded) if the market turns green on or around January 17th.
🟡 Secondary Trend . The targets of the huge "head and shoulders" pattern have been realized, with impressive pumps in part of the formation due to low liquidity at +1000%, and, naturally, similar corrective movements.
🟣 Local Trend . The -88% target of the second component of the pattern, namely the descending flag, is currently being realized. The % targets according to the classic TA have not yet been fully realized (not necessarily to the exact %), but are close to completion. The decline has currently stopped at the dynamic support of the main trend within the internal channel. If a reversal occurs from this zone or slightly below, I've shown the percentage for orientation. What's important for the chart is a breakout of the local downward trend (highlighted in purple). In the long term, and perhaps even in the medium term, this could spell the end of the project. It will be interesting to follow up in the future and see how they proceed.

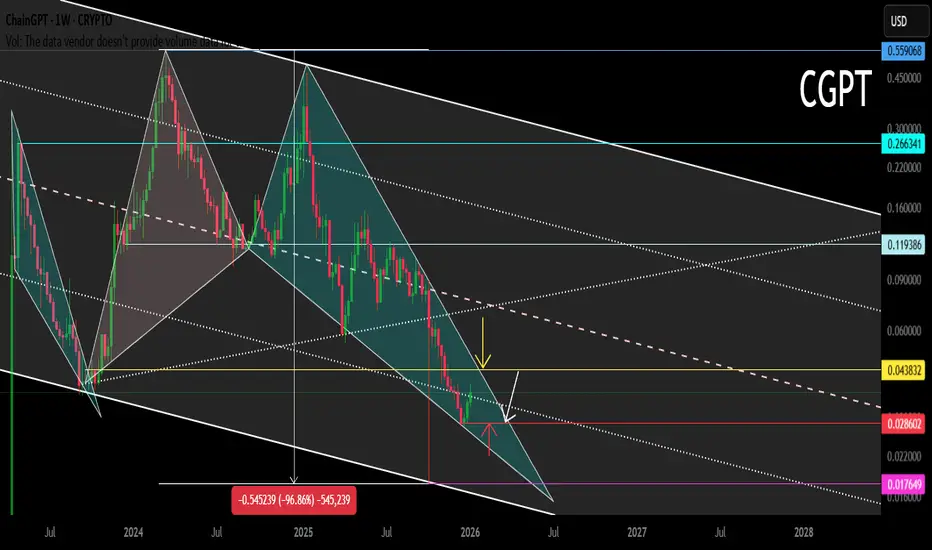
CGPT (ChainGPT) Main Trend. Channel. AI. January 11, 2026Time frame: 1 week. Another project under the hype of AI, which is developing slightly now and will grow strongly in the future. A descending channel in which a descending wedge is forming (the second wave of the structure). A breakout of the wedge (dynamic resistance) is a trend reversal. I showed two options (working for a breakout):
1) a breakout of the wedge from the current zone (internal support of the channel of the large formation).
2) a breakout of the wedge near the external support zone of the ascending channel of the main trend.
AITECH Main trend Channel Wedge. Reversal zones. AI. 30 07 2025Logarithm. Time frame 1 week. Main trend. Huge pumps for hype. The price is driven up on dexes, and profits are realized on centralized medium and low liquid exchanges. Important. Twitter (X) of the project has 560 thousand subscribers. That is, at the right time there will be a flow of positive news for subscribers who are former holders, or potential buyers (there are most of them, they buy only very expensive ones) and pumping as before, but by a smaller percentage.
And while in the ascending channel, the decline phase forms a descending wedge in the secondary trend. A triangular formation has formed in the local trend. The logic of the reversal zones is shown with arrows.
What is it. From the marketplace:
Solidus AI Tech is building one of Europe's first Web3-based AI infrastructures, powered by a state-of-the-art, green HPC data center. The $AITECH token powers an ecosystem of products that combine AI utilities, scalable computing, and Web3 tools, empowering developers, enterprises, and institutions to easily build, deploy, and scale AI solutions.
With the support of major partners including NVIDIA, IBM, Fetch.ai, Tron, BNBChain, Binance Wallet, Trustwallet, and many more, Solidus AI Tech is becoming one of the most advanced and adaptable Web3 AI token projects, positioning itself among industry leaders.

TOP Altcoins for 2026 ~ ALTSHappy New Year 🥂
Here's a quick glance at my TOP 5 alts of choice for 2026, and why.
💭Injective (INJ)
Fast, interoperable DeFi infrastructure. Active development and a clear use-case in scaling decentralized trading.
💭Illuvium (ILV)
Prioritizes high-quality gameplay and steady development, backed by a solid revenue model.
💭Solana
ETH competitor, SOL is approaching some great buy zones that can have big bounces:
💭Origin Protocol (OGN)
Focuses on tokenized commerce and NFT marketplaces, making it easy for creators and brands to build decentralized storefronts.
💭Audius (AUDIO)
Decentralized music-streaming platform giving artists more control and growing consistently in real-world adoption.
Which alts are you watching for this year?
