ETHEREUM: Crucial Formation, Important Levels to Watch!Hello There,
on the short-term perspective Ethereum is forming crucial bearish pressure which could be decisive within the near future. While Ethereum remains the second largest cryptocurrency, it is recently forming crucial formations that should not be underestimated. In the past weeks, trading actions already showed major selling pressure occurred from whales dropping their ETH on the market. Now, there is an important formation forming, which could be the setup of a determined continuation. Especially when the levels confirm this will likely lead to an exaggerated price move.
When looking at the chart, we can see Ethereum is now trading within this major downtrend channel in which it already formed major bearish pressure. Furthermore, it formed a bearish EMA crossover to the downside, confirming the bearish trend. The several lower lows of the bearish trend mark the significance of this condition. Now, within the past few days, Ethereum set up to form a bear flag formation within the downtrend.
Within this bear flag formation, Ethereum already completed the initial waves A and B of the inner bear flag formation. Now with wave C, Ethereum is likely to move into the upper resistance zones. There is a major resistance zone within the upper boundaries of the channels. Several resistances come together, such as the upper boundary of the descending channel, the upper boundary of the bear flag, and the horizontal resistance line.
With a bounce into this area, which should be expected within the next times, Ethereum is entering a really crucial zone from where a pullback is highly likely. Especially when more and more whales enter the market and short sell, a pullback from this area will be an origin for bearish pressure towards the downside. The whole bear flag formation will be confirmed with a breakout below the lower boundary of the flag formation.
Once this formation has been completed, the targets as seen in my chart will be activated. From there on, a bearish continuation could also be likely if Ethereum does not manage to reverse in this area. In any case, this will be a highly important area to watch out for. Currently, it is important to consider the next phases of development and how Ethereum reacts to the resistance zones. The bearish price pressure should not be underestimated in any case.
With this being said, it is great to consider the important trades upcoming.
We will watch out for the main market evolutions.
Thank you very much for watching!
Altcointrading

SOLANA: This Gigantic Formation is Going to Blast Through Roof.Hello There,
welcome to my new analysis about SOLANA on the weekly timeframe perspective. As a believer in the cryptocurrency revolution, I am sure the adoption of large-scale crypto networks is going to spread continuously throughout this year. We can already see more and more financial intermediaries adopting cryptocurrencies like SOLANA. This is also reflected by the SOLUSD price and crucial adoption factors such as Western Union also adopting this network. In my analysis I focus on the underlying factors that drive these changes in the financial ecosystem.
Especially at the beginning of 2026, there was a record high of whales accumulating more and more SOLANA to prepare for the major market disruptions that are likely to happen. Such actions are always made before the big public gets aware of it. Therefore, it is highly important, as a trader in the market, to appropriately prepare for any such significant and influential developments. Currently, SOLANA is already within the top 10 of cryptocurrency market cap coins. This can quickly change when more and more whales move into this market to push the bullish buttons before the large public gets aware of it.
The whitepaper already states that SOLANA is a high-performance blockchain that was designed to process up to 710,000 transactions per second, though real-world throughput typically ranges from 2,000 to 3,000 TPS. It is not unlikely that under such conditions more and more adoptions from smart money will happen in the next times. These factors are crucial for examining the actual real price action outcomes setting up for SOLANA at this moment. If this adoption goes forward in the upcoming times, we will see other whales also moving into the coin.
From a technical perspective, SOLANA is trading within this gigantic uptrend situation in which it is forming several crucial technical formations. The most important one currently is this massive bull flag formation. This formation is already in the middle to later stages of completion. The wave count within the formation is already forming the final wave C. This completion of the wave count will reach strong supports within the bullish confluence zone marked in my chart, supported by the lower boundary supports as well as the 200-MA.
Once SOLANA bounces in this area, it will be a highly determining move and crucial for the whole upcoming prospect, which should be expected. Especially when there are a lot of bullish acquisitions and the large wallets moving into the market, we can be sure that a bounce from this zone will likely confirm the whole bull flag formation. Such a confirmation will drive the price action into spheres never seen before. When considering an altcoin-focused approach in the market, this will definitely be an important underlying setup to consider.
With this being said, it is great to consider the important trades upcoming.
We will watch out for the main market evolutions.
Thank you very much for watching!

Happy New Year XRP: These Events Set Up Major Moves for 2026.Hello There,
welcome to my new analysis about XRP. In recent times a very important dynamic with XRP caught my attention. Throughout 2025, major events happened that are setting up an important foundation for XRP and the upcoming year. These events are building major cornerstones that will have an enormous effect on the price action. From a fundamental and technical perspective, XRP is about to write an epic future.
When looking at my chart, you can watch this gigantic uptrend channel in which XRP has already several times bounced within the bullish accumulation zone marked in green. This zone was also the origin of XRP shooting to the moon in October 2024, marking the all-time high of $3.66. This major breakout was already part of the completion of this gigantic bullish triangle formation. Such a formation already completed once for XRP, being the origin of the historical upthrust.
While the MA structure is holding this whole trend to the upside, there are also key fundamental signs that reveal an underlying bullishness for XRP. One of them is that XRP just ended its year-long battle against the SEC. This makes way for a financial framework that does not ignore the positive prospects cryptocurrencies like XRP bring to the monetary market. The winning of this case makes XRP much more attractive for further investments and volume into the market.
Also, the launch of the XRP ETF on the 18th of September 2025 at CME has pumped massive volume into the market. In some minutes, millions and millions of dollars were pumped into the XRP network. The key element of an ETF, which makes XRP a much better investment for institutions, is a major milestone. Such an ETF event could be the beginning of historical price moves never seen before, similarly to what has been seen with other cryptocurrencies.
Technically speaking, XRP is now just about to confirm this gigantic triangle formation. An important factor here is the bounce from the upper boundary of the triangle. As seen in my chart, such a price move is supported by the moving averages, the lower boundary of the gigantic uptrend channel, and also the lower boundary of the triangle formation. This level is extremely important to hold; however, currently there are no signs of invalidation.
It will be an interesting journey ahead. And it will be particularly important to consider how XRP reacts to the main zones of support. In any case, it will be compelling to watch how these major levels will be approached.
Thank you very much for watching.

ENA / USDT – Short Bias (HTF + Confluence)ENA is currently trading below the weekly support level, which keeps the higher-timeframe bias bearish.
As long as price remains below this weekly level, longs are high risk.
On the 1H timeframe, price has retraced into a clear sell-side zone, aligning with:
Prior resistance
A clean bearish order block
Weak reaction on the retrace (no impulsive bullish displacement)
📉 Market context confirmation:
Total Market Cap still shows bearish structure, supporting downside continuation across altcoins.
Key thesis:
Weekly support flipt in to resistance
No bullish deviation confirmed
HTF + LTF structure align bearish
ENA only turns bullish if:
➡️ Price deviates below the level,
➡️ Reclaims the weekly level as support,
➡️ And shows strong bullish displacement (as discussed in the weekly analysis).
Until then, rallies are considered sell opportunities.
Target idea:
Liquidity draw towards equal lows (EQL) remains likely if resistance holds.
Not financial advice. Always manage risk.
Do you think ENA will reject from resistance or reclaim the weekly level first? 👀📉
MrC

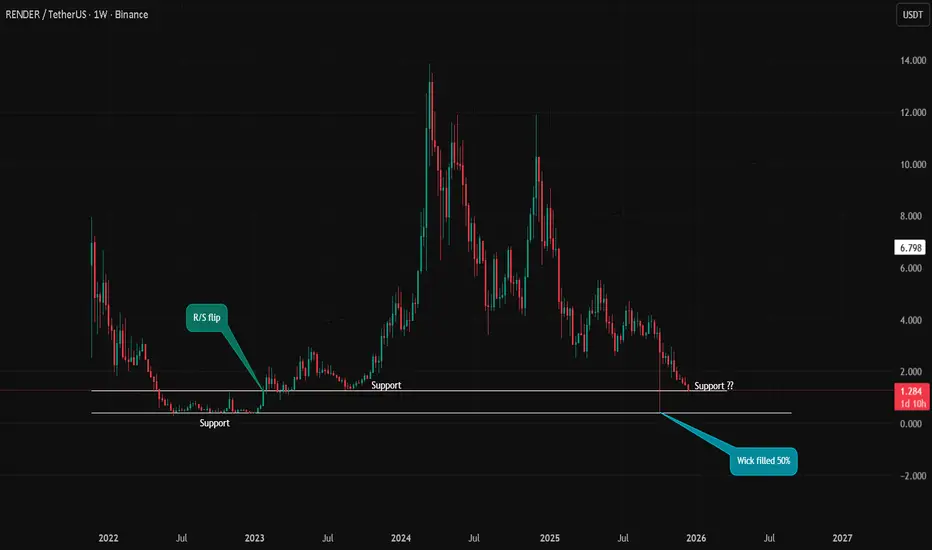
RNDR – Weekly Structure Price is currently trading at a major HTF support zone around $1.20–$1.30.
This level previously acted as strong support and resistance, making it a key decision area.
The recent downside wick has been partially filled (~50%), which often signals temporary demand, but structure is still bearish on the higher timeframe.
Key levels to watch:
Support: $1.20 – $1.30
Next downside risk: If this level fails → possible continuation lower
Bias:
As long as price holds above support → potential range / relief bounce
Weekly close below support → bearish continuation scenario
Patience is key here. Let price confirm direction before entering.
Not financial advice. Always manage risk.
MrC
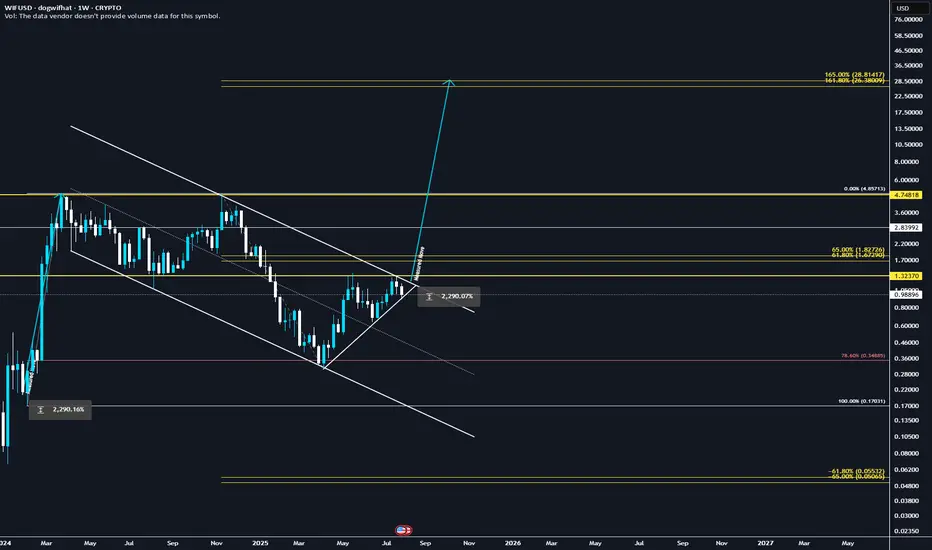
They're lying! WIF will explode to 28.8$ ✅ Golden Pocket Extension: $28.80 aligns with the 1.618–1.65 fib extension (golden pocket zone) from the last major impulse.
✅ Measured Move: Breakout from the prior downward consolidation projects to ~$28.80 when using the height of the range added to the breakout point.
✅ Confluence = High Probability: Both fib extension and measured move target the same zone, increasing confidence.
✅ Momentum + Meme Rotation: If broader meme coin rotation continues, WIF has narrative + volatility fuel.
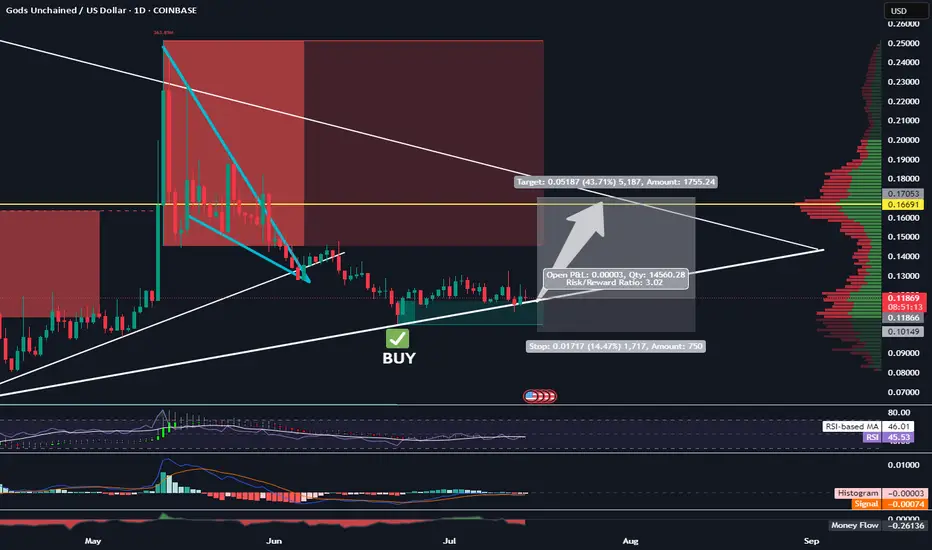
Long GODS - Target 17 Cents - 1:3 RRRTrading Fam,
As I continue to gain experience with my AI-created indicator, I am learning to remain patient and wait for the perfect setups. We have one here on GODS. You can see that we've returned to the bottom of a larger triangle and are using it as support. Additionally, we are within a favorable liquidity block where buyers tend to accelerate the volume. My indicator gave the BUY signal 2 weeks ago, and there has been plenty of sideways accumulation since the signal flashed. Probability suggest that GODS will pump soon.
I'll be targeting 17 cents with a SL at 10 for a 1:3 RRR.
Let's go!
Stew
Drop Your Token – I’ll Do The AnalysisHey everyone! Hope you’re having an amazing weekend !
Want me to analyze your favorite token ? Just drop your request in the comments using this format:
Request Format
Project Name: Bitcoin
Token Symbol: BTC( BINANCE:BTCUSDT )
Important Notes:
I’ll pick and analyze only the first 10 tokens requested .
One request per person — so choose wisely!
I’ll reply directly under your comment with the analysis.
If you find this helpful, don’t forget to Like ❤️ and Share this post with your friends!
Here’s to your success — health, wealth, and great trades! 🚀

SHIBA INU Heist Plan | Layered Buy Limits + SL Strategy🏴☠️💸**SHIBA INU Heist Blueprint: Rob the Bulls, Outsmart the Bears | Thief Trading Style Strategy (Swing/Scalp)**💸🏴☠️
🌍Hola! Hello! Marhaba! Bonjour! Ola! Hallo!🌍
💰Calling All Market Pirates, Profit Seekers, and Silent Thieves... the vault is open!💰
This is a special market mission for SHIB/USD (SHIBA INU), based on the notorious "Thief Trading Style" — a method designed to sneak in, grab profits, and vanish with style. 💼✨
🧠Backed by a spicy combo of technical, fundamental, on-chain, and sentiment analysis, this strategy is crafted for both swing and day traders ready to infiltrate volatile zones and escape with gains.
🎯The Robbery Plan:
We're targeting a high-risk, high-reward breakout with our eyes on the ATR police trap zone, where market makers often lure and trap traders. Our focus? The sweet spot where consolidation ends, fakeouts begin, and true reversals take off. ⚠️🐍
📥ENTRY (The Break-in):
"The Vault is Unlocked!"
Sneak in using buy limit orders at swing lows or support zones—opt for the 15m or 30m chart to catch pullbacks.
We're stacking orders like a professional thief using DCA (Layering Method) to reduce entry risk. 📊💼
🔎 Entry Zone: Market or limit entries near structure lows—be precise, not greedy.
🛑STOP LOSS (Escape Hatch):
Use the 2H swing low around 0.00001150 as your escape signal.
Risk management is your armor: adjust SL based on your lot size, order count, and trade exposure.
🔒Thief Tip: Never trade without your getaway plan!
📈TARGET (The Safe Zone):
🎯 Primary Target: 0.00001290
Optional: Use trailing SL and scale out profits as the robbery gets hotter.
Scalpers—only join the long side of the heist! If you're packing a big bag of capital, jump in earlier; if not, ride with the swing team. 🚁💸
📊THIEF FUNDAMENTAL FUEL:
SHIB bullish momentum is rising due to macro sentiment shifts, market rotation, whale accumulation, and on-chain volume flow.
Check related macro reports, intermarket insights, and crypto futures data before loading your bags. 🧠📈🔗
🛎️HEIST WARNINGS – Stay Safe!:
🚨 During major news releases, volatility can explode. Don’t get caught!
❌ Avoid fresh entries during news
✅ Use trailing stops to lock gains on existing positions
💖LOVE THIS PLAN? SUPPORT THE CREW:
💥Smash that Boost button💥 to keep the Thief Trading Crew alive and plotting!
We drop fresh heist plans regularly—help us spread the love, grow the crew, and keep stealing profits from the noise. 🚀
📌Disclaimer: This analysis is for educational purposes only—not financial advice. Always DYOR and adjust based on your personal risk profile.
📌Stay tuned for more heist missions. Let’s outwit the markets—one trade at a time.
🤑🐱👤💎 #ThiefTradingStyle #SHIBHeist #CryptoStrategy #MarketRobbery #SmartMoneyMoves

#PARTIUSDT is showing signs of a reversal🚀 The price BYBIT:PARTIUSDT.P is showing signs of a reversal after a prolonged downtrend.
🚀 The scenario becomes more likely if the price holds above $0.1520 with increasing volume.
🚀 Watch for a breakout and confirmation above the $0.1500–$0.1520 zone — this would strengthen the bullish setup.
🚀 If volume picks up during the continuation of the move, a quick push toward $0.18 is possible.
📈 LONG BYBIT:PARTIUSDT.P from $0.1533
🛡 Stop loss: $0.1492
🕒 Timeframe: 1H
✅ Overview:
➡️ The price has broken out above the Bearish Flag, confirming a break in the downtrend structure.
➡️ The Double Bottom formation increases the likelihood of an upward move.
➡️ Entry at $0.1533 is just above the resistance zone and confirms the breakout.
➡️ The upward potential remains toward $0.1600 and beyond, aiming for the POC volume area.
🎯 TP Targets:
💎 TP 1: $0.1555
💎 TP 2: $0.1575
💎 TP 3: $0.1600
📢 Support zone: $0.1500–$0.1510 — must hold to maintain the bullish structure.
📢 If price consolidates above $0.1555, expect a potential acceleration toward $0.1600.
📢 A drop below $0.1492 invalidates the scenario — stop is mandatory.
🚀 BYBIT:PARTIUSDT.P breaks key level — bullish signal confirmed! Watch for continuation!

Market Moves & Token Trends – Analysis with Me!Hi everyone, I hope you're all having a fantastic weekend!
To receive a token analysis , please follow the format below and leave your request in the comment section:
Example:
Project Name: Bitcoin
Token Symbol: BTC
Important Notes:
I will analyze a maximum of 20 tokens.
Each follower is allowed to submit one analysis request.
Once submitted , your token analysis will be shared directly below your comment .
Looking forward to your requests! 😊
If you found this helpful, please hit the ✅ Like Button ✅ (It fuels my energy) 💪 and Share it with your friends! Let’s grow together! 🙏😊
Wishing you health, wealth, and success! 🚀💸

1000CHEEMSUSDT – 2500% Volume Surge!1000CHEEMSUSDT – 2500% Volume Surge! Watching the Blue Boxes Closely
“A 2500% volume increase is NOT a joke—something BIG is happening! But smart entries matter.”
🔥 Key Insights:
✅ Massive Volume Surge – This is where real moves start.
✅ Two Strong Support Zones Marked (Blue Boxes) – These are the ideal reaction points.
✅ Patience = Profit – Jumping in blindly is how people get wrecked. Wait for confirmation!
💡 The Smart Plan:
Watch for LTF Market Structure Breaks at Blue Boxes – A reaction here = smart money stepping in.
CDV & Volume Profile Must Align – If buyers show real strength, we take action.
No Confirmation? No Entry. Discipline Pays!
“We trade setups, not emotions. Let price come to us, confirm, and then we strike!” 🚀🔥
A tiny part of my runners;
🌊 WAVESUSDT.P: Demand Zone Potential
🟣 UNIUSDT.P: Long-Term Trade
🔵 XRPUSDT.P: Entry Zones
🔗 LINKUSDT.P: Follow The River
📈 BTCUSDT.P: Two Key Demand Zones

Altcoin Golden Cross Formed Last Week - First Time in 4 YearsTrading Fam,
You are probably tired by now of seeing all the hopeful headlines, predictions, and analysis while altcoins continue to descend. I am too. Therefore, I am going to sound a little more pessimistic in this post. Some call this 'realistic' but whatever ...semantics.
While I am hopeful that an altseason will occur, I am also beginning to become less and less convinced that anything like we experienced in the past will occur again. The longer we go without seeing the beginning of our altcoin cycle, the more time altcoins have to dilute the capital pouring into the market. There are just so many altcoins to choose from now and literally hundreds or thousands more are being created weekly by way of memecoins. As the meme on my chart illustrates, those pouring in are spreading their resources out much more thinly now because there is so much more to choose from than there was in 2021. Therefore, what pump we may see in our own investments may not equate to what we expect. And if we are not careful to pick the right coins, it may not even equate to the average profit that was realized in the altcoin market in 2021.
So, here's the deal. By now, you may or may not be aware that a couple of weeks ago our altcoin charts showed us something we haven't seen in over four years! It was the golden cross. This event occurs when our 100 DMA crosses above our 200 DMA. In this case, white represents the 100 DMA and red represents the 200 DMA. They are both SMAs. This event is supposed to be an amazing indicator and a lot of analyst were using it to say that we that our altcoin season has now begun. This very well could be the case, but also, we could drop further and use one of those moving averages as support before any real bounce occurs. Furthermore, past history should never dictate current. History may not in fact repeat and altcoin season may not occur at all. It doesn't have to. Maybe this time we don't get one? This is simply something we should realistically consider.
Now if it does occur, excellent! This is what I personally have been banking on. So, the other thing I want to discuss a little bit more is what actually occurred in the altcoin market last time this happened in 2021. You can see from the chart, that once the golden cross occurred, the race was on. Price essentially continued up through May, dipped from May through July and then continued up again from July through November. So, if you held from the beginning of the cross to our peak in November, you would have realized average altcoin gainz of around 500% (or 5x).
Now, let's say the same thing occurs this year. Our golden cross occurred two weeks later this year than it did in 2021 but I don't think that makes much of a difference. Essentially, if this altcoin season is truly beginning right now, we'll have about 9-10 months of upside with the potential of a big dip somewhere there in the middle. That dip in 2021 was about a 60% drop from top to bottom and paper hands folded quickly during that time thinking the top was in.
If similar price action occurs this year, then we may have 9-10 months to capitalize on alts but again, with a huge exception ...only the best of the best in alts will perform up to this 5x standard or better. You know, stuff like Doge, XRP, SOL, ETH (yes, I said ETH), etc. The OG classic boomer alts.
But what about memecoins?
IMO, a select few memecoins could still do very well, however, we have to be honest here. We are playing roulette. Despite what Murad and others on X continue to preach about belief and conviction and religiosity of the coin, the number of holders, yada yada yada, in the end, we have to be honest with ourselves or we will lose money. Memecoins are simply a big casino. Some will do very well and make their millions. You'll hear from these lucky bastards incessantly I am sure. The fact that they turned 100 dollars into $100,000,000 will be advertised on X and other social media platforms ad nauseam. You will want to go throw up because you were at one time in one of these memecoins too. And then you sold. And these are the stories you won't hear. You won't hear about how many failed. You won't hear about how many degens went broke chasing this imaginary illusion, this pipe dream, of unlimited wealth filled with lambos and yachts with girls. You won't hear that most memecoin traders lost money rather than gained.
I don't want to end too pessimistically here because I am playing the memecoin game too. I'm in the casino and spinning this wheel. Maybe one day I'll be one of those lucky bastards that wins. As of today, that is certainly not the case (just being honest) and I certainly don't stake my life savings on it. So, all I am suggesting here once again is to be cautious. Have fun. Play the game if you wish and I hope you win. But also, be careful, pick only the best of the best, and NEVER risk more than you can afford to lose.
Here's to hoping this is truly the beginning of another altcoin run.
✌️ Stew

TAO has bottomed?TAO has hit a key support level at $365 and is now reacting, and it could very well be the bottom.
I will wait for confirmation, but it is a great level to DCA in spot if it is a project that interests you. To trade, I will wait first for the price action on smaller timeframes.

Are You Scared About Altcoins? Huge Pump Ahead!Hello, Skyrexians!
Recently we focused on Bitcoin and Dominance analysis because it's much more important than analyzing any particular altcoin. Growth on altcoins cannot be counted a right prediction without Bitcoin Dominance drop. Today we are going to look in details on the wave 5 of CRYPTOCAP:OTHERS.D which we have already considered in our previous analysis on the higher time frame.
Today let's take a look at the daily time frame inside the global wave 5. It has pumped in November and it was just the wave 1, which has been finished with the red dot on the Bullish/Bearish Reversal Bar Indicator . As always, alerts from this indicator are automatically replicated on my accounts. You can find the information in our article on TradingView .
This wave 2 has the ABC shape and finally it touched 0.61 Fibonacci. Now it's forming the green dot and if this signal will be confirmed with daily candle close our scenario is likely to be valid. OTHERS.D is going to print the wave C which has the target between 16% and 20%. This is huge potential gains for all altcoins you have.
Best regards,
Skyrexio Team
___________________________________________________________
Please, boost this article and subscribe our page if you like analysis!

LUMIA | GOOD FUNDAMENTALSLumia is a good project, I want to get involved somewhere and blue boxes looks nice.
I don't overcomplicate things and add a ton of dirty crap to my charts, but you can check out the success of my analysis below.
I approach trading with confidence backed by experience and past success in identifying high-probability setups.
While I don’t claim to be the best, my track record speaks for itself, and I strive to let my analysis and results do the talking. Watch these levels closely—markets can confirm what charts already whisper. Let’s see how this plays out together.
My Previous Ideas
DOGEUSDT.P | 4 Reward for 1 Risk much more if you hold it.
RENDERUSDT.P | HTF Accuracy
ETHUSDT.P | Accurate Buyer Zone Identification | High Risk Reward if you hold it.
BNBUSDT.P | Accurate Buyer Zone Identification | High Risk Reward if you hold it.
Bitcoin Dominance | Great Characteristic Detection and Accurate Analysis

AVAX SWING LONG IDEA - ALTCOIN SEASON 2024-2025AVAX is one of the most well-known coins, backed by strong fundamentals. I believe it will perform well during the 2024-2025 bull run.
The price is currently coming from a monthly demand zone, showing solid rejection and strength. It has also broken the diagonal trendline that signaled the previous bearish trend. Both weekly and daily momentum are strongly bullish, further supported by Bitcoin's strength.
I expect a retracement to the weekly demand zone and the maximum discounted area, with a possible retest of the broken bearish trendline. From there, I anticipate a move up toward the targets.
LTF confirmations will be needed to initiate the trade.

DEEP Altcoin on the rise - more gains ahead?At this time, DEEP, a SUI supporting coin is one of the strongest Altcoins in the market.
With BTC at key breakout level, DEEP/USDT could lead to further gains and continue it's trend higher, if it will not break lower. Given the momentum in DEEP, I think we can see 0.1 by the end of the week and further gains in a longer time period.
Always enter at your own risk and remember that investing and trading is risky.
DEEP remains strong.

Polygon's Next Move: Breakout Above $0.388 or Slide to $0.29?Hey trading family! Grab your coffee and let’s dive into what’s next for Polygon (MATIC). We’re at a key level here—if MATIC can break above $0.3881, we could see some real upside. But if it slips below $0.366, we might be looking at a drop to $0.31, $0.30, and potentially all the way down to $0.29.
In this video, I’ll walk you through the technicals and what to expect next. Is MATIC gearing up for a breakout, or are we about to take a detour down? Either way, it’s time to prepare!
If you found this helpful (or just enjoyed hanging out), give it a like, comment your thoughts, and hit follow. Because, let’s be honest, navigating crypto is like trying to drink coffee without spilling—it’s messy but worth it!
Mindbloome Trader
Happy Trading

Solana’s Next Move: Will It Break 163 or Drop to 120? Find OutSolana is at a make-or-break moment. If it can push through 163.25, we could be looking at a run up to 189 and beyond—but if it stays under 157, things could get a little dicey, with a drop to 145 and maybe even all the way down to 120.97.
We’ll break down what to watch for and where the next moves might happen. Solana’s either gearing up for a moonshot, or it’s about to take a nap at 120. Either way, we’re here for it!
If this gave you some clarity (or at least a laugh), don’t forget to like, drop a comment, and hit follow for more updates. Because let’s face it—predicting crypto is like trying to guess when the Wi-Fi will suddenly stop working!
Happy Trading
Mindbloome Trader

#AI, $AI, #AIUSDT, AIUSD#AI ...... is in a very nice entry point and near stop loss to get high profit
#AI
NYSE:AI
#AIUSDT
#AIUSD
#swingtrade
#shortterminvestment
#ALTCOIN
#Cryptotading
#cryptoinvesting
#investment
##trading
#cryptocurrencytrading
#bitcoininvestments
#Investing_Coins
#Investingcoins
#Crypto_investing
#Cryptoinvesting
#bitcoin
#BTC
#BTCUSDT
BINANCE:AIUSDT

ALTCOINS: Time to convert some Bitcoin to alts.The Altcoin market has been noticeably underperforming against Bitcoin since almost the start of the Bull Cycle. Even though both are currently testing the support level of the 1W MA50, Alts (left chart) are closer to the 0.618 Fibonacci level of the prior ATH, while Bitcoin is closer to the 0.236. The lagging tone was set since January 2023 when Bitcoin crossed over its 1W MA50 and formed a Channel Up while Alts stayed under the 1W MA50 and formed a Channel Down. Later the Bitcoin ETF euphoria and then its acceptance, naturally helped Bitcoin more (capital inflows) than Alts.
This is not the first Cycle where we see alts lagging, the underperformance was evident in both 2019 and 2020, with Bitcoin trading considerably higher than the 0.5 Fibonacci level, while Alts traded under.
This underperformance though is an opportunity in disguise and it may be time for investors to convert some of the Bitcoin gains to alts for greater profit % in 2025.
## If you like our free content follow our profile to get more daily ideas. ##
## Comments and likes are greatly appreciated. ##

Token name from you, Analysis with me(6/22/2024)Hi everyone, I hope you have a great weekend.
Last week, this type of post was well received; as I said, I will share a post for your Altcoin analysis request , where you write the Project name and Token symbol in the comment section, and I will then share the token analysis with you.
Please pay attention to the conditions.
For example , write Bitcoin(BTC) in the comment.
Project name : Bitcoin
Token symbol : BTC
A maximum of 20 tokens will be analyzed for you.
Each follower, please register only 1 analysis request in the comment section.
Your token analysis will be shared below your comment .
I hope you are always healthy first and then rich.
Please do not forget the ✅' like(More energy for me) '✅ button 🙏😊 & Share it with your friends; thanks, and Trade safe.
