The Elephant Jungle 2/10/26 Page 6The Jungle is quiet right now. Is this what they mean by the calm before the storm?
Is New York going to bring the energy and wake the Jungle up today? Will there be news that sends the market into chaos, or are we just going to keep flopping around inside this current range?
Either way, it will not take long to find out.
Like always, stay safe out there in the Jungle. Use proper risk management, wait for your levels, wait for confirmation, and do not force trades that are not there.
In the Jungle, survival comes before profit.
ALTS

The Elephant Jungle 2/10/26 Page 5On the 1H timeframe, we just put in a SFP(swing failure pattern), of the 1H high. That makes the 1H low technically weak, which means price should be working its way back down toward that low. The problem is, we have been stuck in this Current Range since Friday.
So far, we have 2 taps at the high of the range and 1 tap at the low. There is the possibility that we put in a 3rd tap and made a Wyckoff Model 2 Distribution already. Visually, it looks like a head and shoulders pattern. But the way this is playing out feels slow. Too slow.
Because of that, I am leaning more toward a Wyckoff Model 1 Distribution possibly playing out, where we sweep the highs one more time and then drop. That idea also lines up with what I would personally like to see, which is a push into the 4H Supply Range followed by a backtest of the Macro Range Low.
But maybe this is not that deep.
Maybe this is just the Bears slow grinding price back down to the range low. Or maybe the Bulls are letting the Bears push it down a bit so they can catch a bounce off the 1H Internal Demand Range or the 15m Order Block and then push price up into the 4H Supply Range, maybe even a little higher.
Honestly, that would not be a bad idea either, especially since the back end of that 1H Internal Demand Range lines up perfectly with the 618 Golden Pocket.
Who knows.
All I know for sure is that price action in the Jungle is real crappy right now, and New York better come with it.

The Elephant Jungle 2/10/26 Page 4As of now, it looks like the Bears are trying to front run the Macro Range Low backtest because price is getting rejected from the 1H Internal Supply Range. That tells us Bears are still active on the lower timeframes.
That said, the 4H Supply Range, which is still confluent with the Macro Range Low, remains fresh. Ideally, I would like to see one more push up into that 4H supply range before another dump. That would give us cleaner structure and a more honest rejection.
But I can hope and wish all I want.
The market is a living, breathing creature in this Jungle, and it does exactly what it wants to do. Our job is not to control it, predict it, or argue with it. Our job is to observe it, respect it, and react when it shows its hand.
In the Jungle, expectations get punished. Awareness gets paid.

The Elephant Jungle 2/10/26 Page 3Let’s break down a few scenarios, because right now the market is not being dramatic. It is being patient.
Scenario 1
Price retraces into the golden or silver pocket (the 618 to 786 zone), for all the Fibonacci and OTE traders in the Jungle, then bounces up toward supply. Personally, I would not trust that move without seeing some type of lower timeframe demand or a clean lower timeframe Wyckoff structure that says it is actually time to turn the boat around.
Scenario 2
Price swing fails the low and possibly prints a divergence on the 1D timeframe. I will be honest though, this one feels like a long shot. If the Bears keep charging with that Big Bear Energy, that divergence will get erased fast and momentum will push lower than the previous momentum low without hesitation.
Scenario 3
Price either continues pushing up from here or completely dumps, wiping out at least the 1W Internal Demand Range. No in between. If the Bulls are about that life, they'll defend it. If not, it gets swept.
Scenario 4
We range. Not exciting, not cinematic, but very profitable. Like I said before, it is easy money. Long the range low, short the range high, and manage risk like a grown adult.
Today might be the day we find out who controls the week. If we close below the previous day’s candle, expect more downside pressure. If not, the Bulls live to fight another session.
Sometimes the market is not setting traps. It is waiting to see who gets impatient first.

The Elephant Jungle 2/10/26 Page 2Zooming into the 1W timeframe, it looks like the Bulls finished last week strong, but the Bears wasted no time starting this week with a push back. Come on, Bulls. This is no time for a water break.
The Bears just put 5 months of damage on that ass and you already want to call timeout? Nah. At least get price back up to the 1W Supply Range, consolidate there for a few days or weeks, then think about pushing higher. That is, if the Bears don't smack you back down for chillin' in their territory.
Because let’s be honest. This 15% bounce back is not enough. The Bears dropped 52% on you from the ATH, and now you are struggling just to get back up and test supply. That is not strength, that is recovery.
At the very least, show some intent. Retest the Macro Range Low. Show the market you actually want re-entry back into the range instead of just popping up and hoping nobody notices.
Alright, let me calm down. It is only day two of the week. Anything can still happen. For all I know, today we get a god candle ripping straight back into the Macro Range. Or maybe we get the devil’s dong straight down to 48.9k. This is the Jungle. Anything is possible.
We could even just chop and consolidate between the lows and the 1W Supply Range or the Macro Range Low for the rest of the week. Not as exciting, but let’s be real, that is easy money. Long the range low, short the range high, and pray when it finally breaks, you are on the right side.

The Elephant Jungle 2/10/26 Page 1Since Friday, February 6th, the Bulls finally started barking back and, more importantly, they followed it up with a bite. As of today, price is up 15.18%. That is not noise, that is presence.
The 1W Internal Demand Range is currently holding as support for the Bulls, but the real question is simple. Is it enough?
Can the Bulls pull the Uno reverse card and flip this month’s candle back to bullish? Can they reclaim price back into the Macro Range and change the entire conversation?
That is going to take real momentum from the Bulls. No shortcuts, no hopium. Still, credit where it is due. After getting trampled by the Bears for almost 5 straight months, the Bulls are not dead. They are alive, breathing, and swinging back.
Now here is the part nobody wants to ignore. The Bulls better hope the Bears did not just step out for a coffee break. If the Bears return with full force, they can easily push price down to sweep the 48.9k low. And if we see a monthly candle close below that level, that is the market clearly telling us that 30k is back on the table.

SOL, Finding support for a bottom?CRYPTOCAP:SOL took a hit last week on the capitulation event, printing a strong bottoming candle with a long lower wick.
Price has now reached my wave 4 ytarget of the 0.382 Fibonacci retracement at the major High Volume Node support, between the S1 nd S2 pivot.
Daily RSI hit oversold, but with no divergence. The trend remains down, below the daily pivot and daily 200EMA, but could be finding a bottom soon.
Safe trading

HBAR Macro Chart, Wave 2 complete, ATH incoming?CRYPTOCAP:HBAR wave C of 2 ended in the expected area, the 0.786 Fibonacci retracement of wave 1, at a high volume node. This is the altCoin golden pocket where low-caps have the highest probability of reversing from. A long weekly lower wick was left on daily bullish engulfing candles.
If that was wave 1 then wave 3 should be powerful and take price into all-time high and beyond, with targets of the weekly R3-R5 pivots, $0.6-$0.8.
Weekly RSI has a little room to push lower into oversold but also gives it roo to produce a weekly bullish divergence. First target s the weekly pivot at $0.2.
Safe trading

ONDO Wave 2 survived, just...LSE:ONDO is having a significant pullback compared to other alts despite the RWA narrative, which is frustrating.
It came just shy of making a lower low, but did not make one, keeping wave 2 alive.
A bottom is likely in on crypto, let's see if Ondo can come back to life or if it shows relative signs of weakness.
Safe trading

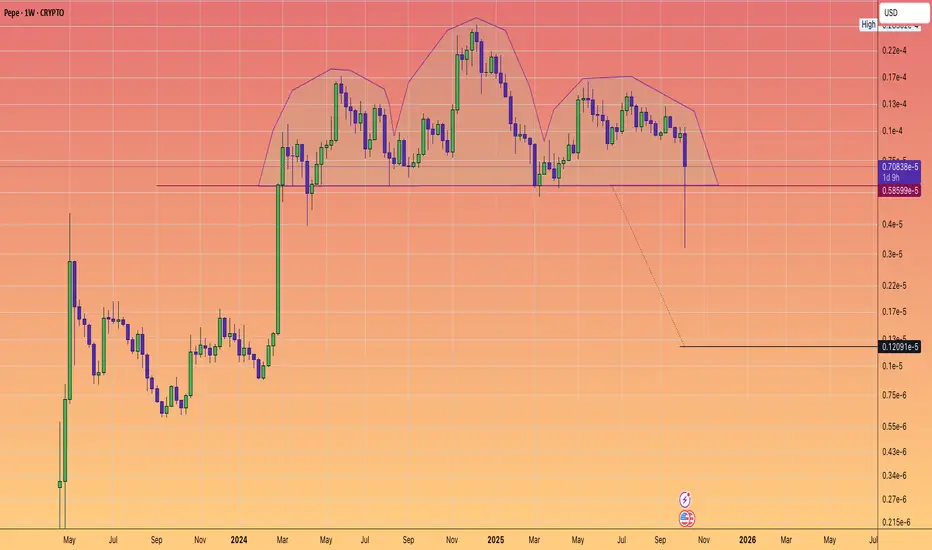
$PEPE: MAJOR HEAD and SHOULDERS BREAKDOWN WARNING.🐸🐸🐸
⚠️⚠️⚠️
Pattern formed, Big Move Ahead?
The weekly chart of #Pepe has confirmed a classic head and shoudlers pattern - a powerful bearish setup.
After over 1.5 years of building this structure, price decisively pierced the neckline with a sharp drop.
Suggesting that a weekly close below the neckline could trigger an accelerative towards the pattern target.
Key Levels
Neckline: $0.0000058599
Target: $0.0000012091
Why does it matter?
Head and shoulders are the most trusted reversal technical patterns. Coupled with declining and weakening sentiment. This pattern warns of more downside--- unless buyers can mount a quick rescue.
What's your strategy?
Are you shorting the breakdown, waiting for the target, or looking for a fake-out reversal?
Drop your thoughts/Analysis or questions in the comments!
AVAX at significant lows, is this the end of AVAX?CRYPTOCAP:AVAX has dropped below its 2021 and 2023 lows without ever attaining a new all-time high. Not good for the bulls.
Weekly RSI still has room to fall, and the next target is the High Volume Node support at $3.49, with no support zones from here until there. This move would likely spell the end of AVAX, after years of weakness.
Weekly pivot and 200EMA is at ~$22 and would need to see that recovered for renewed faith.
Safe trading

AAVE dump may not be over, macro triangle invalidatedCRYPTOCAP:AAVE macro triangle analysis was finally invalidated with the thrust lower. Instead, wave B of an ABC seems to be underway with an initial target of the altCoin golden pocket 0.786 Fibonacci retracement and High Volume Node support, $70.
Weekly RSI has a little room to fall until oversold. There is bullish divergence from July 1st 2024 bottom.
AAVE is again demonstrating its abnormal distribution of price action.
Safe trading

HBAR Wave 2 complete, All time high next stop?CRYPTOCAP:HBAR has finally reached my target, the altCoin golden pocket 0.786 Fibonacci retracement in wave 2, a highly probable area for altcoins to reverse downtrends. It is also a major High Volume Node and the daily S1 pivot.
Weekly RSI has tapped oversold but as a little ways to get in there. Daily RSI is oversold but with no divergences yet.
We need to see the orange trend-line break and the daily pivot hold for confirmation of a reversal. The first target would be the descending daily 200EMA and High Volume Node at $1.4. Getting above this will be very bullish and suggest wave 3 is truly underway.
Wave 3s are the most powerful Elliot Waves and could see price reaching $1+
Safe trading

BNB/USD Main Trend. 11 18 2025Logarithm. Time frame: 1 week.
🔵Main trend: lower zone of the ascending channel As previously shown on HBAR.
🟡🟣Secondary and local trends
There's a pullback to the breakout zone, that is, to the mirror level of the former resistance of the large bowl (currently strong support), meaning the price is retesting the key zone, which are the historical highs of the previous 2021 cycle. This is the same as the 72,000 zone for BTC in the past.
🟣🔄 A breakout of the local designated trend line (purple) is a local trend reversal. But, in general, it's important to understand that this is a retest of the previous breakout zone.
🟢🔄 Confirmation and holding of the price above this zone is astronomical, and any news is just fiction to justify a move into the next zone, already a distribution.
🔴🔄 Failure to hold this zone means a temporary immersion in the previous consolidation.
According to the general market trend (market phase) and the asset's liquidity (money in the project), a chart pattern is formed.
______________________________________________________________________
⚠️ Overall, I think Binance will lose "$ liquidity," that is, users, due to unfair speculative play (controlled by "Big Brother") and a prolonged lack of exchange functionality updates. Perhaps this won't happen immediately, but gradually. But I'm sure many would really prefer not to see this happen instantly. It's unlikely that the exchange itself will survive long-term competition from new exchanges with fresh functionality and "users who aren't offended."
1️⃣ It's worth remembering that the most liquid and popular exchanges in the 2017 cycle were Bittrex and Poloniex. Where are they now? Bittrex is a scam. Poloniex has completely lost liquidity.
2️⃣ In the 2021 cycle of highs, FTX and Binance. The former is a scam. The latter is still around.
0️⃣ The main villain is a scam (everyone understands what, who, and why), which always scams everything monetary for its own interests and monopolizes the "fresh mushrooms" of the market. There is one, which is equivalent to the main "market maker." The one who "created" and "destroyed" dinosaurs from the very beginning, including the MtGox exchange back in 2013, squeezing out "all the available circulating BTC" at the time. This has been his playing field since the very beginning of the crypto bubble.
You're on someone else's playing field, so remember that and accept their rules. You're playing by the rules of those who set the traps for you, bypassing them. These rules have little effect on the masters of the speculative game. Accept the game and the risks, or leave...
3️⃣👀What will happen this time? Which liquid exchange will be "killed" to destroy the dollar in a bear market and trigger a super-negative environment? One can only guess. There are several candidates (as well as highly liquid hyped cryptocurrencies) that could influence the overall trend and shape a certain, extremely pessimistic opinion among the majority. Don't guess, you might miss the mark.
🧠 Therefore, when trading and holding cryptocurrencies and USD, diversify your storage and trading locations.
1️⃣ Cold or hardware wallets (a portion of your funds, if you're a holder, is larger; if you're a trader, it's smaller).
2️⃣ + Liquid exchanges (3-4, two isn't enough, as if one goes to the "other world"), you'll lose 50% of your trading funds, and that's a lot. To recover, you need to increase your capital not by 50%, but by 100%. For hamsters, this is "simple," but for traders, it's not.
⚠️ A paragraph off-topic for trading? A reminder of the most important thing, the safety of your money, is not superfluous. What's the point of earning if you'll lose everything? This is not superfluous for smart people who work and earn, rather than paying the market for their emotions and chatting in chats about how rich and broke they are.
Risk must always be justified and controlled by you. This is the foundation of foundations. If this isn't the case, then you're building a speculative house on a clay foundation, trying only to guess the price. Sooner or later it will collapse, and the later it happens, the more painful it will be.

Perfect Entry LONG for FANTOM (FTM) - BULLISH !Fantom showing tremendously strong buying pressure, with low volumes in its pullbacks.
Now we look for perfect entry from its massive pump by placing buy bids around the 0.618 fib level and 0.5 fib level zone (white box shown above).
TP at the next resistances
Levels are as shown in the charts.

The Elephant Jungle 2/6/26 Page 7Trade safe out there today it's gonna be a long one. Stick to your strategies and watch your levels and wait for confirmations and you will come out a winner

The Elephant Jungle 2/6/26 Page 6On the 15m, market structure flipped bullish and kicked off a demand chain.
Sounds good… but don’t get comfortable.
Price is already struggling to break structure again, which tells me one thing, this move needs confirmation, not hope. Yeah, there might be a long here, but I’m not touching it without checking the lower timeframes.
The 5m, 3m, even the 1m, the lower timeframes Market Structure will tell the real story.
No guessing. No praying.
This is one of those days where the market looks friendly right before it decides who’s paying for lunch. So yeah, it’s going to be an interesting day, like always. Between structure, liquidity, and whatever News decides to drop out of nowhere, anything can happen.
As always:
Use proper risk management
Wait for your levels & confirmations
The Jungle rewards patience…
and it punishes impatience fast.
Stay safe out there.

The Elephant Jungle 2/6/26 Page 5Right now, I’m watching for a long, a little ride up into the 4H Supply Range. But let’s not get reckless. There’s a 1H Supply Range sitting right in the way, and that’s a spot where I’ll happily take some money off the table… just in case the Bears decide they want to dump from there.
Because they might.
Now, if the Bulls are serious, I expect them to push through the 1H supply, sweep the liquidity trend, and then reject inside the 4H Supply Range. That’s the clean move.
If they’re really feeling themselves though..
Then they don’t stop there, they will sweep the liquidity curve and drive price straight into the 1W Supply Range.
Either way, my plan is simple, I’ll ride the Bulls on the way up… and the moment the Bears throw the signal, I’ll be switching sides like it’s halftime.
No loyalty in this Jungle, only signals.

The Elephant Jungle 2/6/26 Page 4On the 4H timeframe, the picture gets a lot clearer. The 4H Supply Range lines up perfectly as the next high probability short, especially with price rejecting off the Macro Range Low. That confluence alone makes this area worth paying attention to.
But if price blows through that 4H supply?
Then we’re likely looking at a liquidity sweep, one last push that runs stops and sucks in late buyers before price drives straight into the 1W Supply Range.
Same idea. Two outcomes.
Either the 4H supply holds and sellers step in,
or it fails, liquidity gets cleaned out, and higher timeframe supply does the real damage.
In this market, levels don’t fail quietly.
They fail violently, and only after taking liquidity with them.

The Elephant Jungle 2/6/26 Page 3With 13 hours left in the day, price is opening up bullish. Maybe, just maybe, the Bulls finally decide to show up. If they do, we could see a short term comeback, possibly even a clean test of the Macro Range Low. And if they’re really ’bout it, ’bout it like Master P, they might even take a swing at the 1W Supply Range.
But let’s be real.
This could just be London handing out a pullback, a clean little setup, so New York Bears can catch the alley-oop, slam price back down, and close the week out bearish. That’s how you get a slow, heavy weekend… and a lot of trapped Bulls. In this market, early strength doesn’t mean control. It means opportunity and not always for the Bulls.

The Elephant Jungle 2/6/26 Page 1.2This PO3 played out very nice even though there was times when we did think it wasn't going to finish

The Elephant Jungle 2/6/26 Page 2The Bulls look like they’re trying to bounce from their second line of defense, the 1W Internal Demand Range. But the real question is simple, is it enough? After 3 straight weeks of hard selling into this zone, I can see price ranging here for the rest of the month. That’s a realistic outcome. The Bulls will finally gets a chance to breathe. But if this Demand Range fails? The next area that actually makes sense for a real swing reaction is the 1M Internal Demand Range, sitting right around 30K.
And yeah, that’s a big gap in between.
So let me answer the question I already know you’re asking:
“Red, are you sure there’s nothing price could bounce from inside that gap?”
Short answer: yes, there could be demand there.
On a smaller timeframe, there’s a chance some demand formed during the pump. But let’s be honest, would you really trust a tiny block of demand when the Bear Train is moving at 200 MPH? Anything is possible in this market. But that kind of demand? That’s not something I’d bet on for a swing. At best, it’s scalp material, in, out, and gone. Because when momentum is this heavy, the market doesn’t respect hope. It respects size, structure, and time.

Let’s zoom out and look at the bigger picture for Bitcoin.After this week’s sharp drop, Bitcoin likely needs time to cool off and move sideways. BTC is sitting at a major support zone around 60K, which won’t be easy to break. Could we eventually see another capitulation toward the 40K or even 30K range? And will Bitcoin make a new all-time high in the future? Time will tell.
