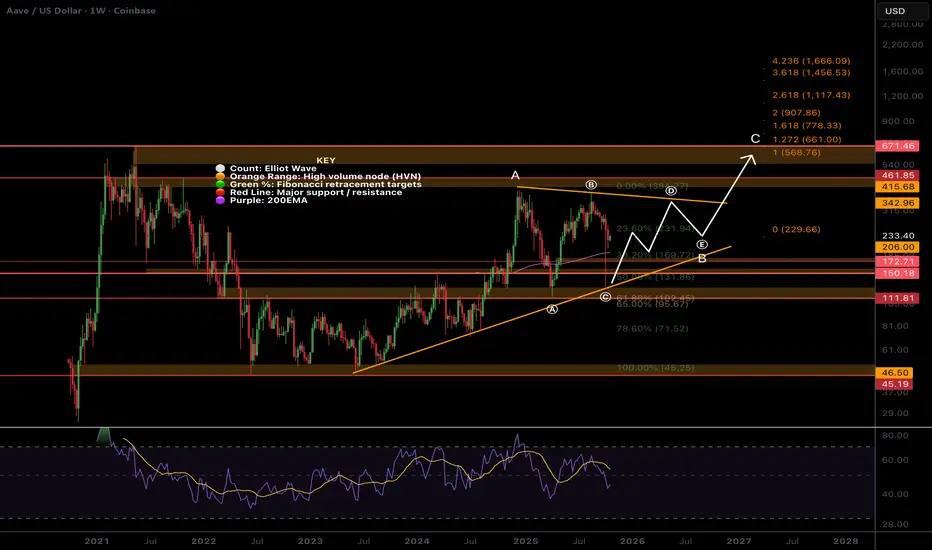
AAVE Macro changed... Another huge triangle?EURONEXT:AAVE macro has changed with the recent price action. We appear to printing a multi-year macro triangle in wave B, with wave (C) now complete on last weeks wipeout.
Price touched the S1 pivot and High Volume Node support just above the golden pocket.
Weekly RSi still has room to fall with no bullish divergence yet. The next longer term target will be the pivot point and the top of the first wave of wave D, $260, followed by the triangle upper boundary at ~$340. Breaking out of the triangle has a first target of the all time high at $670. Not what AAVE investors want to see but still a x3 from here.
Price is above the weekly 200EMA but only just.
Analysis is invalidated if we fall below wave (A), $102 and will liley see a slow death to $45 if this happens.
Safe trading
ALTS
Your Token, My Analysis — Let’s Do This!Hey Traders!
Hope you're all enjoying an amazing weekend !
Want me to analyze your favorite token next?
Just drop your request below using this format
Request Format:
Project Name: Bitcoin
Token Symbol: BTC ( BINANCE:BTCUSDT )
Important Rules:
I’ll analyze only the first 10 requests.
One request per person — so choose wisely!
I’ll reply directly under your comment .
If this sounds good, smash that Like button , Share with your friends , and let’s find the next big move together !
Here’s to your success — health, wealth, and great trades!

Bitcoin dominance showing a VERY different market cycle BULLSIH
As ever.yjr chart says it all but why am I posting this on a Saturday night in Europe ?
Because something is going to change soon.......and I have no idea in which direction BUT.............
As you can easily see, in the previous 2 cycles on this chart, were we had a tangible Bitcoin dominance over other crypto assets, that dominance fell dramatically as we approached Bitcoin All time highs after Bitcoin Halvings.
As we see, for the 2017 BTC ATH, we had a 61% drop in BTC.D and then a recovery to the next halving.
From that Halving to the next ATH in 2021, we had a near 37% Drop in BTC.D
Many people, including me, have been saying how different things are this cycle and this is shown very clearly with the BTC.D this cycle.
Just see the difference on the chart. Since 2023, a slow, steady, near unstoppable climb
And IF the current ATH in BTC is the Cycle High, then we need to see that BTC.D is NOT in a negative number but is in fact OVER +5% higher than when the halving took place.
YES, we have had a drop from a higher % to this current level but it is NOTHING as much as previous cycle.
SO, the question is now, Is this the Cycle TOP ?
We will not know until the moment has passed. but even to see a -30% would see Bitcoin entering a price range that is HIGHLY unlikely now.
It is the Failure of the ALTS to take peoples money that has led to this and the reason for this is simply that BITCOIN is now regarded as a Real, proper asset class.
It has Matured.
It is utter DOMINANCE over its Rivals.
So, what now ?
We wait and see if we are entering a BEAR Market, in which case, the ALTS have had their day and sadly, will dwindle away and some will remain, fighting each other for a small part in the Market. Some WILL Dominate others and I think we all know which they are.
Maybe things will move and money will flow out of BTC into ALTS...but we have already past the time period where this has happened after a halving.....
When BTC enters a Bear, so do the ALTS>.
Maybe we will not see a BEAR this Time.
Things ARE different on so many fronts......
But ask yourself......Can you see the corporations selling 100's of Bitcoin now or after we see antoehr ATH ?
That would maybe reduce BTC dominance over other assets in Crypto...but -30% ?
NO WAY

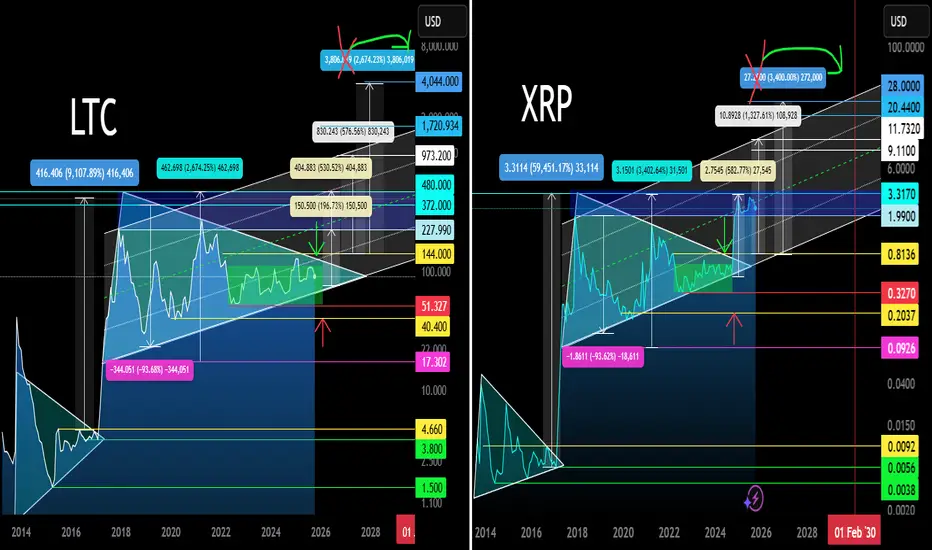
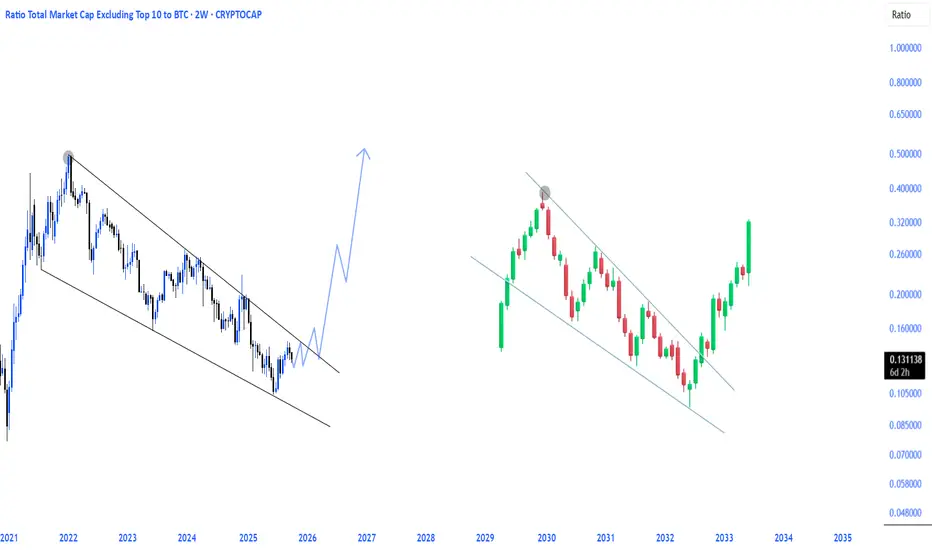
LTC and XRP Fractals. Main Trend. Triangles 10/18/2025Logarithm. 1-month time frame. Larger time frame for comparison and clarity. XRP is ahead of LTC by 1 year, where a breakout of the 7-year formation and the first wave of strong price growth (pump impulse of 500-600%) have already occurred. There will be 3 of them.
🟣⚠️ But, perhaps a retest of the formation's breakout zone, based on a super-fabulous and funny story, will happen very soon from a trend perspective. This is, more accurately, a retest of human intelligence worldwide, the clarity of common sense (perhaps there will be no reaction, and the scenario will fail to capture the public's attention), which could impact speculative markets as a whole.
In general, cryptocurrencies like Litecoin (scam protection) should be of interest to those with common sense but who understand that trading isn't their thing. You buy in increments and forget about it. That is, for investors... Perhaps it would be of interest to positional traders (trades once a year or several months) after a breakout on a pullback, or trigger trades on breakouts of local zones.
An idea for comparison that could impact your trading strategy. Don't be confused by the large percentage pumps in 2017 to initiate the formation of the triangles of these 7–8 years. Cryptocurrency in the "reset waves" has long been redistributed. However, this doesn't negate risk management, not like some silly “book” that says to squeeze your coins out of you in reversal zones, but rather as common sense and math dictate. Also, set reasonable targets, depending on the timeframe of your trading strategy, for liquidity accumulation levels and those willing to sell. Don't set limit orders in round numbers, either sell or buy.
🟡 On Litecoin cryptocurrency, the price is still trapped , ahead of a potential breakout (highly likely). It's possible they'll make a false takeout and accumulate long liquidity under the 7.8-year formation before breaking out of the triangle, but that's not a given.
LTC ETF to be adopted in the US later . But overall, everything will be fine. Currently, with the price clamping down (over the last six months), we've seen high network activity and an increase in the number of addresses (the banking sector is “testing” + a little large capital) without price growth or positive news. Of the top cryptocurrencies, LTC is currently an underdog, which is logical, as positions are being built up in a local trend after a major redistribution (change of hands). This is a good sign.
🟡 Work in the secondary trend I'll publish later, possibly a public idea. However, here I've shown the maximum targets for both an upward breakout (more likely) and a downward breakout (rare, perhaps, perhaps liquidity accumulation).
A chart pattern (trends, figures, fractals, patterns) is formed according to the general market trend (market phase) and the asset's liquidity (money in the project). What is a projection (paragraph below).
The price movement direction is determined by:
1️⃣ real supply/demand for the "commodity."
2️⃣ manipulative supply/demand.
3️⃣ intellectual degradation of market participants and their control and predictability.
4️⃣ intellectual “insight” into how things “should” or “shouldn't” be. This is usually the result of points 2 and 3 (the formation of a dominant opinion), and very rarely a personal opinion that can be used to develop one's own trading tactics and money management.
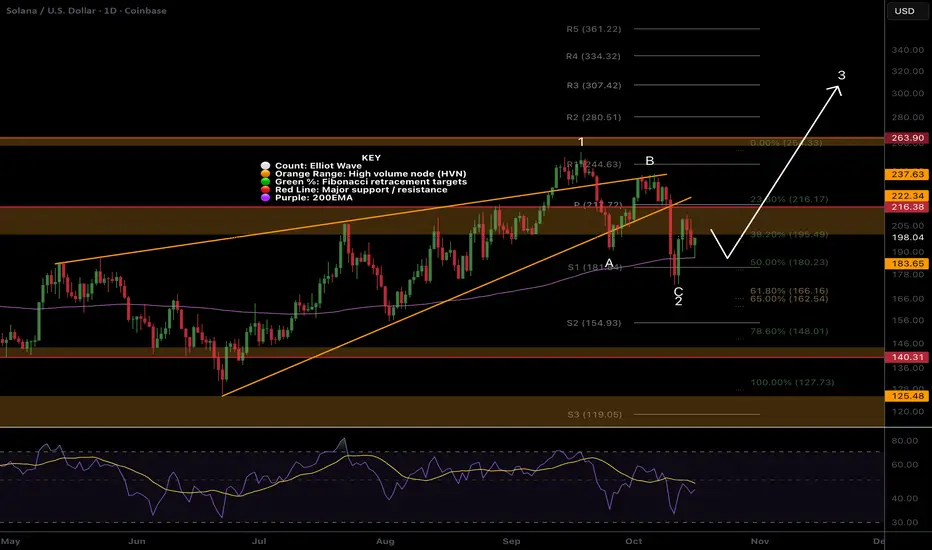
$SOL at major resistance, bottom is in?CRYPTOCAP:SOL bottom appears to have printed a text book ABC correction for wave 2 ending with a swing below the daily 200EMA and S1 pivot, front running the Fibonacci golden pocket.
However, Solana is at major resistance now and being rejected. RSI did not have bullish divergence or reach oversold so traders should be cautious.
Its holding up much better than most alt coins after Friday...
A bottom may be found at daily 200EMA and wave 3 may begin...
Safe trading
HBAR, hit the Golden pocket target ive discussed!What a mess Friday turned out to be with a recording breaking liquidation event with the numbers still growing - bigger than FTX!
SUNK COST FALLACY: THE DAMAGE IS DONE, DO NOT PANIC IN AND OUT OF POSITIONS.
So many alt-coins proved there is nothing but thin air holding them up - no real demand whatsoever! I'll take a look at some charts today. Now these wicks can be classed as 'anomalies' in technical analysis but in this case i think we've revealed some of the strong tokens now with real backing.
It is expected that with such large wicks we at least test the centre of the wick on one more terrifying shake-out that isnt actually as bad as the one we just has but feels it because traders and investors are been kicked while their down in a state of panic.
-------------
The WXY wave 2 complex correction has seemingly completed just above the golden pocket mentioned in previous analysis as target for any deep pullback.
But we are now in a bearish structure and we should be cautious. Just ahead lies the quadruple resistance, S1 pivot, 200EMA, major High Volume Node and channel boundary bottom.
Its typical for price to pullback into the wick to smash the fear into weak hands before flying up in a wave 3 to new al time highs. The S3 pivot is the target $0.15 adn I will look out for longs here.
RSI does not have bullish divergence but did bounce from oversold.
Safe trading

AAVE local whats next? Total alt-coin leverage wipeout!What a mess Friday turned out to be with a recording breaking liquidation event with the numbers still growing - bigger than FTX!
SUNK COST FALLACY: THE DAMAGE IS DONE, DO NOT PANIC IN AND OUT OF POSITIONS.
So many alt-coins proved there is nothing but thin air holding them up - no real demand whatsoever! I'll take a look at some charts today. Now these wicks can be classed as 'anomalies' in technical analysis but in this case i think we've revealed some of the strong tokens now with real backing.
It is expected that with such large wicks we at least test the centre of the wick on one more terrifying shake-out that isnt actually as bad as the one we just has but feels it because traders and investors are been kicked while their down in a state of panic.
-------------
Price printed a topping wedge, broke down, tested as resistance and dropped. The drop was likely anyway but the extent of systematic failure made it worse.
Aave did not penetrate the lows of the larger range and found support in the High Volume Node all the way back to the 0.5 Fibonacci retracement and is now back testing the daily 200EMA as resistance.
Wave 2 is likely complete. We probably visit the wick on a scary candle to $209 High Volume Node before finding a bottom for a huge wave 3 of 3 move up to new highs! A likely scenario now that we have shaken out all the weak hands.
These events often mark the bottom. Daily divergence is not oversold or has bullish divergence yet. The macro structure is still in tact!
Safe trading

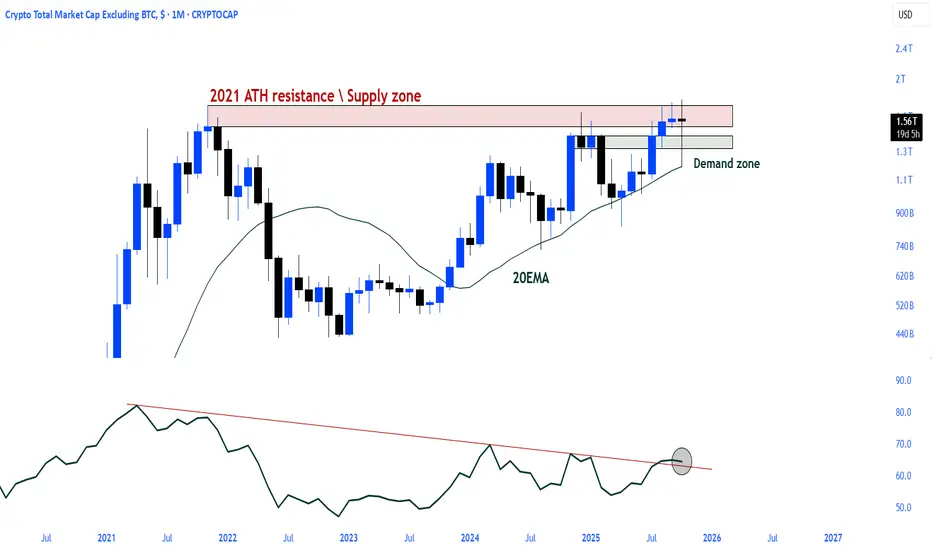
Total2 \ Altcoins The Big picture hasn't spoken yet.
Short term fear and noise cannot overshadow the upward trend in the long term.
The 1M chart still shows a bullish trend.
The 2021 ATH resistance and major supply zone were tested in November 2024 but rejected. Following this rejection, the market entered a broad correction phase.
The subsequent recovery saw the price retest the 2021 ATH level but was rejected once again.
Nevertheless, the retest of the demand zone formed after November 2024 and the EMA20 region indicates that the structure remains strong.
SUI Still holding up strong!Price has still not reached the 0.5 Fibonacci retracement and appears to have been front run. Wave (4) is intact but no higher high since then is a cause for short-term concern. A triangle could be forming, or an expanded flat correction! Time will tell…
Price is below the weekly pivot, RSI is negative with room to fall and no bullish divergence forming. Further downside brings up the S1 weekly and major High Volume Node support at $1.4-1.6 range.
Wave (5) has a minimum target of the R4 weekly pivot at $13.1.
Safe trading

HBAR Reversal time?My long-term golden pocket target has finally been reached leaving a long lower wick behind as demand soaked up the drop. Price is likely to retrace into the middle of the wick and find its final support if the move was truly the wave 2 bottom!
If we go lower the ‘alt-coin golden pocket’, 0.786, sits at the major High Volume Node support and would be a great buy as well as a good spot to look out for longs.
Weekly RSI has room to fall but bullish divergence is forming!
Wave 3 has a minimum expected target of $0.65 aligning with targets from the standard deviation bands above. Wave 5 has a minimum target of $0.75
Safe trading

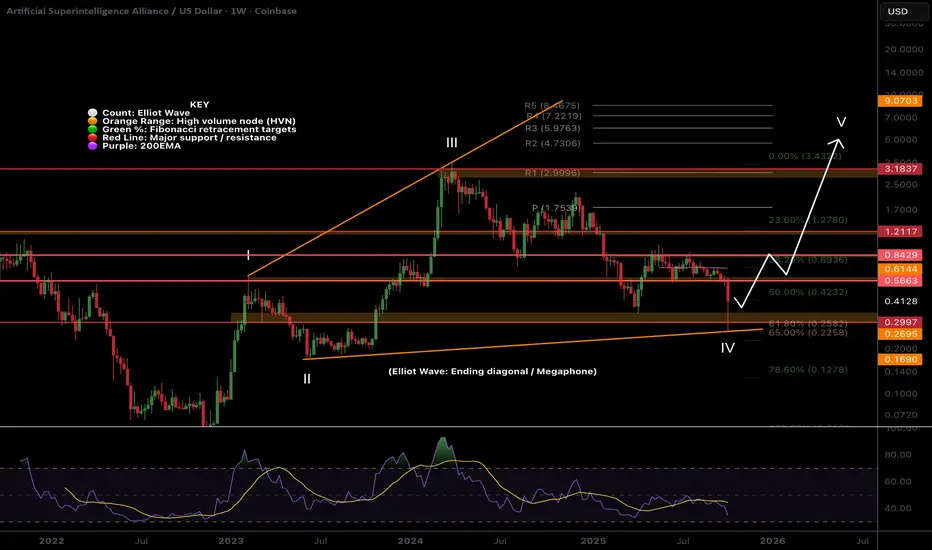
FET extreme opportunity zone!NYSE:FET wave IV megaphone pattern is still in play despite the lower low and is invalidated only if we get blow wave II at $0.1685. This is a complex Elliot wave structure where investors and traders get trapped easily!
Weekly RSI now has bullish divergence forming but is not yet confirmed. Price found support at the major High Volume Node and Fibonacci Golden Pocket, a high probability reversal area!
Wave V has an expected target of the R2 weekly pivot at $4.73 but can over-extend in an exuberant market conditions.
Fetch had one of the largest runs last year offering a 56x from a swing below the SD-3 green opportunity band zone. When an asset moves with such momentum to the SD+3 threshold (where it is expected to spend <1% of the time) momentum is found in the opposite direction and gives way to extreme undervaluation! This is were we strike!
Price has now reached the opportunity green band zone once more quickly catching a bid of 20% as of writing. Price is expected to spend <5% of the time in this zone offering investors a short window of opportunity. It can go lower of course but there is a good chance a bottom is formed in this area! I intend to buy here and I am looking out for longs which give me larger position size than buy and hold due to the nature of the risk management.
Price targets for fair value, where we expect price to return to at least, is currently at $0.60. Another irrational alt-season with backed momentum could see a new all time high towards the $5 range and I will take profits at each band threshold along the way!
#OTHERS.D ~ Do you believe in Castles in the SKY?I believe that the Others dominance metric divided by an ounce of real money #Gold gives us a valuable insight into the fabled altseasons.
Because as this chart shows theres only been 4 in actuality
and you normal get a double bubble in a cycle.
So I believe we are at the cusp of turning things around as most people have given up on the concept of altcoins ever pumping again.
But it was just the business cycle #PMI that has depressed prices for the past few years.

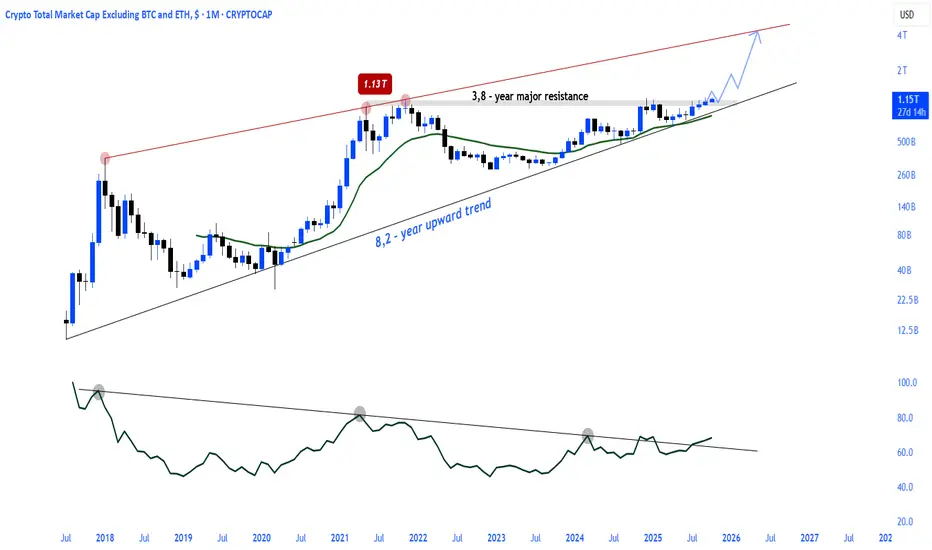
The Altcoins Momentum Period Begins.- Almost 4-year major resistance and breakot
- Major breakout in RSI
- 8,2 -year rising trend
Altseason 🔃💹
ASTER - UPDATE: #aster- update:
Main trend = bearish at the moment 📉
Double bottom possible on the 1.520 - 1.500$ support.
Bull div RSI also spotted.
Short term:
I expect to see spùe bullish reaction here, toward 1.750 - 1.80 or even 1.850$ resistance.
If bears break under 1.50$, that would be pretty bad and further dump toward 1.30$ support could be see. ⚠️
Keep an eye on the upper downtrend H4.

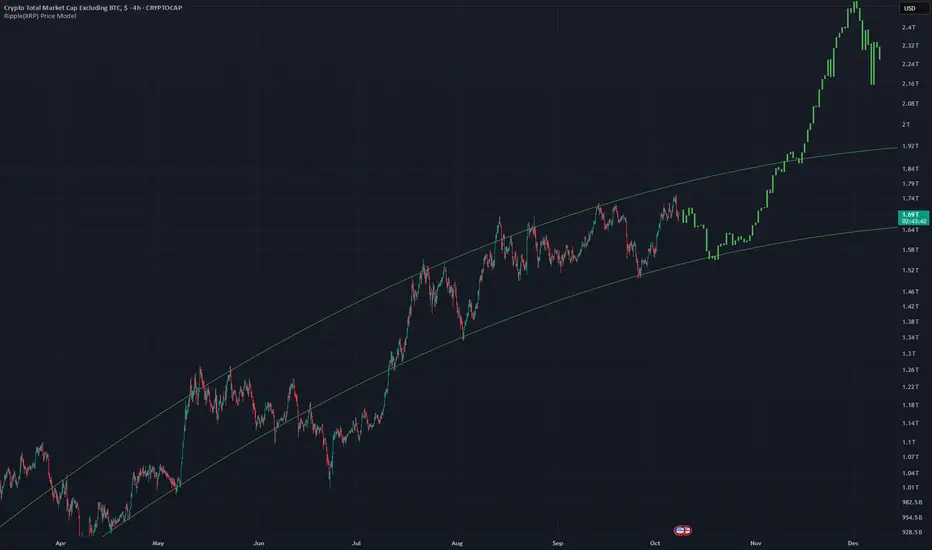
Just before the Altseason.The big picture is becoming clearer in the TOTAL2 and TOTAL3 charts.
The upward trend that began from the 2022 lows has finally reached the critical resistance/supply zone and is gathering strength in this area.
A breakout from this zone and sustained movement above it will trigger a parabolic expansion wave for altcoins.

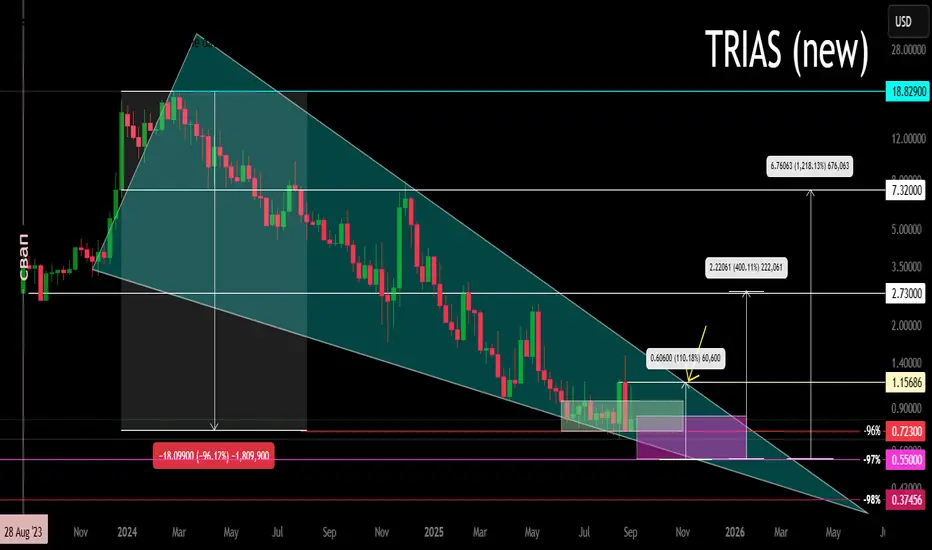
Trias Token (New, after rebranding) Secondary trend. 10 2025Logarithm. 1-week time frame for trend visibility. Relevant for those trading on DEX exchanges, particularly Uniswap or PancakeSwap. A fractal structure is evident when compared to the entire chart history for this project, before and after the swap (find it yourself and compare).
For the new coin after the swap (the chart I provided here), a descending wedge is forming in the secondary trend (the entire history after the coin swap), and a sideways price movement with reduced volatility has begun. In other words, this is a hypothetical accumulation zone. For money management and risk control, I also showed where the price could theoretically fall (optional). Percentages are provided for clarity, from key support and resistance zones to the main areas of previous consolidation.
A breakout of the wedge (its resistance) — the potential for a sideways move with a wider range, or a transition to the participation phase, where all of the percentages shown (up to 7.32, no higher, and above that, you shouldn't care) are highly likely to be reached (the general market hype and the altseason, which no one believes in anymore, but it's inevitable).
The basis for trading such low-liquidity assets is risk control and diversification of similar assets.
1️⃣ For example, from your total deposit, you allocate 5-10% of your funds to trading such high-risk (low liquidity and lack of top centralized exchanges), but potentially highly volatile, due to low capitalization and liquidity, assets.
2️⃣ Select similar assets for trading - observe 20-50. Observe and study what seems most interesting and promising to you.
The most important things to observe are:
➖ This is the potential future traffic of "dumb money." How much new users are pumping Twitter, Telegram, and other social networks. The size of the crypto community. This is essentially the most important thing. How will these people be steered toward buying low-liquidity cryptocurrency during the alt season, which means a large pump.
➖ Buying volume from time to time during consolidations in the lower price zones.
➖ Declines from the high and the market phase and the corresponding phase of the cycle the coin is in. There are high zones and low zones. You should only be interested in the low zones. Anything that has been pumped up should not interest you.
➖ The project's legend , its imitation, and its support in the community. The project creators' activity.
➖ Chart logic and the overall market phase directly influence the altcoin's price. This is key, but people often forget it. A patient and consistent person will be rewarded; a restless person will not.
3️⃣ Of these coins to watch, you select 10-20 to trade and work with them, distributing your funds among key zones. Don't buy with all your allocated funds, but distribute them among key zones and trading situations (breakouts, declines). This is the key difference between a trader and a mere hamster.
Control your risks and stick to your trading plan. Don't get caught up in market and news noise, which shapes opinions and the illogical actions of the majority, which are doomed to lose in the future.
TOTAL2 - Break Out of Curved Channel Price has been moving up along this channel for awhile now and it is now time to break out of it.
This is the 4Hr chart for the altcoin market. A similar pattern occurred on same chart months ago and the bars pattern (in green) is the result of the curved channel breakout.
Lets see what happens.
REZ - BULLISH WAVE LOADING!! AMEX:REZ - bullish 📈
Daily view looks set for a 50%+ run from this breakout point ! 🚀

Altcoins are heading toward a parabolic phase.Same setup, same chart, different story, different market
Silver laid the foundation for a parabolic run after breaking through a 3.8-year major resistance level.
The altcoin market cap TOTAL3 similarly broke through a 3.8-year major resistance level.
NASDAQ:ALTS \ TVC:SILVER
Altseason 🔃💹

OTHERS BTC We are heading towards an epic process in terms of altcoins.
The Altseason spark will be ignited following the breakout and retest of the descending wedge pattern in the OTHERS / BTC pair.
CRYPTOCAP:OTHERS / CRYPTOCAP:BTC 💹
Altcoins VS. SilverSimilar technical structure in two different markets
Price and RSI are breaking above the major resistance level together.
Altcoin market cap (Total2) and silver chart, with the same supply zone and RSI breakout pattern, show a structural bullish signal.

BTC.D - Signaling Third Altseason BTCdominance is beginning to break down suggesting BTC has reached a peak or is nearing and movement will be favored for alts.
My target for BTCD is 50% as price along this MA line has seen strong confluence
lets go alts!

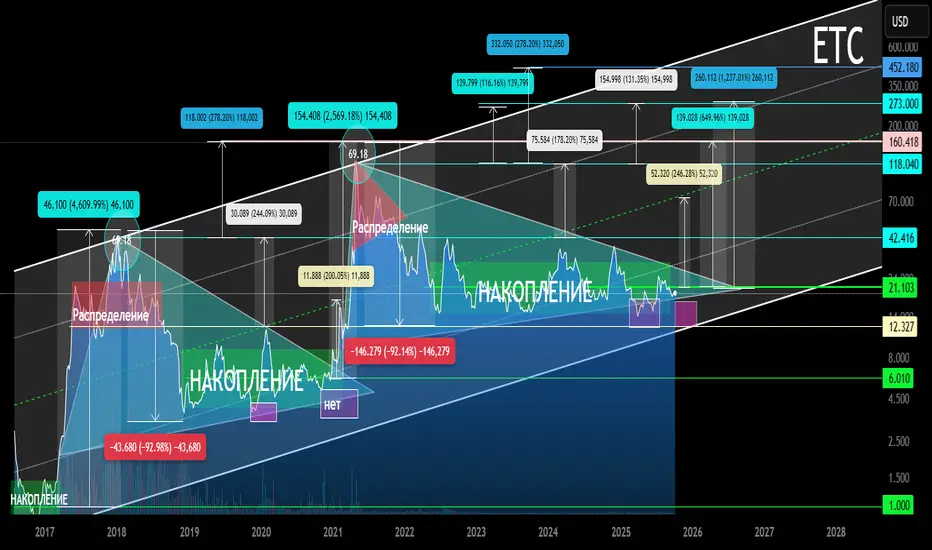
ETC Main Trend. Ascending Channel (all time) 10 2025Time frame: 1 week. Logarithm.
🔵Main trend: ascending, rising channel, since the inception of cryptocurrency.
🟡Secondary trend: descending, transitioning to a sideways trend (#accumulation), and forming a 4.9-year symmetrical triangle.
🟣Local trend: descending, trapped in the corner of a large triangle and “tension” consolidation before exiting.
Manage your risks and stick to your trading plan, don't get caught up in market and news noise, which creates dominant opinions and illogical actions by the majority, who are doomed to lose in the future.
Everything will be as it usually is with assets (stocks, less so cryptocurrencies. These are just a few examples of how these aren't real assets, but imitations of usefulness, i.e., a complete scam market). These assets have maintained an upward primary trend for a long time (from the very beginning), and huge, multi-year patterns form near dynamic support. That is, an upward breakout may initially throw passengers under the market , or some fictitious cryptocurrency events before a price rise (on a large time frame) don't be alarmed; ignore them, or use this opportunity to reduce the average price of the overall position. Or rather, before a dominant trend change, the "point of no return."
A striking example of this is XRP with its huge triangle and its exit (the first wave +600%, which is a capitulation on profits, or, in slang, a "hamster pump"). Then there will be 2-3 waves of price growth pumps, with each consolidation in the trend being "buried" and the cry "all is lost." In the final wave, possibly with spikes as before, a full-fledged #distribution zone will form.
XRP/USD Main Trend 07 2022
The market is simple at its core, but complex due to the interactions between people and their capital. The combination of simplicity and complexity creates many variations that you can exploit to profit from it. Your success and understanding of this determines your profit or loss in speculative markets.
You can complicate things without understanding their simplicity, which looks ridiculous from the outside. Playing smart. Or, conversely, simplifying complex, often false, concepts so that everything becomes clear and understandable. Simplicity is the essence of complexity.
In any activity, you should not pursue complexity to achieve the desired result, but rather simplification and optimization, so that you can achieve the same or better results with less effort and risk.
The entire secondary trend and this triangle with a local denouement zone in it.
Your trading plan and risk management eliminate all worries, indecision, emotional outbursts, predictions, and other people's right and wrong opinions.