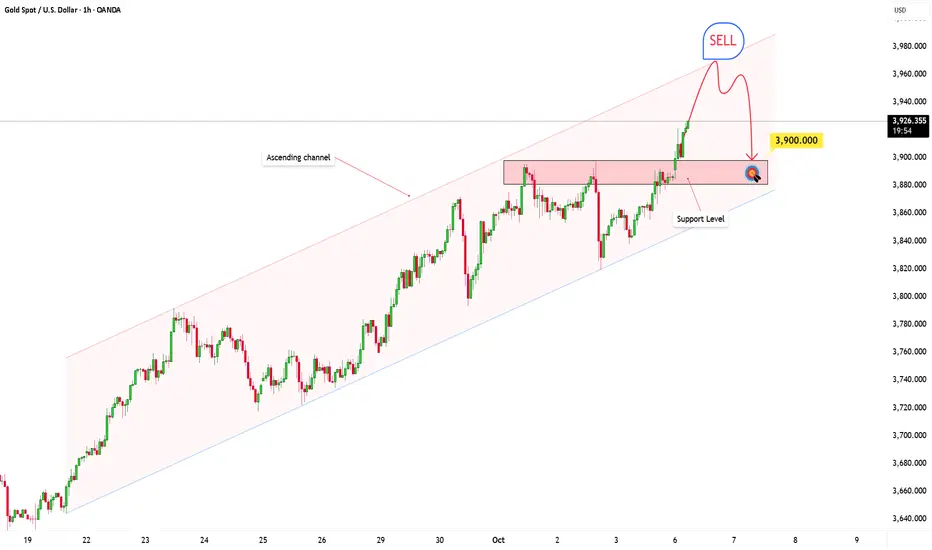
Gold Technical Analysis – Is a Pullback Coming?XAUUSD is currently moving within a well-defined ascending channel, and the price is testing the upper boundary. This area acts as a dynamic resistance, and if the price gets rejected here, we could see a mild pullback back toward the support zone around 3,900.
If buyers manage to defend this support, the bullish structure remains intact and gold could attempt to push higher again. On the other hand, if support breaks, a deeper correction toward the lower boundary of the channel is possible, creating potential short opportunities for traders waiting for the right setup.
To identify an optimal entry point, watch for confirming signals such as a bullish engulfing pattern, long rejection wicks at support, or a sudden surge in buying volume. Risk management should always be your top priority. Make sure signals are clearly confirmed and apply a solid risk management strategy before entering a position.
What’s your take on this? Share your thoughts and strategies in the comments! And don’t forget, discussions in the TradingView community are a great way to sharpen your trading skills and grow together as traders.
Alyanalysis
SOLUSDT Strong Rejection at Key Support – 230.00 Incoming!Hey everyone, Ken here!
SOLUSDT has been quite interesting lately. After a sharp decline from the channel’s top, the price broke through the support zone, often referred to as the neckline, and reached a key support area below. Here, we saw a strong rejection wick, which clearly indicates that buyers have stepped in and are ready to take control of the market.
With this setup, I predict that the 230.00 level will be a reasonable target in the short term. The strong rejection at this support zone suggests a high potential for a reversal.
Feel free to leave a comment if you agree with this prediction, or if you have a different perspective. Let’s discuss and share our ideas!

ETH Analysis: Deeper Pullback in PlayETH is still trading within a broader uptrend channel, but recently, the price has started to pull back after a significant rally. After pushing up too far, the market is now taking a breather and recalibrating.
From a technical standpoint, this pullback is completely normal and healthy after such a strong move. Pullbacks like this are part of any bullish trend, providing the market a chance to reset. If the pullback continues, the next target could be the 3,600 support area, where multiple key factors converge: horizontal support, trendline support, and the 0.618 Fibonacci retracement level.
The 3,600 level is crucial. If ETH holds strong here and shows signs of a reversal, it could be a solid entry point for the next leg up. However, if the price breaks below this level, we may see deeper downside, and the current bullish structure could start to break down.
As always, confirm your setups before entering and make sure your risk management is solid. Stay alert for the next opportunities!

USDCAD: A Sell Opportunity You Can't MissLooking at the USDCAD chart, we can see that price is moving within a descending channel with lower highs. Currently, price is testing the upper boundary of this channel. In the past, sellers have successfully defended this level multiple times, and the current market structure suggests we may see another rejection here.
If that happens, setting up a short position would be straightforward. Our target would be around 1.38150, a reasonable objective based on this setup, where a price retracement or even a strong decline could occur. The current trend remains bearish, and in descending channels like this, going with the trend is generally a better strategy than fighting it.
Until buyers convincingly break this descending channel, sellers remain in control, and the opportunity to trade with the trend is still very clear.
Do you see it this way as well?

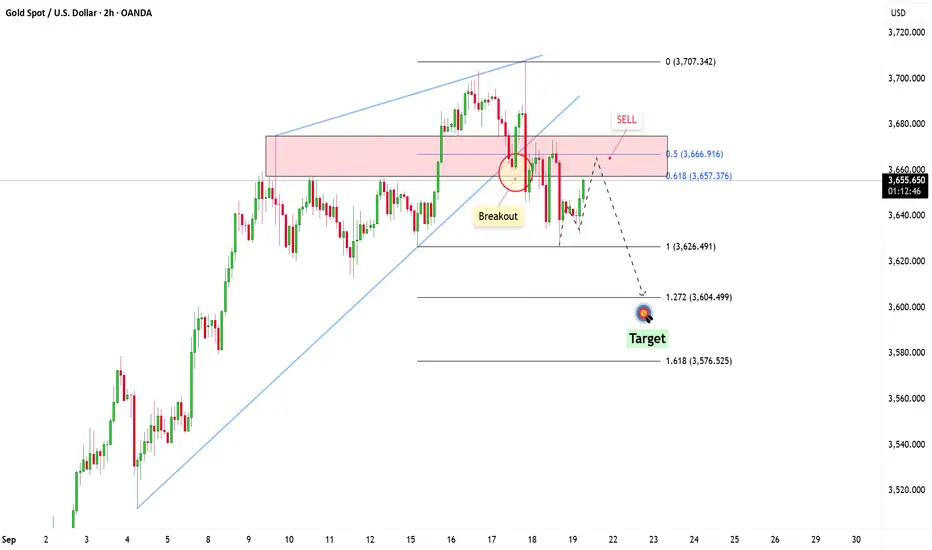
Gold Under Pressure - Is the Downtrend Just Beginning?Hi everyone, it’s Ken!
On the 2H chart, after careful observation, we can see a RISING WEDGE pattern forming. After XAUUSD broke the previous uptrend and completed its correction phase, there's a high likelihood that a new bearish trend will emerge, continuing the short-term downtrend we've seen recently.
Ken's target is to push the price below 3,630, aiming for a further low at 3,608 – this level perfectly aligns with Fibonacci 1.618.
What about you? Do you think XAUUSD will continue to drop, or is there a chance for a reversal to the upside? Share your thoughts and targets in the comments!

Gold Faces Major Resistance: Is a Sharp Decline Imminent?Hey everyone, looking at XAUUSD today, I noticed something quite interesting. Gold has reached an important resistance level, one that in the past has acted as a strong barrier, pushing the price down. This area has also been a strong supply zone, where sellers have previously taken control of the market. Therefore, it becomes a "hot" spot for those looking for shorting opportunities.
If the price starts showing bearish signals, such as rejection wicks, bearish candlestick patterns, or signs of weakening buying pressure, I think there's a good chance we could see a drop towards 3,604, and possibly even lower to 3,5XX if the selling pressure remains strong. However, if the price breaks this resistance clearly, the bearish outlook might be invalidated, and we could see a further rally.
This is just my personal view on the support and resistance levels, not financial advice. Always double-check your signals and ensure proper risk management.
Good luck with your trades!
HBARUSDT: Ready for the Next Bull Run to 0.27430!The HBARUSDT market is looking incredibly bullish! We've just seen a strong shift from a downtrend to an uptrend, creating a perfect opportunity to go long.
The price has broken through a key resistance level, then pulled back to retest it – a textbook breakout & retest setup. This highlights the strength of the bullish momentum.
Now, with the price rejecting that level and turning it into new support, this is a strong long signal with the next target in sight!
My target is 0.27430. Let’s get ready for the next move!

XRPUSDT: A Long Opportunity You Can’t MissXRPUSDT is looking pretty interesting right now. The price has broken through the nearest resistance level and has come back to retest it. Classic breakout and retest setup.
The price got rejected from that level, turning it into a new support zone. This is a solid long signal. My target is 3.3828.
What do you think?

EURUSD Strengthens in Upward Channel: Next Target at 1.19850?Hello everyone, Ken here!
Looking at the current market, it's clear that EURUSD is moving within a strong upward channel. This trend is not only clear but solid, with the next target around 1.19850, a crucial level at the upper boundary of the channel. This gives us confidence that the bullish trend will continue in the near future, though we still need to watch out for some factors.
While the main trend is leaning towards the buyers, we know the market never moves in a straight line without adjustments. A short-term pullback could happen, and this would present a great opportunity for us to enter, especially if strong bullish candlestick patterns, like engulfing candles, appear to confirm continued buying strength. If the price breaks above recent highs, it will further reinforce the bullish momentum, pushing EURUSD toward the next target.
However, as we know, nothing is certain. If the price breaks below the lower boundary of the channel, we’ll need to reassess the bullish outlook, as this could signal a potential change in the trend.
Remember, what we share here is just our personal opinion—not financial advice. Always double-check your setups and manage your risk carefully before making any trading decisions.

Gold Ready for the Next RallyOver the past few sessions, I’ve observed gold consolidating within a Symmetrical Triangle after a strong bullish move. From my experience, this pattern often represents a “pause for breath” before the market resumes its primary trend.
What caught my attention most is that price has just broken above the upper boundary of the triangle, signaling a clear breakout. That said, I won’t be rushing into a trade. I always prioritize safety, so I’ll wait for price to retest the breakout zone. If the former resistance holds as new support and shows strong rejection, that will be my ideal entry point.
Based on my projection, the upside target for this setup is around 3,720 USD. For risk management, I would place the stoploss either below the lower boundary of the triangle or just under the breakout zone, depending on risk appetite.
On the H2 timeframe, this Symmetrical Triangle setup looks highly reliable since it aligns with the broader bullish trend. If the breakout holds, I believe gold still has plenty of room to climb higher.

GBPUSD – Buyers Are Gaining Momentum!OANDA:GBPUSD Looking at today’s chart, it’s hard to ignore the strength of GBPUSD. Price continues to climb steadily within a rising channel – a clear sign that momentum remains with the buyers.
The recent break & retest was the highlight: price broke above resistance, pulled back to test it, and then bounced higher. A textbook setup that reinforces confidence the uptrend is far from over.
The next destination? The upper boundary of the channel around 1.3700. If buying pressure holds, GBPUSD could very well extend into another strong bullish leg.

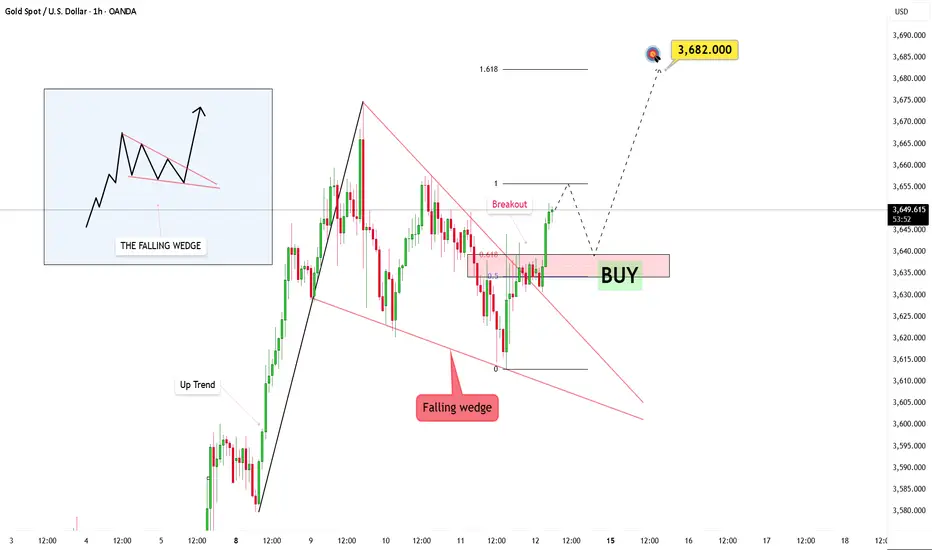
Gold Analysis: Falling Wedge Breakout and Bullish ForecastOANDA:XAUUSD The market is clearly forming a falling wedge, and recent price action suggests a potential shift is on the horizon. Price has begun breaking through this downward structure, which could be the early signs of a strong bullish move.
I’m waiting for the price to retrace back to the broken trendline. This will act as a confirmation, filtering out any false moves, while a retest of the structure will solidify the validity of the breakout. From here, my target is 3682.
The key now is to watch the pullback. If the market returns to the trendline with rising volume, it will add weight to the bullish case.
This trendline breakout is more than just a signal – it’s a story in the making. It represents a shift, and with the right volume, structure, and timing, this could be the start of a larger bullish phase.
XAUUSD Looks Ready for a Big MoveHey everyone, Ken here!
Looking at the XAUUSD chart today, I see a lot of interesting things. The price isn’t rushing upward, but moving step by step – almost like buyers are slowly taking control.
Personally, I won’t jump in just yet. I’d like to see a clear rejection first. If that scenario plays out, my target would be around 3,683 .
What really matters here isn’t just the number, but patience. I’ll wait for price to return to the marked level, then watch volume and candlestick patterns for confirmation.
What about you? Do you think this setup makes sense? Share your thoughts in the comments!

ETHUSDT in Strong Uptrend: What's Next?Hey everyone, what do you think about ETHUSDT?
ETHUSDT is currently moving in a strong upward channel, hovering around 4427 USD, with a 1.85% increase on the day. This rally is driven by strong institutional inflows, favorable monetary policies, and the continuous development of the Ethereum ecosystem. Technical indicators such as the EMA 34 and EMA 89 continue to support the uptrend, especially as ETH breaks through short-term resistance levels.
With the current momentum, ETH could aim for a target of 5400 USD in the near future, if the buying pressure remains steady. If you're watching ETH, this is an ideal time to consider potential trading opportunities.
What do you think about ETHUSDT? Is this upward trend sustainable? Feel free to share your thoughts and join the discussion on ETH's potential moving forward!

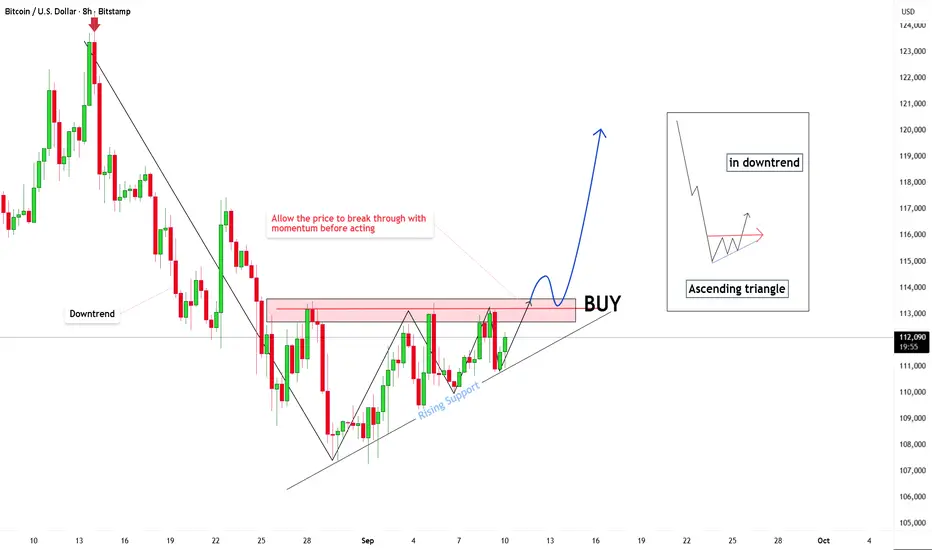
Unlocking the Power of Ascending Triangles in Bitcoin Trading!Hello everyone! 👋
In this analysis, we will explore a popular technical pattern in Bitcoin trading called the Ascending Triangle 🔺 . This is a useful tool that helps us identify potential trading opportunities, especially when the market is in a consolidation phase. Let's dive deeper! 🚀
1. Ascending Triangle Pattern 📊
An Ascending Triangle forms when the price consistently creates higher lows but faces resistance at a fixed price level. This indicates that buyers are in control, but the market needs a strong push to break through the resistance.
2. How to Identify and Read the Pattern 🔍
Higher Lows : In an ascending triangle, the price's successive lows create rising support levels. This shows increasing buying pressure and indicates that the price can’t drop below the established support. 📈
Horizontal Resistance: The resistance level is the area where the price fails to break through for an extended period, creating a horizontal line. For Bitcoin, the current resistance level is 113,000 USD. 🚧
3. Trading Strategy 💡
Wait for a breakout: This pattern typically leads to a breakout when the price exceeds the resistance level. However, it’s crucial not to enter the trade immediately when the price approaches resistance. You should wait for confirmation when the price breaks through the resistance and is followed by a strong candlestick. 🕯️
Enter after confirmation: When the price surpasses the resistance with high volume and a strong candlestick, that’s the ideal time to enter a buy position. This reduces risk when trading. ✔️
4. Support and Resistance Levels 🔄
Resistance: The current resistance at 113,000 USD is critical. If the price breaks this level, we can expect a strong bullish movement. 💥
Support: If the price fails to break through the resistance, keep an eye on support levels like 110,000 USD or lower. When the price returns to these levels, look for signs of a recovery to find a potential buying opportunity. 💪
5. Risk Management ⚖️
Use Stop-Loss: To protect your capital, place a Stop-Loss below the nearest support level. This helps minimize risk if the price doesn’t move as expected. 🔒
Reasonable Profit Target: Set your profit target at the next resistance levels, such as 113,000 USD, 115,000 USD, and even 120,000 USD, which is currently in focus. Always control the risk-to-reward ratio in every trade. 🎯
6. Conclusion 🎓
The Ascending Triangle pattern is a powerful tool for identifying trading opportunities. However, it’s important not to rush into a trade but to wait for confirmation from the market before making a decision. Always remember to manage risk appropriately and follow your trading strategies.
Now, it’s your turn to apply this knowledge in practice. Please like this post if you’ve understood everything and are looking forward to the upcoming lessons—it will be a huge motivation for me. 👍
Wishing you all the best on your journey to becoming an expert! 🌟 Trade safely! 🛡️
XAUUSD – Is a Reversal Coming?Gold is approaching a key level in the Crab pattern and may face a short-term reversal. The current price around 3,635 USD might struggle to break through the resistance level. According to the analysis, gold could potentially pull back to support levels at 3,560 – 3,440 USD.
👉 What do you think about the current situation of gold? Will the price reverse before continuing the upward trend? Share your thoughts in the comments!

Market Tests Strong Support – Target 0.7984OANDA:USDCHF The market has dropped significantly recently and is now testing a strong support level, which I’ve been watching for a while. This support level seems to be causing some interesting price movements. As the price stabilizes in this area, I’m starting to think about the opportunities it might offer. This could be a good time to enter, using both candlestick patterns and volume behavior to guide the decision.
Target 0.79840
What do you think? Feel free to share your thoughts in the comments! Joining the TradingView community can help improve your trading skills.
This isn’t financial advice, just sharing my thoughts on the chart. Trade safely

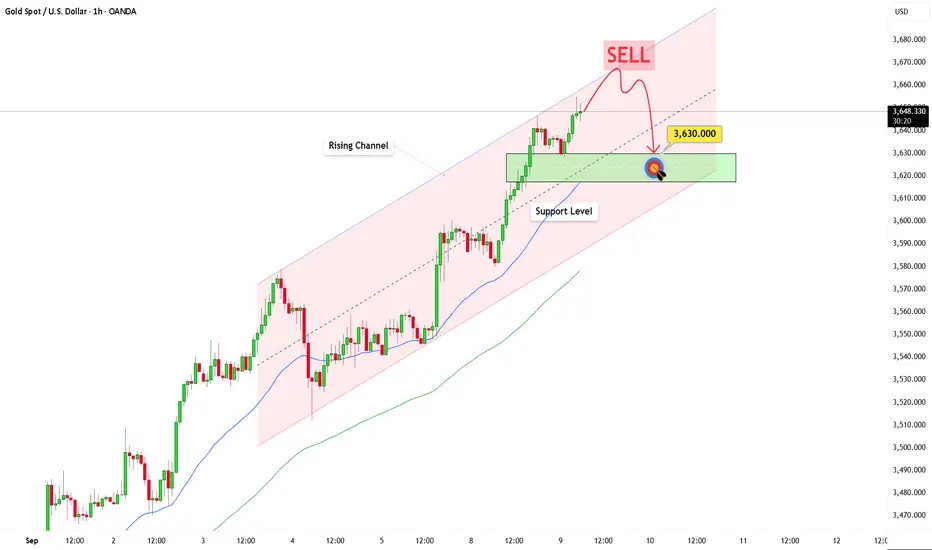
Gold Technical Analysis – Is a Pullback Coming?Hello everyone, Ken here!
Looking at the chart, gold is still trading within a clear rising channel, but the price has now moved up to the upper boundary. This is an area where profit-taking pressure often appears and can act as dynamic resistance.
If buying momentum weakens, the market is likely to see a short-term correction toward the support zone around 3,630 USD. If buyers defend this level, the bullish trend can continue. On the other hand, if support is broken, gold may retreat further toward the lower boundary of the channel.
The key is to watch candlestick signals and volume at these critical levels. Careful risk management should always be the top priority before making decisions. Trade safe!
DEXEUSDT.P | Strong Bottom Formation: Is $17 Really the Target?Today's analysis is for #DEXEUSDT.P, friends! 🔍📊 We're seeing another solid bottom formation here. The minimum target is around $15.40 🎯.
To be honest, I’ve been waiting for the $16.5–$17 range for a while, and with this move, it might get there quickly 🚀.
Why? Because sellers above have already been cleared out, and I don’t expect heavy resistance until around $16.4 ⚔️.
Also, the funding fee looks quite attractive 💰 — so if you're into swing trades, holding the position while keeping an eye on funding might be a smart move 🧠.
But for scalpers or those who prefer lower risk, $15.40 is a solid short-term target 🟢.
Wishing you a day full of green candles! 💚📈
Manage your risk, stay in the game! 🎯🔥
#AlyAnaliz #TradeSmart #CryptoVision #DEXEUSDT #Binanciega

#GRASSUSDT.P - Reversal Signal from the Bottom: Target 1.72! Hey folks! Today I'm here with a trade on #GRASSUSDT.P. There’s not much to say, but to sum it up — a bottom formation has formed, and our LONG target is in the $1.69–$1.72 range.
Good luck and may your days be filled with green candles! 💚
Manage your risk, stay in the game! 🎯🔥
#AlyAnaliz #TradeSmart #CryptoVision #GRASSUSDT #Binanciega

#DEXEUSDT - Will the Delayed Correlation Work Again? Hey friends, 🌟
I’ve been battling an illness lately, so I haven’t been able to share many analyses—sorry about that! 😷 But I’m back today with a fresh new analysis.
Today's focus: #DEXEUSDT 🔍📊 Stay tuned for the details!
#DEXEUSDT | A Unique Correlation Unveiled! 🔍📊
Looking at the #DEXEUSDT chart, it may seem a bit complex at first. However, I’ve discovered a delayed correlation with another coin—#BROCCOLIF3BUSDT. 🍀📈 These two coins exhibit a positive correlation, but #DEXEUSDT follows BROCCOLI with a delay. This means #DEXEUSDT tends to mirror BROCCOLI's movements after some time.
This correlation helps us see the bigger picture more clearly. The sharp downward movement in the past (highlighted in the left red box on the chart) represents a Supply-Demand zone, meaning the price is likely to retest this area before making a decision. For #DEXEUSDT, this critical level is around $18.
🔹 Primary Target: $18
🔹 TP1: $16.555
🔹 TP2: $16.800 - $17
Additionally, we’re observing a bullish flag formation. 🚩 The potential breakout level currently stands at $15.40, though this may shift over time. A confirmed breakout and retest would make a long position a safer bet.
Let’s see how this multi-layered analysis unfolds! 🚀
Stay green & trade smart! 💰🌱
Manage your risk, stay in the game! 🎯🔥
#AlyAnaliz #TradeSmart #CryptoVision #DEXEUSDT #Binanciega

#TUTUSDT.P | Is the Drop Deepening?#TUTUSDT.P
Looking at the chart, I expect the price to hover within a range for a while before making sharp downward moves. As shown in the visual, I anticipate the price to fluctuate between $0.043 - $0.038, then break the $0.037 - $0.037 levels and quickly test $0.032 and $0.027 levels.
However, before the major drop, I believe the price will give us another opportunity to enter a short position. Therefore, I have set my short position target at $0.038 after opening it at $0.043.
May our trades be profitable, friends! 🚀📊💰🔍⚡⏳
Manage your risk, stay in the game! 🎯🔥
#AlyAnaliz #TradeSmart #CryptoVision #TUTUSDT #Binanciega

#MEWUSDT - Recovered after the sell-off, is the drop coming? Hey folks! 🚀
Today, we’re diving into the analysis of a highly volatile coin. Our special guest for the day: #MEWUSDT.P! 🔥
Looking at the #MEWUSDT chart, we saw a sharp pullback from $0.00300 after facing strong selling pressure, dropping all the way down to $0.0026. Right now, it's making a correction before what looks like another potential drop. 📉⚡
I'm eyeing an entry around $0.0028, but knowing how the market loves to hunt stops, I've also placed sell orders at $0.0030 and $0.0031—just in case. Gotta stay one step ahead, right? 🎯🔥 (Let’s not even get into the stop hunting madness! 😅)
Kept the chart clean and simple, with clear targets marked. Let’s hope this trade turns out nice and green! 💰🚀
P.S: Friends, just a quick reminder; please don’t focus too much on the stop loss value in my analysis. It’s just there to show that I entered a short position. 😊 Those who know, know, but let’s remind those who are seeing it for the first time!
Drop your thoughts in the comments, let’s discuss! 🔍⚡
Manage your risk, stay in the game! 🎯🔥
#AlyAnaliz #TradeSmart #CryptoVision #Binanciega #MEWUSDT
