Amazon - A quite boring new all time high!🎈Amazon ( NASDAQ:AMZN ) is simply heading for new highs:
🔎Analysis summary:
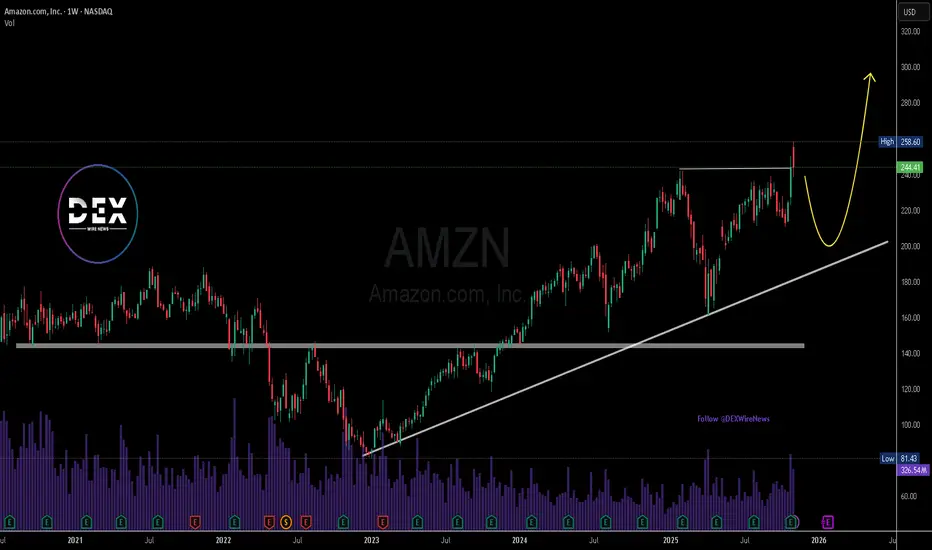
For the past couple of months, Amazon has overall just been consolidating. But in the meantime, we witnessed a major bullish break and retest and an expected rally of +50%. Following this quite slow behavior, Amazon will also slowly create new highs.
📝Levels to watch:
$250
SwingTraderPhil
SwingTrading.Simplified. | Investing.Simplified. | #LONGTERMVISION
Amazonlong

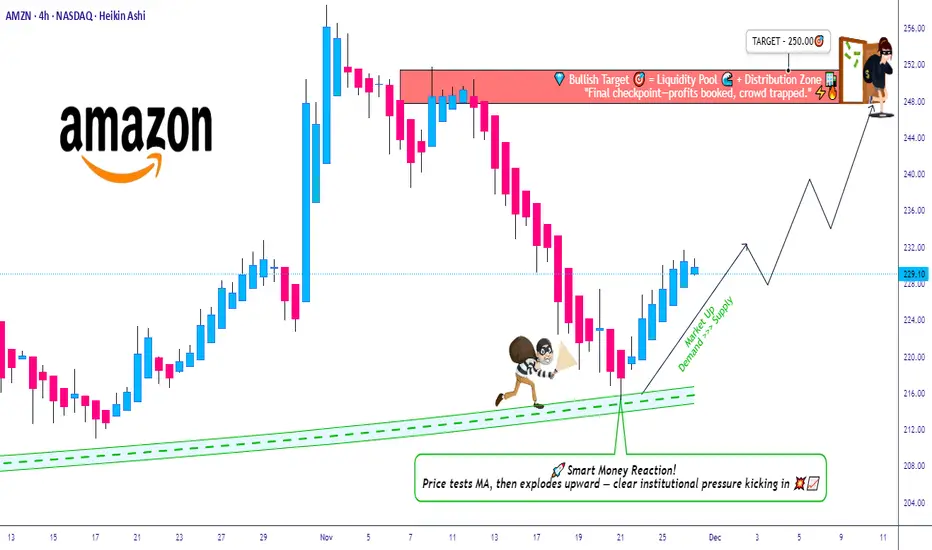
AMZN Breakout Reload? TMA Pullback Shows Buyer Strength🔥 AMZN Swing Trade Profit Playbook | Bullish Pullback + Thief Layering Strategy 🟢📦
Welcome back, Ladies & Gentlemen — the Thief OG’s 😎🕵️♂️
Here’s a polished, rule-friendly breakdown of the bullish setup developing on AMZN (Amazon.com Inc.) – NASDAQ.
📌 Market Context
AMZN is showing a clean bullish pullback into the Triangular Moving Average (TMA) zone, supported by a Heikin Ashi Doji Reversal, signaling that buyers are gaining strength and attempting to dominate momentum again. 📈🔥
🧠 Trade Plan (Swing Trade)
Plan:
A bullish pullback strategy confirmed by:
🔺 Triangular Moving Average pullback reaction
🟩 Heikin Ashi reversal-doji indicating potential trend continuation
📊 Buyers stepping in with momentum recovery
🎯 Entry Plan – Thief Style Layering (Multiple Limit Orders)
This is the famous Thief Strategy — using layered limit orders to scale into the move like a master of stealth 😎🕵️♂️💼
(TradingView-safe version: purely educational, optional, trade at your own risk.)
Layered Buy Limits:
🟢 215.00
🟢 220.00
🟢 225.00
🟢 230.00
(You may increase or adjust layers based on your own style and risk tolerance.)
🛑 Stop-Loss (Thief Style Educational Version)
SL Zone (Optional):
❌ 210.00
⚠️ Note: Dear Ladies & Gentlemen (Thief OG’s), this level is NOT a recommendation — it’s just part of the thief-style educational breakdown.
Choose your own risk plan, trade your own analysis.
🎯 Target Zone
The “Police Force” 🚓 — aka strong resistance, potential overbought zone, and liquidity trap area — sits around:
🟡 Target @ 250.00
⚠️ Note: Dear Ladies & Gentlemen (Thief OG’s), this is NOT a fixed TP recommendation.
Manage your profits as per your own risk appetite and strategy.
📡 Related Pairs to Watch (Correlation & Market Behavior)
Watching correlated tickers helps understand broader tech-sector sentiment and liquidity rotation.
Here are the key names to keep an eye on:
📌 NASDAQ:AAPL (Apple Inc.)
Strong correlation with AMZN in tech-momentum cycles.
When AAPL shows bullish continuation, AMZN often follows with similar pressure.
📌 NASDAQ:META (Meta Platforms Inc.)
Tracks consumer-tech spending sentiment.
Strong META moves can hint at acceleration across NASDAQ growth stocks.
📌 NASDAQ:MSFT (Microsoft Corp.)
A heavyweight pillar in NASDAQ.
MSFT strength boosts overall tech-index bullish bias.
📌 NASDAQ:QQQ (Invesco NASDAQ-100 ETF)
The main sentiment gauge.
If QQQ remains above its trend structure, AMZN's bullish continuation gets stronger confirmation.
📌 NASDAQ:TSLA (Tesla Inc.)
Not directly correlated, but impacts NASDAQ volatility dynamics.
High volatility in TSLA often ripples into liquidity behavior across the index.
💬 Final Thoughts
This AMZN setup blends structure, momentum, and multi-layer entries, crafted in a fun Thief-style teaching format while keeping everything compliant and research-focused 📚✨
Trade smart, manage risk, escape with profits when the “police” show up 🚓😆📈
✨ “If you find value in my analysis, a 👍 and 🚀 boost is much appreciated — it helps me share more setups with the community!”
⚠️ Disclaimer
This is a Thief-style trading strategy presented just for fun & educational purposes only.
Not financial advice. Do your own analysis and manage risk responsibly.
#AMZN #Amazon #SwingTrade #NASDAQ #BullishSetup #PullbackStrategy #HeikinAshi #TriangularMovingAverage #ThiefStrategy #LayeringEntries #TradingEducation #StockMarket #MarketAnalysis #TradingViewCommunity #EditorPickReady 🚀
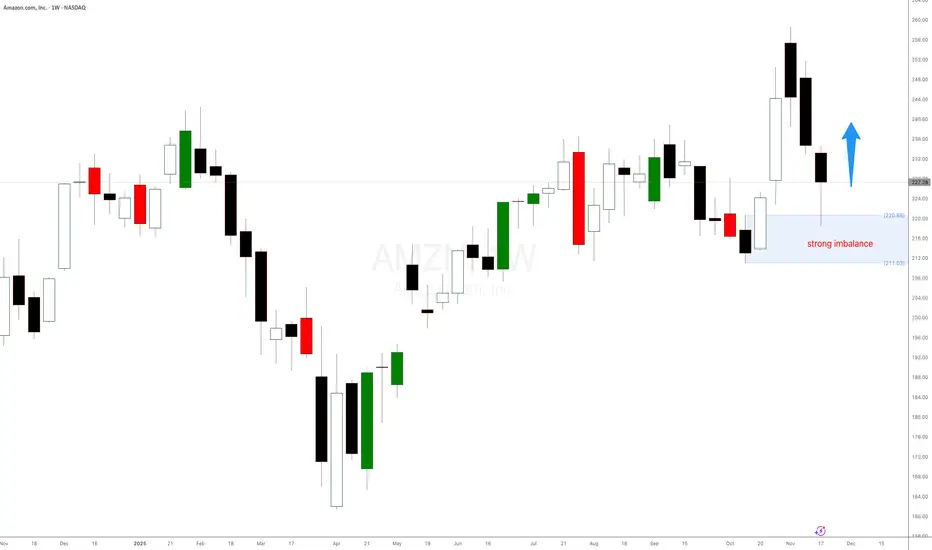
Amazon $AMZN weekly demand level at $221 is holdingAmazon weekly demand level at $221 is holding as expected. Amazon stock is trying to to print a new weekly high. Any long positions should be managed. Waiting for new imbalances and weekly highs.

Live trading on Amazon stock.Live trading on Amazon stock.
Price is at the bottom of its channel and sitting in a strong demand zone.
Follow proper risk and money management.
This is just my personal view, so please trade based on your own strategy and trading system.
Follow me on TradingView for more analyses and live stock trades.
NASDAQ:AMZN

Amazon stock weekly demand is still in controlAmazon stock weekly demand at $221 is still in control and is trying to play out as expected. Any long positions should be managed. Let's see if there any new bullish legs printed in the following days.

Amazon.com Inc.( $AMZN) and OpenAI Deal Reignites AI Momentum Amazon.com Inc. (NASDAQ: NASDAQ:AMZN ) gained 1.77% to close at $233.22 as investors reacted to its landmark $38 billion cloud deal with OpenAI. The agreement gives AWS a pivotal role in powering OpenAI’s future models, marking one of Amazon’s most significant AI infrastructure wins to date. The deal spans seven years and includes access to large-scale Nvidia GPU clusters—an essential component for training and deploying advanced generative AI models.
The partnership comes as Amazon accelerates its push to re-establish AWS leadership in the competitive AI cloud segment. For years, OpenAI relied almost exclusively on Microsoft Azure. The shift signals a broadening of OpenAI’s compute strategy and reinforces Amazon’s long-term commitment to expanding its high-performance AI capabilities. AWS leadership noted that its infrastructure is specifically optimized to support demanding AI workloads at global scale, while OpenAI called the partnership a meaningful addition to the broader compute ecosystem.
Strong fundamentals support the bullish outlook. Amazon’s Q3 results highlighted renewed AWS momentum, with cloud growth once again becoming a focal point of investor confidence. AWS remains Amazon's most profitable segment, and securing OpenAI positions it more competitively against Microsoft, Google Cloud, and rising GPU-focused providers.
Long-term performance metrics also reinforce Amazon’s resilience. While the stock is up just 6.30% year-to-date, its three-year return of 148% significantly outpaces the S&P 500. Amazon continues to invest aggressively in logistics automation, advertising, robotics, and AI-driven cloud capabilities—areas expected to drive sustained revenue expansion.
Technical Analysis
AMZN remains bullish, currently trading at $233.22. The chart shows price respecting an ascending trendline, offering structural support near $190–200. A key resistance zone sits near $258, the previous swing high. A breakout above this level could open the path toward $260+. Support remains at $200, with deeper support around $185 if retracement occurs.

Why os Amazon $AMZN rallying?Why os Amazon NASDAQ:AMZN rallying? Amazon st. The strong weekly demand level at $231 per share is still in control. Rallying as expected. Long positions should be managed.
Hopefully, Amazon stock will continue to rally. These imbalances are great for stock swing trading, bullish stock option strategies and intraday stock trading once the imbalance gains control.

Amazon (NASDAQ: $AMZN) Expands AI Power With $50B GovCloud PushAmazon (NASDAQ: NASDAQ:AMZN ) is strengthening its position in the AI and cloud infrastructure race with a massive pledge of up to $50 billion to expand supercomputing capacity for U.S. government agencies. The investment focuses on building advanced AWS data centers across Top Secret, Secret, and GovCloud regions starting in 2026, adding nearly 1.3 gigawatts of AI and high-performance computing power. With more than 11,000 government customers, AWS aims to widen its lead as AI competition intensifies across cloud providers.
Industry analysts note that Amazon has lost some ground in AI-specific cloud growth to rivals like Google and Oracle. As companies such as Microsoft, OpenAI, and Alphabet pour billions into AI infrastructure, Amazon’s scale-driven investment is a strategic move to ensure AWS remains the backbone of government AI systems.
The new capacity will support federal agencies with a full stack of AI tools—including Amazon SageMaker, Amazon Bedrock, and foundation models like Amazon Nova and Anthropic Claude—allowing them to build customized AI solutions at scale. Analysts expect the U.S. government to accelerate AI adoption as part of its race to maintain technological leadership over China.
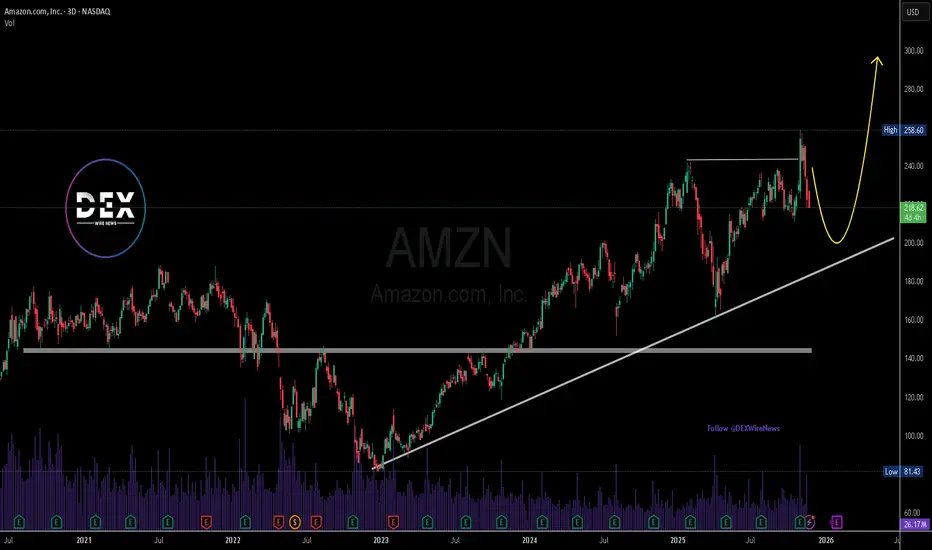
Technical Outlook
AMZN is currently pulling back from the $258 resistance, forming a healthy correction toward the $232 support zone, which aligns with a weekly demand level. Bulls will look for a strong reaction here to retest the $258 high and potentially break above it.
A failure at $232 exposes the ascending trendline support that has guided Amazon’s uptrend since early 2023. The RSI cooling off suggests this is a normal correction rather than a trend reversal. If support holds, upside targets between $280–$300 remain valid, matching long-term Fibonacci projections.
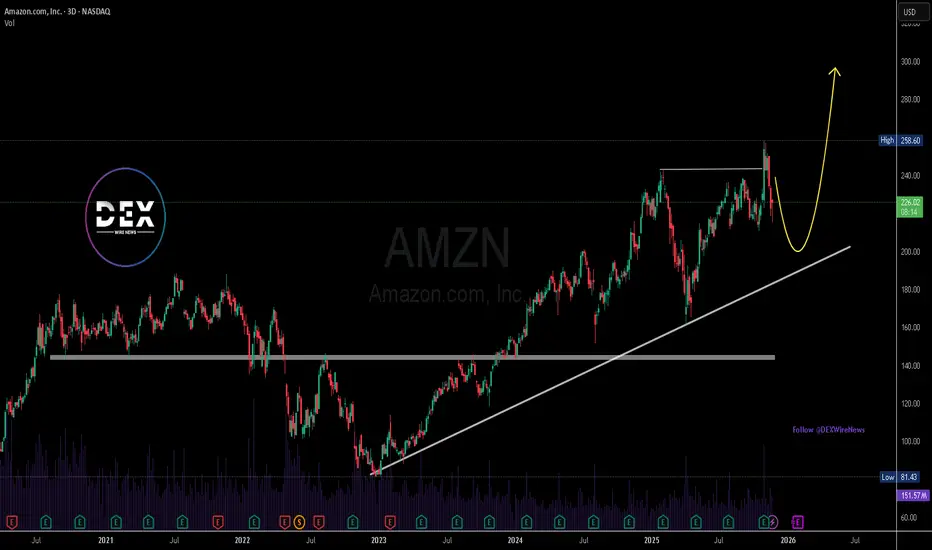
Amazon(NASDAQ: $AMZN) Invests $3B in New Mississippi AI Data HubAmazon.com (NASDAQ: NASDAQ:AMZN ) announced plans to invest at least $3 billion in a new data-center campus located in Warren County, Mississippi. The project will support Amazon Web Services’ expanding AI and cloud-infrastructure needs, reinforcing AWS’s position as the company’s fastest-growing and most profitable segment.
The data-center development is expected to create more than 200 direct jobs at the site and support over 300 additional roles in the surrounding region. Amazon highlighted that the expansion will power next-generation AI workloads, machine-learning services, and global cloud capacity. The investment also deepens Amazon’s long-term footprint in the southeastern U.S., aligning with rising demand for high-compute environments across industries.
This move follows a broader trend of hyperscale cloud providers accelerating infrastructure spending to compete for AI-focused enterprise customers. With AWS already serving as the global leader in cloud services, the investment signals Amazon’s intention to maintain a technological and commercial edge amid intensifying competition from Microsoft Azure and Google Cloud.
Technical analysis:
Price is pulling back from heavy resistance at $258 and correcting toward the ascending trendline support. This level acts as a significant weekly demand area and aligns with the broader structure guiding the uptrend.
A strong bullish reaction from the trendline would likely set up another retest of the $258 highs. A clean break above that zone opens the door toward $280–$300, supported by long-term Fibonacci projections and sustained strength in AWS earnings.
If the trendline level breaks, the next key support sits at the horizontal support that has carried Amazon’s stock since early 2021. Overall, the setup remains bullish as long as price holds above the trendline.
Is Amazon exploding again? New weekly demand in controlIs Amazon exploding again? New weekly demand in control at $224. Expecting a decent rally from here in the following days.
Amazon Raises $15B for AI Expansion — Stock at Key Support ZoneAmazon has launched its first US dollar bond sale since 2022, securing $15 billion to accelerate investments in AI infrastructure. Demand was massive, reaching $80 billion, signaling strong investor confidence in Amazon’s long-term growth story. The funds will support capital expenditures, acquisitions, data-center expansion, and upcoming debt maturities.
This move aligns with a broader trend among tech giants aggressively raising capital to scale AI systems. Meta issued $30 billion earlier, Alphabet raised $25 billion, and Oracle sold $18 billion in September. The surge in funding reflects the rising cost of advanced chips, cloud infrastructure, and high-capacity data centers needed to stay competitive in the AI race.
Amazon, the world’s largest cloud provider through AWS, is increasingly focused on high-performance computing and generative AI models. The new capital gives Amazon more room to expand capacity, boost margins through automation, and strengthen its competitive edge in enterprise AI services.
Amazon’s stock (AMZN) is pulling back from the $258 resistance, forming a corrective move toward a key support area around $232. This level aligns with the structure seen on the weekly chart and acts as a short-term demand zone. A strong bullish reaction here would likely set the stage for a retest of the $258 high, followed by a potential breakout if momentum returns.
If $232 fails to hold, the next major support sits at the ascending trendline zone, which has guided Amazon’s uptrend since early 2023. A deeper correction remains possible, but the broader structure is still bullish as long as price holds above the trendline.
The RSI is cooling off, suggesting the correction is healthy rather than a trend reversal. If Amazon bounces from support, the next major upside target sits between $280 and $300, aligning with long-term Fibonacci extensions.

Amazon.com, Inc. ($AMZN) Expands Low-Cost Bazaar ServiceAmazon.com, Inc. (Nasdaq: NASDAQ:AMZN ) is making a bold move into the global low-cost e-commerce space. The retail giant announced the expansion of its Amazon Bazaar service — known as “Haul” in the U.S. — to 14 new international markets, intensifying competition with Shein and PDD Holdings’ Temu.
The service targets value-driven shoppers by offering ultra-cheap goods like $10 dresses, $5 accessories, and $2 home items, with a focus on emerging markets such as Nigeria, the Philippines, Hong Kong, Saudi Arabia, and Taiwan. The expansion builds on Bazaar’s earlier success in Mexico and the UAE, signaling Amazon’s strategy to tap into the fast-growing global demand for low-cost online retail amid weaker consumer sentiment.
This move comes as U.S. import tariffs under the Trump administration pressure household budgets, particularly for low-income groups. By diversifying into affordable goods, Amazon aims to defend its e-commerce dominance against Chinese platforms that have captured younger, price-sensitive consumers through viral marketing and social commerce. Analysts note that this pivot could enhance Amazon’s total addressable market and bolster revenue from international operations in 2026.
Technically, Amazon’s stock remains in a strong uptrend, trading near $244.41, slightly below its recent high of $258.60 market this week. The weekly chart shows consistent higher lows supported by a long-term ascending trendline from early 2023. The $220–$225 zone now serves as key support, with potential for a short-term pullback before resuming the rally toward the $300 level.
Momentum remains positive, with volume strength confirming investor interest following strong Q3 earnings. A sustained move above $260 could trigger a fresh bullish leg, extending Amazon’s dominant run as both a tech and retail powerhouse.
Amazon’s Hidden Pullback Opportunity – Smart Risk, Smart Entry🎯 AMZN: The "Thief's Playbook" — Stealing Profits Like a Wall Street Ninja
📊 Asset Overview
AMAZON.COM INC (NASDAQ: AMZN) — The E-Commerce Titan & Cloud King 👑
Strategy Type: Swing/Day Trade — Bullish Pullback Setup
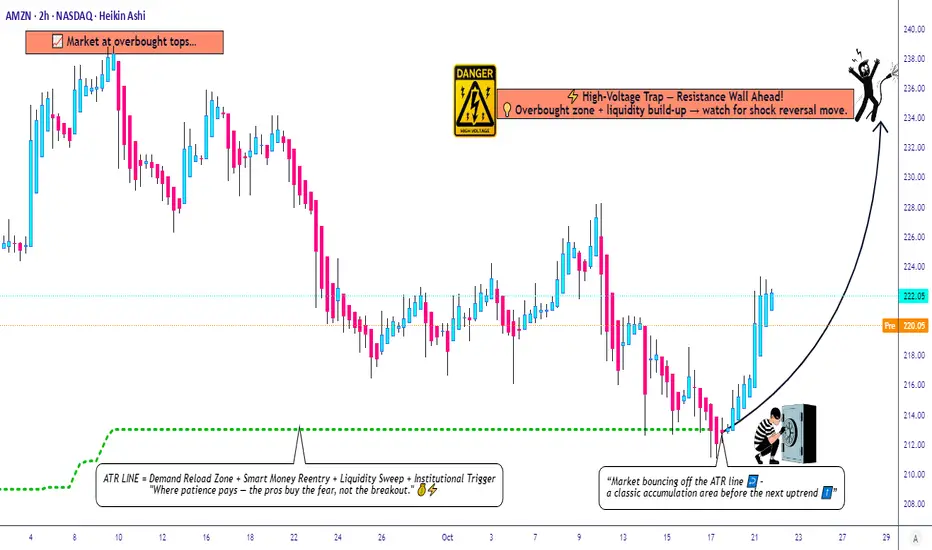
Confirmation Tool: ATR (Average True Range) ✅
🎭 The "Thief Strategy" Explained
Listen up, Thief OG's! 🦹♂️ This ain't your grandma's single-entry trade. We're using layered limit orders — think of it like setting multiple traps to catch money at different price levels. Professional? Yes. Legal? Absolutely. Stylish? You bet! 😎
🔥 Entry Zones — The Multi-Layer Trap
The Thief's Ladder Entry Method:
You've got options, trader! Pick your poison:
Option 1: Aggressive Single Entry
Jump in at current market price (~$220-$225 zone)
Option 2: The Layered "Thief" Method 🎯
Set multiple buy limit orders to scale in:
Layer 1: $220
Layer 2: $218
Layer 3: $216
Layer 4: $214
Why layer? Because markets don't move in straight lines, baby! This lets you average down if price dips while maintaining a solid risk profile. Add more layers based on your risk appetite! 🍰
🛑 Stop Loss — Protecting Your Loot
Thief's Emergency Exit: $210 🚨
⚠️ IMPORTANT DISCLAIMER:
Dear Ladies & Gentlemen (my fellow Thief OG's), I'm NOT telling you to blindly follow my stop loss. This is MY risk management. YOU manage YOUR money. Trade at your own risk — this is entertainment with charts, not financial advice! 🎲
🎯 Target Zone — Where We Cash Out
⚡ High-Voltage Trap Alert — Resistance Wall Ahead! ⚡
Target Price: $235 🎯💵
Why this target?
💡 This zone shows classic signs of:
Strong resistance from previous price action 🧱
Overbought conditions brewing (RSI warming up) 📈
Liquidity build-up (big money sitting here) 💰
Potential "bull trap" zone → smart money escapes here! 🪤
My advice? When price hits $235, secure your profits! Don't get greedy.
⚠️ ANOTHER DISCLAIMER:
Dear Thief OG's, this is MY target based on MY analysis. You do YOU. Take profits when YOU feel comfortable. Your money, your rules, your risk! 💪
🔗 Related Assets to Watch
Keep an eye on these correlated movers — they can give you early signals for AMZN's direction:
📦 E-Commerce & Tech Giants:
NASDAQ:TSLA (Tesla) — Tech sentiment leader; when tech rallies, AMZN often follows 🚗⚡
NASDAQ:MSFT (Microsoft) — Cloud competitor (Azure vs AWS); inverse correlation sometimes kicks in ☁️
NASDAQ:GOOGL (Alphabet) — Ad spending indicator; strong Google ads = strong consumer spending = bullish for AMZN 🔍
NYSE:WMT (Walmart) — Retail competitor; if WMT struggles, AMZN often benefits 🛒
📊 Market Indices:
NASDAQ:QQQ (Nasdaq 100 ETF) — AMZN is heavily weighted here; QQQ direction = AMZN direction 📉📈
AMEX:SPY (S&P 500 ETF) — Overall market health check; risk-on = AMZN rallies 🇺🇸
💵 Market Sentiment Indicators:
TVC:VIX (Volatility Index) — Low VIX = calm markets = bullish for growth stocks like AMZN 😌
TVC:DXY (US Dollar Index) — Weak dollar = bullish for mega-cap tech stocks 💵📉
The Correlation Play: If you see NASDAQ:QQQ breaking higher + TVC:VIX dropping + tech stocks rallying → high probability AMZN follows the party! 🎉
🧠 Key Technical Points
✅ ATR Confirmation: Volatility is in the "sweet spot" — not too choppy, not too sleepy
✅ Pullback Structure: Classic bullish retracement setting up
✅ Risk-Reward: Solid 2:1+ ratio with layered entries
✅ Volume Profile: Watching for confirmation on breakout
⚠️ Legal Disclaimer — Read This Twice! 📢
THIS IS THE "THIEF STYLE" TRADING STRATEGY — JUST FOR FUN & EDUCATIONAL ENTERTAINMENT! 🎭
I am NOT a financial advisor. This is NOT financial advice. This is a trading idea based on technical analysis, shared for educational and entertainment purposes only.
❌ Do NOT risk money you can't afford to lose
❌ Do NOT trade based solely on this idea
❌ Do your own research (DYOR)
❌ Past performance ≠ future results
✅ Trade responsibly and manage your risk
You are 100% responsible for your own trading decisions. I'm just a chart nerd sharing ideas with the community! 🤓📊
💬 Final Thoughts from Your Friendly Neighborhood Chart Thief
Markets are a game of patience, discipline, and calculated risks. The "Thief Strategy" is about being strategic, not reckless. Set your traps, manage your risk, and let the market come to you! 🕸️💰
Stay sharp, stay profitable, and remember: the best trades are the ones you plan, not the ones you chase! 🏃♂️💨
✨ If you find value in my analysis, a 👍 and 🚀 boost is much appreciated — it helps me share more setups with the community!
#AMZN #Amazon #StockMarket #SwingTrading #DayTrading #TechnicalAnalysis #BullishSetup #LayeredEntry #ThiefStrategy #TradingIdeas #ATR #ResistanceZone #TakeProfit #RiskManagement #NASDAQ #TechStocks #PullbackTrading #PriceAction #SupportAndResistance #TradeSmart
Trade safe, trade smart, and let's get this bread! 🍞💸
AMAZONAMAZON has done exactly what we expected, now we will wait for correction to finish in this week for further upside.
Disclosure: We are part of Trade Nation's Influencer program and receive a monthly fee for using their TradingView charts in our analysis.

AMAZONAMAZON has started the push up after the complete correction, let's see if it holds this upside momentum and breaks the top one more time.
Disclosure: We are part of Trade Nation's Influencer program and receive a monthly fee for using their TradingView charts in our analysis.

AMAZONAMAZON has done what we expected last week, this week we are expecting an up move to start.
Disclosure: We are part of Trade Nation's Influencer program and receive a monthly fee for using their TradingView charts in our analysis.

AMAZONAMZN is almost ready to push up further to take ATH.
Disclosure: We are part of Trade Nation's Influencer program and receive a monthly fee for using their TradingView charts in our analysis.

Don’t Miss: AMZN Call Opportunity at $242.50! 🚀 AMZN Swing Alert – 2025-08-15 🚀
**Sentiment:** Moderate Bullish
**Setup:** Call Option Trade
---
## 📈 Market Snapshot
* **Daily RSI:** 61.5 → Strong bullish momentum
* **5 & 10-Day Trend:** +3.68% / +7.52% → Confirmed upside
* **Volume:** Avg (1.0x) → Lacks strong institutional confirmation
* **Call/Put Ratio:** 1.00 → Neutral sentiment
* **VIX:** 14.84 → Low volatility, ideal for controlled swings
---
## ⚖️ Consensus & Conflicts
**Agreement:**
* Bullish momentum recognized across multiple models
* Favorable market conditions for swings
* Weak volume highlighted as a risk
**Disagreement:**
* Some models (Claude/Anthropic) advise caution, suggesting no immediate trade
* Confidence varies: DeepSeek favors a stronger bullish call, others remain cautious
---
## 🎯 Trade Setup – AMZN CALL
**Entry Condition:** At market open
**Strike:** \$242.50
**Expiration:** 2025-08-29
**Entry Price:** \$0.85
**Confidence:** 75%
**Profit Target:** \$2.13 (150% gain)
**Stop Loss:** \$0.50 (30% of premium)
**Key Risks:**
* Weak volume may reduce momentum sustainability
* Market shifts require active monitoring
---
## 📝 TRADE DETAILS (JSON)
```json
{
"instrument": "AMZN",
"direction": "call",
"strike": 242.5,
"expiry": "2025-08-29",
"confidence": 0.75,
"profit_target": 2.13,
"stop_loss": 0.50,
"size": 1,
"entry_price": 0.85,
"entry_timing": "open",
"signal_publish_time": "2025-08-15 11:56:23 UTC-04:00"
}
```
---
## 📊 Quick Reference – TradingView Ready
🎯 **Instrument:** AMZN
🔀 **Direction:** CALL (Long)
💵 **Entry Price:** \$0.85
📈 **Profit Target:** \$2.13
🛑 **Stop Loss:** \$0.50
📅 **Expiry:** 2025-08-29
📏 **Size:** 1 contract
⏰ **Entry Timing:** Market Open
🕒 **Signal Time:** 2025-08-15 11:56 EDT
---
### Suggested Viral Title & Tags:
**🔥 AMZN Swing Alert: Call Setup Ready – Strike \$242.50 🚀**
\#AMZN #SwingTrade #OptionsTrading #Bullish #CallOption #Momentum #TradeSetup #TechnicalAnalysis #StockAlerts #Finance #TradingSignals #MarketWatch #LongTrade

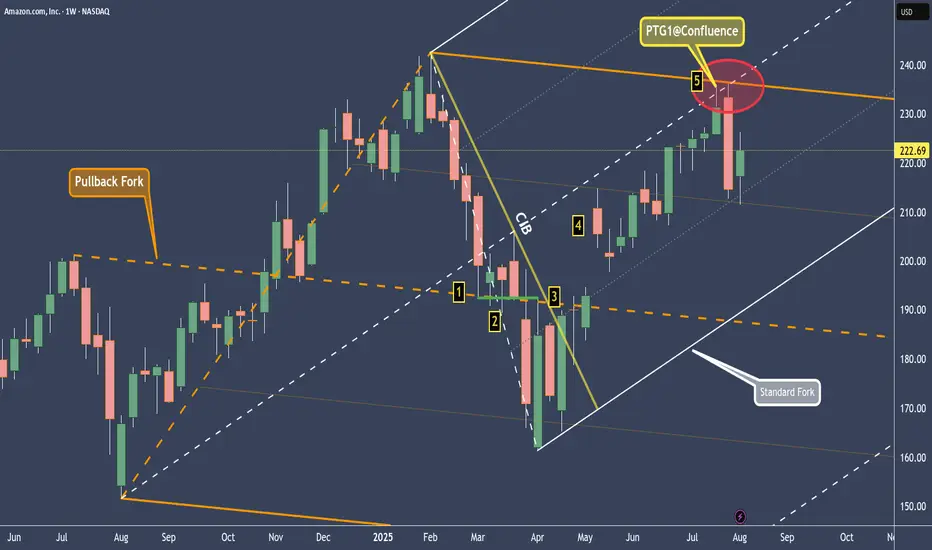
AMZN - Amazon Hit The 80% profit Target. Trend change ahead?On this chart we have 2 forks.
Orange: the pullback fork
It shows us where the equilibrium is — at the centerline, which the market respected to the tick (1).
After that, there were several bars that formed support (2).
When the CIB line was broken (3), the market gapped above the orange centerline and made its way up to the white centerline (5), the target that we can expect in around 80% of all cases.
Note the confluence point where the centerline of the white fork and the upper median line parallel (U-MLH) of the orange fork meet.
A day later, we saw a sharp sell-off within just one bar! Is this now another trend reversal?
No, clearly not.
For a trend reversal to occur, the market would have to break the white L-MLH (lower median line parallel). As long as the market is trading within the white fork, we remain long.
I’ll make a YT video soon, covering the details.
Wishing you all a successful new trading week.
AMZN AMZN Bullish Setup --Don’t Miss Out🚀 AMZN Weekly Call Play — Riding the Bullish Flow**
Amazon (AMZN) shows strong institutional bullish flow with a **Call/Put ratio of 2.09**, backed by favorable RSI trends and low volatility conditions. While volume is weaker than last week, momentum and options flow point toward upside potential into next week.
**🛠 Trade Setup:**
* **Instrument:** AMZN
* **Direction:** CALL (LONG)
* **Strike:** \$230.00
* **Expiry:** 2025-08-15
* **Entry Price:** \$0.63
* **Profit Target:** \$1.26 (100% gain)
* **Stop Loss:** \$0.38
* **Size:** 1 contract
* **Entry Timing:** Market open
* **Confidence:** 65%
**📊 Key Factors:**
* Call/Put ratio: **2.09** — strong bullish options flow
* Daily RSI: 49.0, Weekly RSI: 58.3 — uptrend confirmation
* Low VIX (\~15.88) — supportive for directional plays
* Potential resistance at \$226–\$230
**⚠ Risks:**
* Weak weekly volume (0.8x prior week) may reduce conviction
* Broader market weakness could cap gains
---
**#AMZN #OptionsTrading #CallOptions #WeeklyOptions #BullishSetup #TechnicalAnalysis #TradingView #OptionsFlow #LowVIX #SwingTrade #MarketMomentum**

Amazon I Strong Bullish Outlook Welcome back! Let me know your thoughts in the comments!
** Amazon Analysis - Listen to video!
We recommend that you keep this pair on your watchlist and enter when the entry criteria of your strategy is met.
Please support this idea with a LIKE and COMMENT if you find it useful and Click "Follow" on our profile if you'd like these trade ideas delivered straight to your email in the future.
Thanks for your continued support!Welcome back! Let me know your thoughts in the comments!

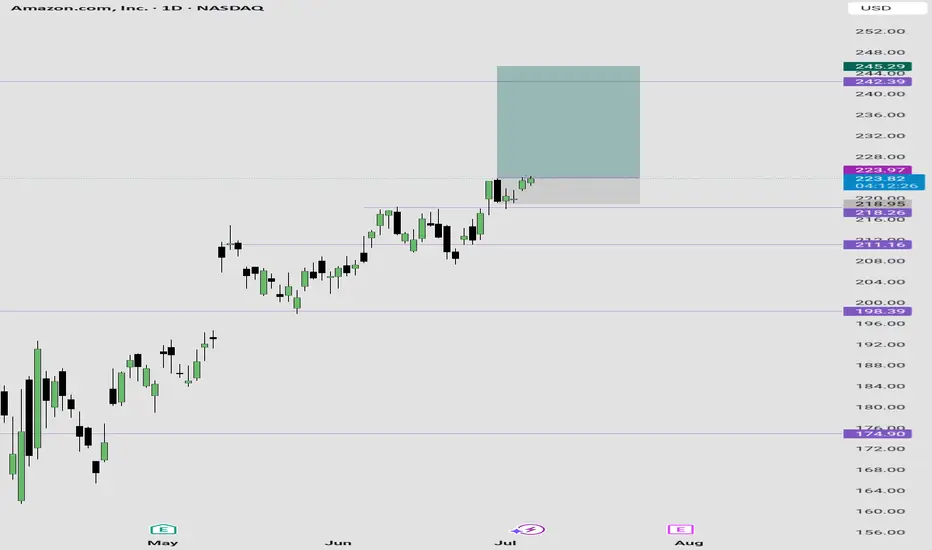
Amazon Long IdeaBuying Amazon shares here...
Reason:
Bouncing off support with good bullish price action candles.
I expect the price to reach $245 per shares between now and next week Friday....
My stop loss price is on the chart.
AMAZONAMZN is getting ready for another push towards 230 level.
Disclosure: We are part of Trade Nation's Influencer program and receive a monthly fee for using their TradingView charts in our analysis.
