Amazonshort


AMZN Amazon Bearish Signals on Bullish Fundamentals In the Q4 institutional buys were 124B compared with 7.69Bil sells.
On 10/30/2020 JPMorgan Chase & Co. Boosted Price the Target price from $4,050.00 to $4,100.00
The Pharmacy business will be a long term growth catalyst for Amazon.
Their cloud service is growing too.
The Holyday sales will most likely surpass the last year`s.
The indicators are still bearish, i won`t buy yet, but wait for a breakout.
If you are interested to test some amazing BUY and SELL INDICATORS, which give the signal at the beginning of the candle, not at the end of it, just leave me a message.

Amazon's CollapseHow are giants/bosses defeated in video games? There's always a weak spot. Amazon's weak spot happens to be in its core foundation. This essentially means they're founded on demand-side economics. However, in the real world, the economy can only function off of supply-side economics. But with the role Big tech, the Deep state, the Liberal agenda, and all of these business tycoons are playing in our politics, they may be able to synthesize a false reality & force us into a Socialist state. That's a BIG "if" though, and in the end, nature ALWAYS wins. They may be successful at doing this in the beginning, but it will be short-lived and we will rotate back to Capitalism as it's the only way reality (on God's terms) works. A rotten pillar will always be a rotten pillar, no matter how much you bandage it up. And you can't buy an apple, without that apple first being grown. 1+1 always equals 2 and NOTHING can change that. The bigger they are, the harder they fall. Remember this a few years from now.

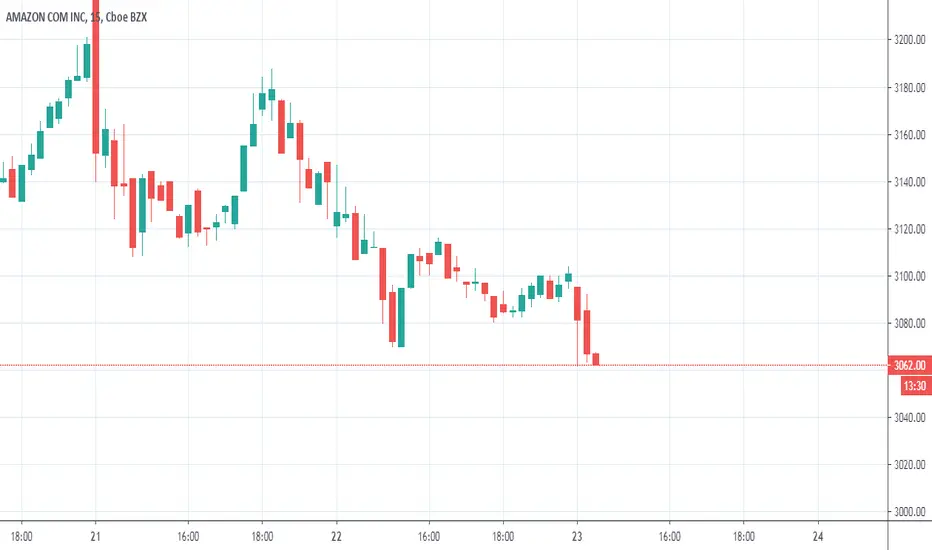
Sell amazon 14/10/2020Amazon stock is moving in a short-term sideway trend.
between 3552.25 and 2871 With a high volume.
And tests the resistance level 3552.25
So you can sell
stop loss 3623 target 2871

A Possible HS will Form for AMAZONIt was told by some analysts that a HS formation is building up for NDX and parallelly it can be more obvious on AMAZON chart. I expect such a formation in short term. I would like to hear your valuable thoughts. Thanks..


AMZN SHORT (put option) almighty amazon in store for a pullbackThis is a trade idea for the amazon chart. I am seeing a possible short set up forming. during the beginning of the week amazon should trend up this week will end in a possible short. The analysis shows the entire idea. All of my setups are influenced by elliot wave. If you find my ideas helpful please follow

Amazon 3day Doji Movement. 2873 current range supports as we develop a doji candle. Want to look to see if this is Distribution
Look to play the breakout and confirm with the drop from overbought rsi and the ema dots to shoot red.
Neutral.

The green AMAZON will go up again I can tell that the AMAZON will go up again with a high probability,
We must must wait for the next volume plus the VWAP breakout and then we can enter the market promptly,
Regards,


Strong buy on AMAZONPrice is respecting the uptrend. (Buy)
Price broke a previous resistance. (Buy)
AMAZON must be kept in the Wallet ! (Buy)

😯 Amazon Ready To Put On Scuba Gear? (AMZN)💰 LET'S GET INTO SOME AMAZON ANALYSIS!💰
1️⃣ First off SMASH that LIKE BUTTON & Give us a FOLLOW for DAILY ANALYSIS! ❤❤❤
(Overall Market Sentiment) 🐻 Bearish
- Amazon Is on high alert as the 1 hour finally starts to shift red on the ema dots indicator below. The candles are firing red with a drop below on the Crossover strategy. I think the bears are getting hungry!!!!
Drop your charts and comments down below, share with us what you think is going on in the markets! ❤❤❤
Thanks for checking out our analysis! ✌😁✌
🥇MLT | MAJOR LEAGUE TRADER

Amazon.com (bearish )Hello Traders
Normally i don't do stock trading but Elliot wave applies to everything. According to my wave count on AMAZON bullish trend is almost over. we are getting close or we already are on wave 5 then market will correct
RSI, Stochastic and MACD are overbought and have bearish divergence.

😯 How Much Juice Is Left? (AMZN)🤔 Pre market right now showing 2675 which puts it almost near the top of the rising wedge.
Amazon would have to go parabolic to break to the upside at this rate. Keep eyes glued and play the breakouts.
All indicators still green on the daily.
Best of luck, happy trading!
🥇MLT | MAJOR LEAGUE TRADER

🚨 Amazon Is On HIGH ALERT!!! 🚨 (AMZN)🤔 The big daddy of e-commerce looks like it could be at a tipping point!
MASSIVE ascending wedge! We are now getting the compression at the tip of the iceberg.
This pattern can show signs of extreme exhaustion.
What you will want to do is play the breakout of the wedge, almost like how I showed on spx500 before the dump.
2515 is current support that MUST HOLD! Good opportunity to short if it breaks that level.
2683 is an opportunity for long if it broke the top of the pattern, would need to be parabolic movement to breach.
Best of luck to you! 🎲🎲🎲
🥇MLT | MAJOR LEAGUE TRADER

AMAZON to go down 1000 points target 1500'sIf stop loss is triggered the wait for 2600's to short again ,..
or look out for false breaks


Amazon is now in down trending There is big probability that Amazon will keep falling down after a strong breakout
