Amazon.com, Inc. ($AMZN) Expands Low-Cost Bazaar ServiceAmazon.com, Inc. (Nasdaq: NASDAQ:AMZN ) is making a bold move into the global low-cost e-commerce space. The retail giant announced the expansion of its Amazon Bazaar service — known as “Haul” in the U.S. — to 14 new international markets, intensifying competition with Shein and PDD Holdings’ Temu.
The service targets value-driven shoppers by offering ultra-cheap goods like $10 dresses, $5 accessories, and $2 home items, with a focus on emerging markets such as Nigeria, the Philippines, Hong Kong, Saudi Arabia, and Taiwan. The expansion builds on Bazaar’s earlier success in Mexico and the UAE, signaling Amazon’s strategy to tap into the fast-growing global demand for low-cost online retail amid weaker consumer sentiment.
This move comes as U.S. import tariffs under the Trump administration pressure household budgets, particularly for low-income groups. By diversifying into affordable goods, Amazon aims to defend its e-commerce dominance against Chinese platforms that have captured younger, price-sensitive consumers through viral marketing and social commerce. Analysts note that this pivot could enhance Amazon’s total addressable market and bolster revenue from international operations in 2026.
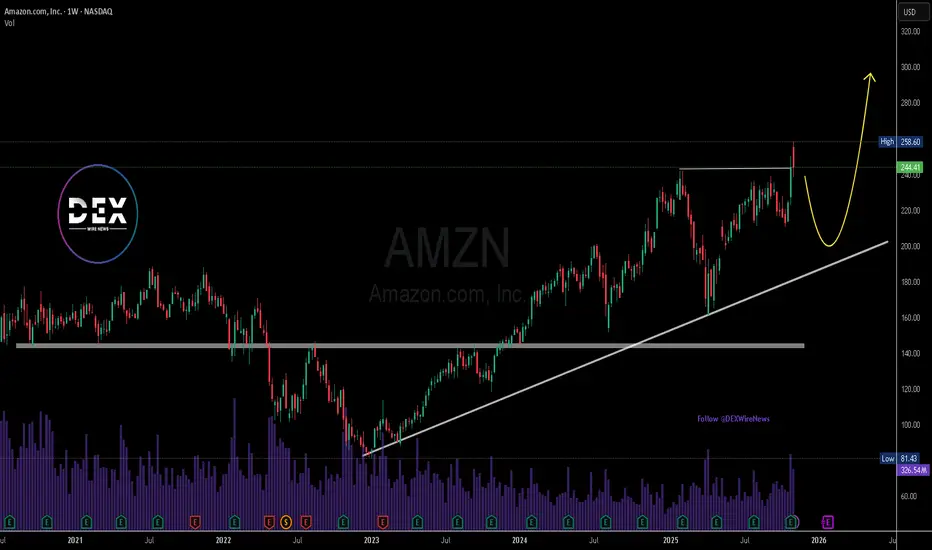
Technically, Amazon’s stock remains in a strong uptrend, trading near $244.41, slightly below its recent high of $258.60 market this week. The weekly chart shows consistent higher lows supported by a long-term ascending trendline from early 2023. The $220–$225 zone now serves as key support, with potential for a short-term pullback before resuming the rally toward the $300 level.
Momentum remains positive, with volume strength confirming investor interest following strong Q3 earnings. A sustained move above $260 could trigger a fresh bullish leg, extending Amazon’s dominant run as both a tech and retail powerhouse.
Amazonsignals
AMAZON flashing a massive 5-year Sell Signal.More than 5 months ago (May 28, see chart below), we gave a strong buy signal on Amazon Inc. (AMZN), which last Friday hit our $255 Target:
This time we come across a massive Sell Signal on the 1W time-frame as the price hit (and is so far being rejected on) the 5-year Higher Highs trend-line that started back on the August 31 2020 Top.
We can see that during that period of time, Amazon had started a Triple Top formation that eventually led to the final rejection and the start of the 2022 Bear Cycle. Until we can talk about such a correction, we can expect at least a pull-back to its 1W MA50 (blue trend-line) as all of those 2020/21 rejections did. As a result, our medium-term Target on Amazon is $220.
Notice also the similarities between the 1W RSI sequences between the two fractals (2020/21 and 2024/25), both forming Lower Highs patterns.
-------------------------------------------------------------------------------
** Please LIKE 👍, FOLLOW ✅, SHARE 🙌 and COMMENT ✍ if you enjoy this idea! Also share your ideas and charts in the comments section below! This is best way to keep it relevant, support us, keep the content here free and allow the idea to reach as many people as possible. **
-------------------------------------------------------------------------------
💸💸💸💸💸💸
👇 👇 👇 👇 👇 👇

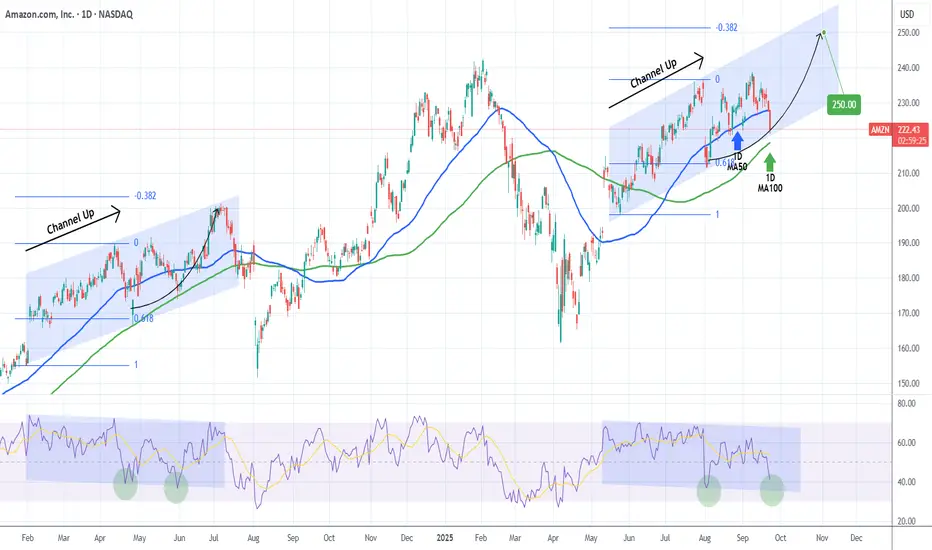
AMAZON Has it found a bottom?Amazon Inc. (AMZN) has been trading within a 4-month Channel Up and is currently pulling back on a Bearish Leg. The 1D MA100 (green trend-line) is just below and last time a similar Channel Up found support on it (May 31 2024), it rebounded for a -0.382 Fibonacci extension top.
As you can see, both patterns are identical, even making their first Higher Lows on their respective 0.618 Fib. Even their 1D RSI fractals are similar and right now we are headed of the 2nd Low (green circle).
As a result, we expect a bullish reversal there, targeting a little under $250 (Fib -0.382 ext).
-------------------------------------------------------------------------------
** Please LIKE 👍, FOLLOW ✅, SHARE 🙌 and COMMENT ✍ if you enjoy this idea! Also share your ideas and charts in the comments section below! This is best way to keep it relevant, support us, keep the content here free and allow the idea to reach as many people as possible. **
-------------------------------------------------------------------------------
💸💸💸💸💸💸
👇 👇 👇 👇 👇 👇
Don’t Miss: AMZN Call Opportunity at $242.50! 🚀 AMZN Swing Alert – 2025-08-15 🚀
**Sentiment:** Moderate Bullish
**Setup:** Call Option Trade
---
## 📈 Market Snapshot
* **Daily RSI:** 61.5 → Strong bullish momentum
* **5 & 10-Day Trend:** +3.68% / +7.52% → Confirmed upside
* **Volume:** Avg (1.0x) → Lacks strong institutional confirmation
* **Call/Put Ratio:** 1.00 → Neutral sentiment
* **VIX:** 14.84 → Low volatility, ideal for controlled swings
---
## ⚖️ Consensus & Conflicts
**Agreement:**
* Bullish momentum recognized across multiple models
* Favorable market conditions for swings
* Weak volume highlighted as a risk
**Disagreement:**
* Some models (Claude/Anthropic) advise caution, suggesting no immediate trade
* Confidence varies: DeepSeek favors a stronger bullish call, others remain cautious
---
## 🎯 Trade Setup – AMZN CALL
**Entry Condition:** At market open
**Strike:** \$242.50
**Expiration:** 2025-08-29
**Entry Price:** \$0.85
**Confidence:** 75%
**Profit Target:** \$2.13 (150% gain)
**Stop Loss:** \$0.50 (30% of premium)
**Key Risks:**
* Weak volume may reduce momentum sustainability
* Market shifts require active monitoring
---
## 📝 TRADE DETAILS (JSON)
```json
{
"instrument": "AMZN",
"direction": "call",
"strike": 242.5,
"expiry": "2025-08-29",
"confidence": 0.75,
"profit_target": 2.13,
"stop_loss": 0.50,
"size": 1,
"entry_price": 0.85,
"entry_timing": "open",
"signal_publish_time": "2025-08-15 11:56:23 UTC-04:00"
}
```
---
## 📊 Quick Reference – TradingView Ready
🎯 **Instrument:** AMZN
🔀 **Direction:** CALL (Long)
💵 **Entry Price:** \$0.85
📈 **Profit Target:** \$2.13
🛑 **Stop Loss:** \$0.50
📅 **Expiry:** 2025-08-29
📏 **Size:** 1 contract
⏰ **Entry Timing:** Market Open
🕒 **Signal Time:** 2025-08-15 11:56 EDT
---
### Suggested Viral Title & Tags:
**🔥 AMZN Swing Alert: Call Setup Ready – Strike \$242.50 🚀**
\#AMZN #SwingTrade #OptionsTrading #Bullish #CallOption #Momentum #TradeSetup #TechnicalAnalysis #StockAlerts #Finance #TradingSignals #MarketWatch #LongTrade

AMAZON eyes $255 on the 3rd such buy signal in 18 months!AMAZON Inc. (AMZN) has been trading within a 18-month Bullish Megaphone pattern whose latest bottom was on the April 07 2025 Low. Since then, the pattern has started its new Bullish Leg, which has been confirmed by the break-out above its 1D MA50 (blue trend-line) and the 1W RSI's above its MA.
The previous two Bullish Legs hit at least their 3.5 Fibonacci extension levels and the 2nd Bullish was +30% more than the 1st. If the stock achieves a +60% gain from its April bottom again, it will be almost exactly on its 3.5 Fib ext.
As a result, we believe that a $255 Target (on the 3.5 Fib), is more than realistic to be achieved by September.
-------------------------------------------------------------------------------
** Please LIKE 👍, FOLLOW ✅, SHARE 🙌 and COMMENT ✍ if you enjoy this idea! Also share your ideas and charts in the comments section below! This is best way to keep it relevant, support us, keep the content here free and allow the idea to reach as many people as possible. **
-------------------------------------------------------------------------------
💸💸💸💸💸💸
👇 👇 👇 👇 👇 👇

AMAZON is on its 3rd historic +1000% growth Bull Cycle.Amazon (AMZN) almost has been trading within a multi-year Channel Up pattern since the Housing Bubble bottom in November 2008 and this month almost touched its 1M MA50 (blue trend-line).
With the exception of the 2008 Housing Crisis and the 2022 Inflation Crisis, which bottomed on the 1M MA100 (green trend-line), the 1M MA50 has never been broken. In fact it has been the key Support of every Bull Cycle that surprisingly has so far peaked on a +1051% rise.
As you can actually see by the 1M RSI, such corrections, like the one in the past 3 months, are quite common within the Channel Up and offer excellent long-term buy entries.
So, technically the Inflation Crisis bottom (December 2022) on the 1M MA100 has initiated Amazon's 3rd historic Bull Cycle within this pattern and based on the previous two, it may also peak after a +1051% rally inside 2028. Our projected Target on this is $900.
Would you miss out on such an opportunity in the past?
-------------------------------------------------------------------------------
** Please LIKE 👍, FOLLOW ✅, SHARE 🙌 and COMMENT ✍ if you enjoy this idea! Also share your ideas and charts in the comments section below! This is best way to keep it relevant, support us, keep the content here free and allow the idea to reach as many people as possible. **
-------------------------------------------------------------------------------
💸💸💸💸💸💸
👇 👇 👇 👇 👇 👇

AMAZON Is it worth buying now?Amazon (AMZN) broke below its 1W MA50 (blue trend-line) last week for the first time since the week of August 05 2024 and opened this week below it. As you can see, the stock has been trading within a 2-year Channel Up and today's candle is as close to a technical Higher Low (bottom) as it can get.
The previous Higher Low was in fact that Aug 05 2024 candle, which despite breaking below the 1W MA50, managed to post a strong intra-week recovery and close above the it. Technically that was the 'Max pain' situation on every 1W bottom candle in those 2 years.
Every Bullish Leg that followed was around +65.24%, so that gives us an end-of-year technical Target of $300.
-------------------------------------------------------------------------------
** Please LIKE 👍, FOLLOW ✅, SHARE 🙌 and COMMENT ✍ if you enjoy this idea! Also share your ideas and charts in the comments section below! This is best way to keep it relevant, support us, keep the content here free and allow the idea to reach as many people as possible. **
-------------------------------------------------------------------------------
💸💸💸💸💸💸
👇 👇 👇 👇 👇 👇

AMAZON Excellent buy opportunity for a new ATH.Last time we looked at Amazon Inc. (AMZN) was three months ago (November 13 2024, see chart below), giving a pull-back buy signal:
The price action couldn't have followed this more accurately as after a short-term pull-back, the stock hit our $240.00 Target at the end of January.
Since then the price started to pull-back again to a point where this week it broke below its 1D MA50 (blue trend-line) for the first time since September 11 2024. With the 1D RSI on the 40.00 mark, this pull-back resembles the April 25 2024 Low, made near the 0.5 Fibonacci retracement level.
We expect a similar medium-term rebound to start towards the 1.236 Fibonacci extension. Our Target is marginally below it at $252.50.
-------------------------------------------------------------------------------
** Please LIKE 👍, FOLLOW ✅, SHARE 🙌 and COMMENT ✍ if you enjoy this idea! Also share your ideas and charts in the comments section below! This is best way to keep it relevant, support us, keep the content here free and allow the idea to reach as many people as possible. **
-------------------------------------------------------------------------------
💸💸💸💸💸💸
👇 👇 👇 👇 👇 👇

From Prime to Subprime: Why December Could See AMZN Fall
As always, we like to keep it clean and simple, with technicals and analysis that's easy to see and understand. Let's get into it:
AMZN could see a modest correction this December. It's at an all time high, and well into two Wave 5 sequences on the 4h. It's also overbought on an least two oscillators.
We see a 5%+ correction to the $215 price range in the coming 3-4 days .
SUPPORTING OBSERVATIONS:
Recent Rapid Stock Appreciation:
AMZN has seen a significant rise, gaining 14.1% since November 29, 2024. Such swift increases can lead to overvaluation, prompting investors to take profits, supporting the reversal to $215.
Seasonal Competitive Pressures:
Ho ho ho. The holiday season intensifies competition, often leading to increased discounting and promotional activities. This can compress profit margins, potentially impacting Amazon's financial performance and investor sentiment.
Investment in New Ventures:
Amazon's substantial investment in initiatives like Project Kuiper, its satellite internet project, involves significant capital expenditure. While promising long-term, these ventures may pressure short-term profitability, causing some investors to reassess their positions.
Be alert.
Trade green.

AMAZON Minor pull-back and then off to $240.Amazon Inc. (AMZN) has been following our bullish signal within the Channel Up we indicated on August 23 (see chart below) very accurately and is halfway through to our $240.00 long-term Target:
This is also confirmed on the lower time-frames, namely the 1D on this chart, where the stock can be seen trading within a Channel Up and having started its most recent rebound on the 1D MA50 (blue trend-line).
The first Bullish Leg of the Channel Up, pulled-back to the 1D MA50 (and Fib 1.0) after approaching the 1.382 Fibonacci extension level and then rebounded aggressively to hit (and even break) the 2.0 Fibonacci extension. Even the 1D CCI sequences between the two fractals are quite similar.
As a result, we don't dismiss the possibility of a 1D MA50 pull-back but that will be another buy opportunity on Amazon's way to $240.00.
-------------------------------------------------------------------------------
** Please LIKE 👍, FOLLOW ✅, SHARE 🙌 and COMMENT ✍ if you enjoy this idea! Also share your ideas and charts in the comments section below! This is best way to keep it relevant, support us, keep the content here free and allow the idea to reach as many people as possible. **
-------------------------------------------------------------------------------
💸💸💸💸💸💸
👇 👇 👇 👇 👇 👇

AMAZON Only a break above the 1D MA50 remains. $240 on sight.Amazon Inc. (AMZN) spent the previous 2 weeks on a very strong recovery of the losses sustained in July - August, in fact those have been the strongest 2-week candles since October 23 - 30 2023.
That was the previous bottom of the 2.5 year Channel Up on its Higher Lows trend-line. Even though the stock broke below the 1W MA50 (blue trend-line) for the first time in more than 1 year (May 2023), it managed to hold the long term Support of the 1W MA200 (orange trend-line).
As this 1W chart shows, the Higher Lows of this pattern are periodic and cyclical and you can see that clearly with the use of the Sine Waves (also evident on the 1W RSI, the green circle bottoms below its MA). Every time the price broke above the 1D MA50 (red trend-line) following such a Low (3 times) it approached the top of the Channel Up.
The first Bullish Leg peaked at +79%, the second at +69%. If this is a progressive sequence, then the third (current) Bullish Leg could be -10% less than the last, i.e. +59%. As a result, the 1D MA50 (which applied high selling pressure this week), is the final Resistance and bullish break-out confirmation the price technically needs before it targets $240.00 (+59% rise).
-------------------------------------------------------------------------------
** Please LIKE 👍, FOLLOW ✅, SHARE 🙌 and COMMENT ✍ if you enjoy this idea! Also share your ideas and charts in the comments section below! This is best way to keep it relevant, support us, keep the content here free and allow the idea to reach as many people as possible. **
-------------------------------------------------------------------------------
💸💸💸💸💸💸
👇 👇 👇 👇 👇 👇

AMAZON Pair : AMZN - AMAZON
Description :
Rising Wedge as an Corrective Pattern in Long Time Frame and Short Time Frame
Break of Structure
RSI - Divergence
Completed " 12345 " Impulsive Waves
Resistance Level

amazon stock on buy postionwe can enter amazon boy but we must keep the stop under the support shown in the graph

AMZNPair : AMAZON
Description :
Completed " 12345 " Impulsive Waves
Break of Structure
RSI - Divergence
Double Top in Short Time Frame
Fibonacci Level - 261.8%

AMAZON Under the 1D MA50 after 6 months. Is the bleeding over?Amazon (AMZN) has broken and closed below its 1D MA50 (blue trend-line) for the first time in 6 months (since October 27 2023). Last time this happened, the stock had already begun the 2nd Bearish Leg (-18.83% decline) of the 2-year Channel Up.
As a result, there's a real possibility for the stock to reach as low as the 0.382 Fiboancci retracement level and the 1D MA200 (orange trend-line) to form a new Higher Low near the bottom of the Channel Up and then rebound.
As long as the Channel Down of the Bearish Leg is intact and Amazon doesn't close a 1D candle above the 1D MA50, we will wait for a more comfortable buy at $160.00 and we will target $200.00 (+31.87% symmetrical rise as Dec 20 2023).
-------------------------------------------------------------------------------
** Please LIKE 👍, FOLLOW ✅, SHARE 🙌 and COMMENT ✍ if you enjoy this idea! Also share your ideas and charts in the comments section below! This is best way to keep it relevant, support us, keep the content here free and allow the idea to reach as many people as possible. **
-------------------------------------------------------------------------------
💸💸💸💸💸💸
👇 👇 👇 👇 👇 👇

AMAZON -15% dip possible. Take advantage of it.It has been 3 months (Nov 17 2023, see chart below) since our last buy trade on Amazon (AMZN), which hit both Targets:
February opened with a big gap upwards and the stock has been consolidating ever since. This consolidation, along with the completion of a 1D MACD Bearish Cross last week, is indicative of a top formation. In fact it is similar with the starting sequence of the last Higher High (September 14 2023) of the 1-year Channel Up.
The first pull-back/ technical correction of this pattern was a -22.61% decline and the second -18.83%. If the corrections are on a -4% progression, we can assume a -14.60% decline this time. That falls marginally below the 0.382 Fibonacci retracement level (assuming the 2.0 Fib extension from the October 26 2023 bottom will be the peak).
As a result, we are expecting $155.00 as a fair pull-back currently and buy entry for the long-term. A break below the 1D MA50 (blue trend-line), will be the technical confirmation of the sell signal.
-------------------------------------------------------------------------------
** Please LIKE 👍, FOLLOW ✅, SHARE 🙌 and COMMENT ✍ if you enjoy this idea! Also share your ideas and charts in the comments section below! This is best way to keep it relevant, support us, keep the content here free and allow the idea to reach as many people as possible. **
-------------------------------------------------------------------------------
💸💸💸💸💸💸
👇 👇 👇 👇 👇 👇

AMAZON 24/01Pair : Amazon Index
Description :
Rising Wedge as an Corrective Pattern in Long Time Frame with the Rejection from Lower Trend Line and Rejecting from Lower Trend Line of the Corrective Pattern " Bullish Channel " in Short Time Frame. Completed Impulse and " ABC " Corrective Waves

AMAZON The rally isn't over yet. Still time to buy and profit.Last time we looked into Amazon (AMZN) on October 30, we called a bullish break-out signal, which in two weeks hit our $146.00 target (see chart below):
We zoom out on the 1D time-frame now in order to identify the longer term patterns involved. Based on the 1D RSI which is pricing a Support on the former Lower Highs trend-line, we can see the very same formation on January 18, above the 1D MA50 (blue trend-line). This was also after a break-out above a Falling Wedge, a pattern which formed the market bottom of the Inflation Crisis.
The stock shortly after completed a +39.84% rise and peaked just over the 1.382 Fibonacci extension. As a result, we are now targeting initially 156.50 (1.382 Fib) and early in January 165.00 (+39.84% from the bottom).
-------------------------------------------------------------------------------
** Please LIKE 👍, FOLLOW ✅, SHARE 🙌 and COMMENT ✍ if you enjoy this idea! Also share your ideas and charts in the comments section below! This is best way to keep it relevant, support us, keep the content here free and allow the idea to reach as many people as possible. **
-------------------------------------------------------------------------------
💸💸💸💸💸💸
👇 👇 👇 👇 👇 👇

AMAZON 1st bullish break-out made. Only the 1D MA50 left.Amazon (AMZN) made a Channel Down Lower Low on Thursday just before hitting the 1D MA200 (orange trend-line) and following the higher than expected earnings opened Friday much higher. That price jump broke above the September 14 Lower Highs trend-line. The 2nd and final bullish break-out we expect before buying again for the long-term will be above the 1D MA50 (blue trend-line), which is where the October 12 rejection took place.
A candle closing above it, would invalidate the medium-term bearish bias and most likely restore the stock back on long-term bullish trend. The 1D RSI Double Bottom is what at the moment is shifting the sentiment a little more towards a potential bullish break-out. On the other hand, a break below the 4H MA200 will cancel it. Our target is 146.00, just under the August 16 2022 High.
-------------------------------------------------------------------------------
** Please LIKE 👍, FOLLOW ✅, SHARE 🙌 and COMMENT ✍ if you enjoy this idea! Also share your ideas and charts in the comments section below! This is best way to keep it relevant, support us, keep the content here free and allow the idea to reach as many people as possible. **
-------------------------------------------------------------------------------
💸💸💸💸💸💸
👇 👇 👇 👇 👇 👇

AMAZON Buy signal with a Double Target.Amazon Inc (AMZN) is trading within a Rising Wedge pattern and last week made the new Higher Low on its bottom. At the same time it hit the 1D MA50 (blue trend-line) and technically it is staging the new bullish leg.
With the 1D MACD about to form a Bullish Cross, we get a buy signal similar to May 09. As a result we are initially targeting 156.50 (+20.25%) and 164.00 (+26.15%) in extension.
-------------------------------------------------------------------------------
** Please LIKE 👍, FOLLOW ✅, SHARE 🙌 and COMMENT ✍ if you enjoy this idea! Also share your ideas and charts in the comments section below! **
-------------------------------------------------------------------------------
💸💸💸💸💸💸
👇 👇 👇 👇 👇 👇

AMAZON Short-term buy signalIt's been exactly two months (May 30) since we gave the latest buy signal on Amazon (AMZN) when the price touched the 0.382 Fibonacci retracement level (see chart below):
Our target was set at 146.50, which is the High of August 16 2022 (Resistance 1) and we are updating our analysis as the recent rebound on the 1D MA50 (blue trend-line), seems to be the final bullish leg towards that target.
We may experience a strong pull-back (long-term trend still bullish though) there (also the 0.618 Fibonacci level is just above it) as the 1D RSI is trading within a Channel Down, which illustrates a Bearish Divergence.
-------------------------------------------------------------------------------
** Please LIKE 👍, FOLLOW ✅, SHARE 🙌 and COMMENT ✍ if you enjoy this idea! Also share your ideas and charts in the comments section below! **
-------------------------------------------------------------------------------
💸💸💸💸💸💸
👇 👇 👇 👇 👇 👇

Amazon is in a long short race!Amazon is in a long short race!
This chart shows the weekly candle chart of Amazon stocks over the past two years. The top to bottom golden section of July 2021 is superimposed in the figure. As shown in the figure, the low point of Amazon stock in early January 2023 hit the 2.000 level of the golden section in the figure, and is now in the second largest wave of rebound, breaking through the 1.000 level of the golden section! The next strong pressure level for Amazon stocks is at 0.618 on the golden section in the graph!

AMAZON on a 1D Bullish Cross, first since Feb 2020!Amazon Inc (AMZN) just completed a Bullish Cross on the 1D time-frame, the first in more than 3 years (February 04 2020)! That alone is the strongest long-term buy signal we could get. On the shorter term, now that the price is comfortably above the Bear Cycle Lower Highs, we will start targeting on every pull-back the upper Fibonacci levels, which match fairly well the Lower Highs Resistances of the Bear Cycle. Our medium-term target is 146.50 (slightly below the 0.618 Fibonacci).
-------------------------------------------------------------------------------
** Please LIKE 👍, FOLLOW ✅, SHARE 🙌 and COMMENT ✍ if you enjoy this idea! Also share your ideas and charts in the comments section below! **
-------------------------------------------------------------------------------
💸💸💸💸💸💸
👇 👇 👇 👇 👇 👇
