LCID Lucid Group like AMC Entertainment in May Welcome to my extensive and detailed technical analysis of Lucid Group ( LCID ).
Lucid Group caught my eye because of its similarity to AMC Entertainment in May 2021.
A comparison I show at the end of this analysis.
This analysis is very extensive and detailed and I show several bullish formations in the most diverse time windows.
The following time windows are discussed:
Weekly Chart
Four hours chart
Hourly Chart
To each analysis there will be a linked idea, so there is the possibility to judge individual analyses retrospectively using the play button function at TradingView (timestamp).
Let's start.
1. weekly chart
In the weekly chart, we can see and project different bullish patterns.
As seen in this analysis, a W formation has formed (white lines), which is currently in a so-called retest.
This retest can trigger a correction phase that can continue to the Fibonacci lines 0.236, 0.382, 0.618 and maximum to 0.786.
Typically, corrections are made to 0.236, 0.382.
The formation becomes invalid only when the price falls below the lowest point of the W formation.
The target of this formation can be divided into three targets.
Target 1 measured from the middle high to the "neckline".
Target 2 measured from the Left Low to the "Neckline".
Target 3 measured from the right low to the "neckline".
Thus, the following price targets result from this formation: (purple lines)
Target 1 53.54 USD
Target 2 66.13 USD
Target 3 76.05 USD
What is exciting here is that the chart at 64.82 USD, similar to AMC Entertainment back then can form a Superior W Formation, with targets of: (Blue lines)
100.08 USD
112.49 USD
113.58 USD
If one takes the trend-based Fibonacci Extensions to the help, one can determine additional Max targets that could be reached with strong sustained volume, and according to Elliot waves could define the target of wave 3. The targets are here, at the following price values: (Yellow lines)
159.66 USD
214.49 USD
248.38 USD
2. four hours chart
In the four-hour chart, we can see an Inverted Shoulder Head Shoulder Formation, which has already reached its target of 41.41 USD.
An Inverted Shoulder Head Shoulder Formation is a sign of a trend reversal and hereby signals us the end of the correction phase that has lasted since 18.02.2021.
After reaching the target and a subsequent correction phase, the price very often rises back to the price target of the Inverted SKS (Superior Retest of the W Formation from the weekly chart) and continues the upward movement.
3. hourly chart
In the hourly chart, we see a Bearish SKS that has its target at 30.33USD. (0.382 Fibonacci area from the weekly chart).
Overarching the possibility exists that a harmonic pattern is formed ( Gartley Formation ).
The Gartley Formation is to be considered as a trend-following pattern and gives the following price targets from point D ( 30.62 USD ): (Blue lines)
Target 1 34.78 USD
Target 2 37.40 USD
Target 3 44.65 USD
All these formations give me personally a good feeling that Lucid Group has a lot of potential upside in the long term.
Finally, I would like to show you a comparison picture to AMC Entertainment, immediately after my analysis at that time, the price of AMC Entertainment rose impulsively to the current all-time high at 77.30USD.
If you liked this idea, I would appreciate a click on the Like button ;)
If you have any questions, suggestions or a different opinion, don't be afraid to use the comment function.
Thanks a lot
Disclaimer:
Please keep in mind that this is a pure analysis and only reflects what my eye shows me ;)
This analysis is for informational purposes only and is scientific in nature.
This analysis is not based on any fundamental data!
This analysis is not an investment advice and should not be considered as a buy, sell or hold signal.
Always do your own research before investing and seek the advice of a qualified person.
I am not an investment advisor or similar and do not make any investment recommendations here.
AMC

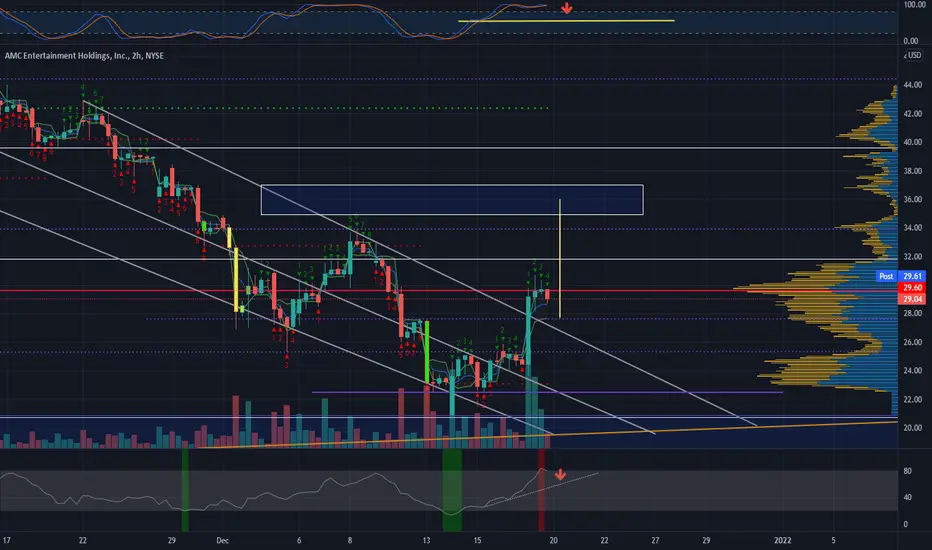
$AMC retracement to 27$ before the break of the 200SMA?AMC has seen a huge rally the past couple of days. This large movement got rejected by the 200SMA at the 32$ range. This is heavy resistance due to the fact that this level contains a bearish OB (Orderblock). The 3h chart indicates that AMC will remain in a bear market a short period of time due to the fact that we haven't gotten a single 3h candle closing within or above the Ichimoku Cloud. The Cloud is being used as resistance. I am looking for a retracement to the 26.85-27.75$ range to hopefully bounce the price and close a candle within or above the Ichimoku Cloud on the 3 chart. Todays dip was driven with low volume which indicates that people are holding their shares.
AMC also closed below a large VPVR node at the 29-30$ level which is seen as strong resistance. The MFI indicator looks to be overbought which could lead to some minor bearish divergence. I would be surprised if AMC bounced from here due to the fact that the there are no reversal signals. We could have a short term runup to get rejected by 29.5$ which could later lead to a deeper retracement. My hopes are that this retracement happens quickly so AMC can get out of the 20's and hopefully break the 200SMA at 32$.
26.8-27.8$ has been heavy resistance before the move to 20$ confirmed with a signifficant amount of Volume. A retest of the previous top (resistance) would be a healthy retracement for AMC. I personally have buy-orders set at 26.85$. If this zone doesn't get hit my order will be adjusted.
A safe entry for AMC would be a daily close above the Ichimoku Cloud and the 200SMA. When the 200SMA is used as support with large volume backed up by the MFI and the Ichimoku Cloud this would indicate that AMC is trading in a bull market. This would lead to the next bull-run up to the 50's.
Also keep an eye on the options. There are some interesting calls out there that could be driving AMC to a new uptrend. The days to cover are rising according to Fintel which could indicate that a short squeeze is near. The short interest of AMC seems to be above 20%.
This analysis should not be seen as financial advise. I am not a financial advisor.
Thank you for reading and feel free to give me your thoughts on AMC.

Big Prophet HK_L61 prediction was wrong againBig Prophet HK_L61 prediction was wrong again.
@HK_L61
Feel free to give us your input almighty HK_L61 Master

AMC Bounce! I'm using this chart since January 2021. Easy patterns apply in this market! Don't overcomplicate things, just rely on the technicals & some fundamentals. Also keep an eye on the option market. The recent spike on friday was predictable based on the put/call ratio.
I'm expecting the price to move towards the top of the bull flag. Everything beyond that is wishful thinking instead of predicting. We would like to see a higher high with a breakout of the bull-flag and a similiar situation as during the squeeze in january. Let's see if the buyers are able to continue with the momentum. This could lead to the retail market joining the party again.

EXACTLY THE SAME AS LAST CYCLEhow can you be bearish on a manipulated stock like amc. It looks exactly the same as the before January squeeze.

Stock is worth around 5In reality this stock is worth around 5 but it might not go that low. Probably we bounce now and continue the downtrend. Maybe i open a put spread later.

AMC On track for the big move* NFA *
The hedges are moving right on FIB levels. They will try hard to pushback price to $36~$35 range.
It will exactly line up with my salary day! Hedges R Fok!
* NFA *

GME Back on track as Omicron dusts settle down
!! NFA !!
As the Omicron hit the scene, hedgies piled up on shorts as a last ditch effort for bringing the apes down. Now that the Omicron dusts are settling down, people are back at it and price is currently on an up trend.
Our friends at AMC got rejected at 200MA on 24H chart today. I Predict the same scenario for GME to happen. At the current rate, we will hit the 200MA at around $180. This price area is a bleed area for shorts, as they will be once again under significant loss.

Genius brands multiple bullish signalsGenius Brands (GNUS) in a bullish descending wedge chart pattern with bullish stochastic & RSI divergence. This stock is currently shorted to the tune of 16.51% (47,084,674 shares).
Projected price of circa $3.42 (+190%) based on doubling of wedge height, excluding short covering and the infamous reddit armies involvement in driving the shorts into the ground!
Genius brands is one of the original 'meme' stocks of 2021 which trading was famously halted on during the GME short squeeze.

AMC entry/exit pointsIf you're not already in AMC I would wait for a clear break through $32 before it continues up towards $36.
Otherwise I would wait for a pullback to the $27 area.

AMC Squeeze?$AMC I like all the momentum and news coming into this.
And with the new Spider-Man movie it still has a positive catalyst pushing it up.
Reclaimed supply and is holding trend nicely for now.
I’m long over supply above 30.50
or I’ll look to BTD around $28.62, lowest BTD is 27.2

Greed has a tendency to show itself going for the bottom!Multiple different time frames throughout stocks history. They stretch it out to the negative as much as they possibly can. It is running a pattern most certainly. Could be in another prime spot here unless they work it down much further!

AMC Held SupportNice hold at the 28.79 area. Next test is the 30.50 area then TL with major resistance right behind it at 31.74 area. Good luck out there. Ape strong
P.S. - This is the first time I've noticed a check box to abide by the house rules. For any sick asshole that attacks other people online, whether it a moderator or not, should do some soul searching and be a better human. Don't like what you see? Click away and move on.

AMC prediction next days?NYSE:AMC
this prediction dose not match a timeline this can play in short time or in days . Not financial advise general idea

$AMC Spider-Man Rally IdeaI am thinking $30 for a long term hold in IRA. There seems to be a lot of hype around Spider-Man and I personally went to the movies to watch it. It felt good seeing a packed movie theater again.


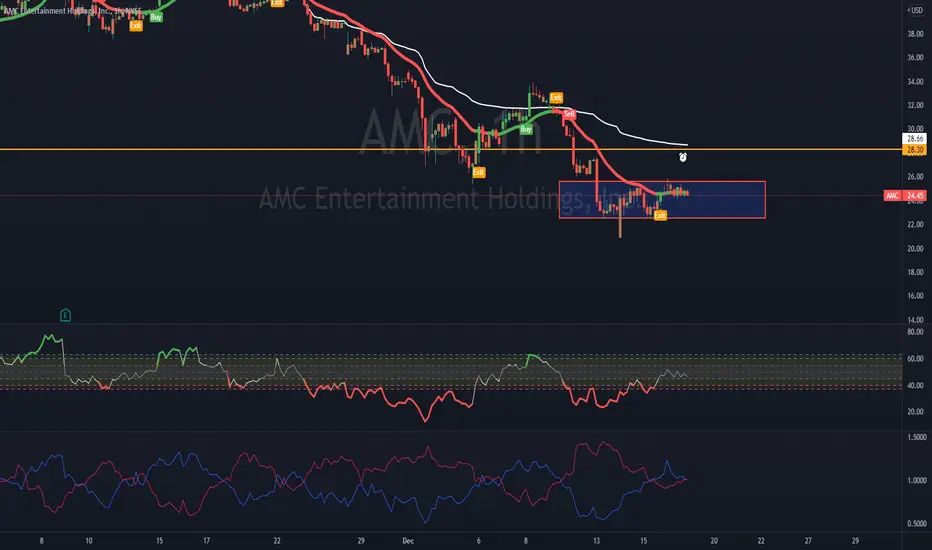
AMC Cup with Handle (Target 36$)AMC made a perfect bounce of the 0.786 Fib level (20$ level) earlier this week. This lead to a technical breakout above the 25-26$ level of resistance. We have established strong support at the 25-26$ range with signifficant volume spikes. We are at the micro times frames trading above the VWAP which was previously seen as resistance becoming new support. I am looking at a healthy retracement to the low 28's or 27.7$. These levels should hold. Otherwise i am expecting 26.7$ as a strong support zone which should lead to a good bounce.
At the current time we are overbought on the MFI and the Stochastic. We also haven't managed to close above a huge VPVR resistance node at the 29.7$. This could push the price for further downside but is in my opinion unlikely due to the fact that AMC has started to trade with higher volume. AMC is currently on a short term uptrend with increasing volume. Remember the trend is your friend and that volume predicts price.
We are on the 2h chart seeing a cup and handle formation. This is a very bullish pattern. I am expecting a little dip for the creation of the handle towards the high 27$ range. Tis would create the handle and bounce the price to 34$. If this level of resistance is broken (34$) with a high amount of volume making it new support we are going to trade above the 200EMA which is a bullish reversal sign. The cup and handle formation could lead to a break of 36$ which would make us fill the gap at 38.8$. At this point of time i am expecting a signifficant amount of FOMO-Buying which could bounce the price even more up to the daily VPVR level of 40$. If the overall market sees a bounce AMC should follow nicely which could lead to the continuation of the uptrend.
The target of 17$ that a lot of people in the AMC community have been speculating is not likely at the current state.
*WARNING* (This article should not be seen as financial advise. I am not a financial advisor.)
Thank you for reading
AMC PURE WYCKOFFIAN PERSPECTIVEThis is my predition using the accumulation schematic adjusted for current supply and demand.
Good luck and have fun fellow apes.
Not financial advice.
AMC200
LFG

Dogecoin and AMC ..!There are incredible similarities between the 2..!
One is a meme stock and the other is meme crypto!
Weekly chart:
I think Dogecoin soon will be 10cens or lower!
You can see the most important support (green lines) and resistance (red lines) to watch in the coming days in these charts!
Best,
Moshkelgosha
DISCLAIMER
I’m not a certified financial planner/advisor, a certified financial analyst, an economist, a CPA , an accountant, or a lawyer. I’m not a finance professional through formal education. The contents on this site are for informational purposes only and do not constitute financial, accounting, or legal advice. I can’t promise that the information shared on my posts is appropriate for you or anyone else. By using this site, you agree to hold me harmless from any ramifications, financial or otherwise, that occur to you as a result of acting on information found on this site.

AMC Trade IdeaAMC still holding strong today, If it had to fall then today was the day but it looks like it will rise back to $29.50 before any fall further.
share.trendspider.com
BKKT - Turning point coming soon?YOU TELL ME JAVIER, WHAT WE SAYING BROTHER?
BKKT (Bakkt Holdings) ironically, i am actually BULLISH on this asset in the LONGTERM, but on an intraday, trading basis, i think we have entered a naughty bearish down move, with us approaching some interesting levels.
My target area is as detailed, but i do have TP's set for levels between 10$ & 15$.

AMC Trade IdeaThough AMC is going higher but do not think it's back to bullish pattern, this is just a regular Pullback Trade and if you are in a buy trade then take profit at $28.31, yes It can go to $29.77 but do not wait for it and better book profit at $28.31.

Trendline Template PT 2 AMCMy take for this.
We have bottomed out, and all you apes with put options are f Ok T
Best get out now or suffer the consequences ;)
not financial advice
amc200
les F ING GO!
