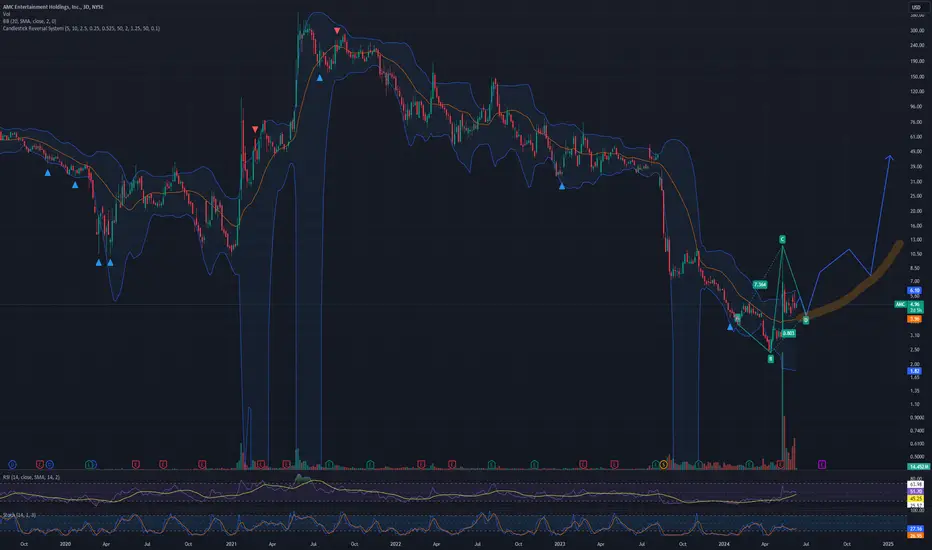
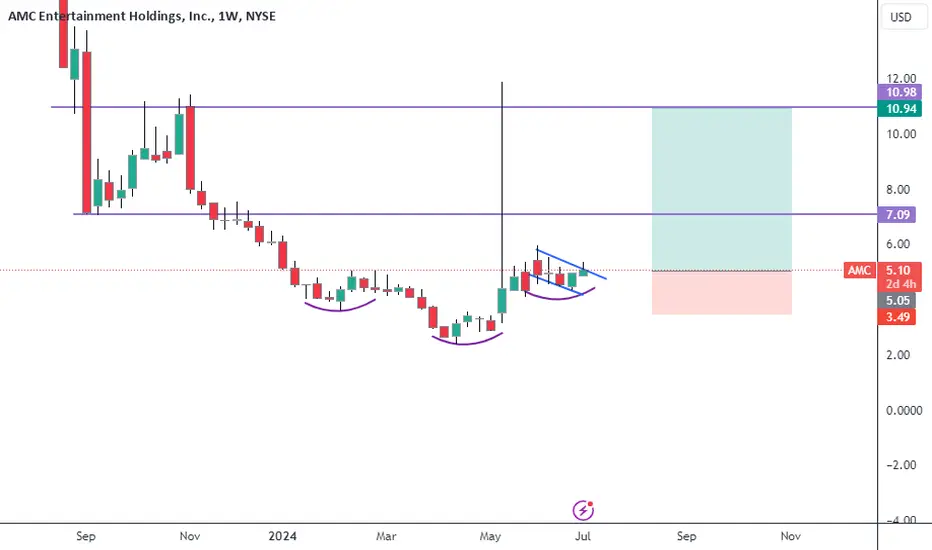
AMC | The time to go long has come- Timeframe: Weekly
- Trade type: Buy stop order
- Price: 2.78
- Take Profit: Open
- Stop Loss: 2.54 (-8.60 %)
Idea: Long on a breakout above last week's high - bullish momentum continuation.
Entry: Buy stop above last week’s high.
Stop-loss: Below the low of the same candle.
If the weekly candle c
Compare with AMC Entertainment Holdings, Inc.
Key facts today
−1.06 USD
−632.40 M USD
4.85 B USD
887.21 M
Next report date
—
Report period
—
EPS estimate
—
Revenue estimate
—
Company info
Sector
Industry
CEO
Adam M. Aron
Website
Headquarters
Leawood
Founded
1920
IPO date
Dec 17, 2013
ISIN
US00165C3025
CUSIP
00165C302
FIGI
BBG000TDCVT6
Identifiers
ISIN US00165C3025
AMC Entertainment Holdings, Inc. engages in the theatrical exhibition business through its subsidiaries. It operates through the U.S. Markets and International Markets segments. The U.S. Markets segment is involved in owning, leasing, or operating theaters and screens in the U.S. The International Markets segment focuses on owning, leasing, or operating theaters and screens in the United Kingdom, Germany, Spain, Italy, Ireland, Portugal, Sweden, Finland, Norway, and Denmark. The company was founded by Barney Dubinsky, Maurice Durwood and Edward Durwood in 1920 and is headquartered in Leawood, KS.
Potential duplication in AMC🚀 AMC Weekly Analysis: Rounding Bottom & Structural Breakout Targeting $5.00+ (1:6 R:R Setup)
Idea Description:
AMC Entertainment Holdings (NYSE: AMC) on the weekly timeframe (1W) is currently consolidating within a critical accumulation zone, exhibiting clear signs of a structural character chang
AMC: Is the next meme-stock expansion quietly being built?What is good boys,
This one is getting really interesting.
AMC currently has 2 taps inside the range, and now I'm waiting for the piece that matters most:
The 3rd tap.
If price gives us that third tap and properly confirms the accumulation model, the upside projection is insane.
The local rang
AMC Entertainment Wave Analysis – 11 August 2026
– AMC Entertainment reversed from resistance level 2.92
– Likely to fall to support level 2.200
AMC Entertainment recently reversed down sharply from the major resistance level 2.92 (which stopped the previous sharp impulse wave 3 in July) intersecting with the upper daily Bollinger Band.
The d
AMC | Trifecta: Blockbuster Revenues, Layoffs and 5 Year CoilWhether your tracking theater chains like AMC capitalizing on a massive post-pandemic box office rebound, or major media empires like Disney and Paramount getting lean, this general-purpose, high-energy information is built for you.
Every now and then, the market creates a structure so beautifully
rising wedgeNo, a rising wedge is generally considered a bearish chart pattern. It forms when an asset's price moves upward within converging trend lines, signifying that buying momentum is weakening. Traders typically look for a downward breakdown, indicating a potential reversal or continuation to the downsid
$AMC about to rip faces higher all the way to $2.5-3.NYSE:AMC is following this trend line, at the golden pocket. It is showing signs of starting an uptrend with higher highs and higher lows. If you long NYSE:AMC here at $1.65, the trade till the gap fill offers a 13.5 R/R.
If the price manages to bounce, then it has a potential to create a bulli
See all ideas
Summarizing what the indicators are suggesting.
Neutral
SellBuy
Strong sellStrong buy
Strong sellSellNeutralBuyStrong buy
Neutral
SellBuy
Strong sellStrong buy
Strong sellSellNeutralBuyStrong buy
Neutral
SellBuy
Strong sellStrong buy
Strong sellSellNeutralBuyStrong buy
An aggregate view of professional's ratings.
Neutral
SellBuy
Strong sellStrong buy
Strong sellSellNeutralBuyStrong buy
Neutral
SellBuy
Strong sellStrong buy
Strong sellSellNeutralBuyStrong buy
Neutral
SellBuy
Strong sellStrong buy
Strong sellSellNeutralBuyStrong buy
Displays a symbol's price movements over previous years to identify recurring trends.
Maturity dateFeb 15, 2029
Coupon7.50% (Fixed)
Maturity dateFeb 19, 2029
Coupon11.50% (Fixed)
See all AMC bonds
Frequently asked questions
The current price of AMC is 2.65 USD — it has decreased by −3.79% in the past 24 hours. Watch AMC Entertainment Holdings, Inc. stock price performance more closely on the chart.
Depending on the exchange, the stock ticker may vary. For instance, on NYSE exchange AMC Entertainment Holdings, Inc. stocks are traded under the ticker AMC.
AMC stock has fallen by −3.05% compared to the previous week, the month change is a −10.88% fall, over the last year AMC Entertainment Holdings, Inc. has showed a −2.57% decrease.
We've gathered analysts' opinions on AMC Entertainment Holdings, Inc. future price: according to them, AMC price has a max estimate of 4.00 USD and a min estimate of 1.80 USD. Watch AMC chart and read a more detailed AMC Entertainment Holdings, Inc. stock forecast: see what analysts think of AMC Entertainment Holdings, Inc. and suggest that you do with its stocks.
AMC stock is 10.04% volatile and has beta coefficient of 3.30. Track AMC Entertainment Holdings, Inc. stock price on the chart and check out the list of the most volatile stocks — is AMC Entertainment Holdings, Inc. there?
Today AMC Entertainment Holdings, Inc. has the market capitalization of 2.37 B, it has decreased by −1.15% over the last week.
Yes, you can track AMC Entertainment Holdings, Inc. financials in yearly and quarterly reports right on TradingView.
AMC Entertainment Holdings, Inc. is going to release the next earnings report on Nov 11, 2026. Keep track of upcoming events with our Earnings Calendar.
AMC earnings for the last quarter are −0.02 USD per share, whereas the estimation was 0.00 USD resulting in a −609.94% surprise. The estimated earnings for the next quarter are −0.04 USD per share. See more details about AMC Entertainment Holdings, Inc. earnings.
AMC Entertainment Holdings, Inc. revenue for the last quarter amounts to 1.60 B USD, despite the estimated figure of 1.50 B USD. In the next quarter, revenue is expected to reach 1.42 B USD.
AMC net income for the last quarter is −11.40 M USD, while the quarter before that showed −117.10 M USD of net income which accounts for 0.00% change. Track more AMC Entertainment Holdings, Inc. financial stats to get the full picture.
As of Sep 5, 2026, the company has 33.31 K employees. See our rating of the largest employees — is AMC Entertainment Holdings, Inc. on this list?
EBITDA measures a company's operating performance, its growth signifies an improvement in the efficiency of a company. AMC Entertainment Holdings, Inc. EBITDA is 585.00 M USD, and current EBITDA margin is 7.08%. See more stats in AMC Entertainment Holdings, Inc. financial statements.
Like other stocks, AMC shares are traded on stock exchanges, e.g. Nasdaq, Nyse, Euronext, and the easiest way to buy them is through an online stock broker. To do this, you need to open an account and follow a broker's procedures, then start trading. You can trade AMC Entertainment Holdings, Inc. stock right from TradingView charts — choose your broker and connect to your account.
Investing in stocks requires a comprehensive research: you should carefully study all the available data, e.g. company's financials, related news, and its technical analysis. So AMC Entertainment Holdings, Inc. technincal analysis shows the strong buy rating today, and its 1 week rating is buy. Since market conditions are prone to changes, it's worth looking a bit further into the future — according to the 1 month rating AMC Entertainment Holdings, Inc. stock shows the sell signal. See more of AMC Entertainment Holdings, Inc. technicals for a more comprehensive analysis.