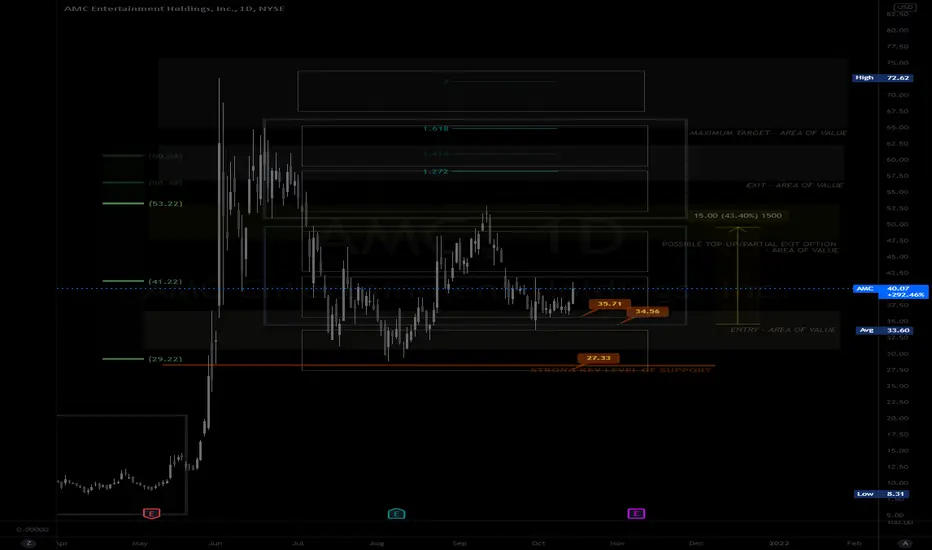
MY MINIMALIST ANALYSIS FOR $AMC10.15.21 1150H +8 SINGAPORE
ALERT: GOOD ENTRY
HOW TO USE MY CHART
It is designed for SWING TRADES at the BOTTOM. I do not SHORT, though, you can still use it.
Created on a WEEKLY & DAILY Analysis of Dynamics of the Market.
LARGE BOXES are major pivots that will occur, while the small boxes are MINOR PIVOTS. These can be entries to a BUY/ SELL POSITION or an EXIT/PARTIAL EXIT/TOP-UP AREAS.
Watch out for Chart Patterns, Candlestick Math, Market Dynamics, and your Fibs.
This CHART is best used without indicators.
Price action, candlestick /bars, and FIBS alone will be sufficient as a major deciding factor for this MINIMALIST CHART.
Disclaimer:
The findings/predictions of the following analysis are the sole opinions of the publisher of this idea and must not be taken as investment advice.
Thank You for your appreciation and support (fFollows, Comments and Likes.)
Amcentertainment

AMC's tripple Pennant, and Algo ControlNot Financial Advice.
Been charting a while, first time I've seen such blatant symmetry on OBF.... not sure if it's intentional, a bull trap, or a projection of what is to come but AMC looks like she could squeeze higher based on the symmetry shown on the OBF. Timing should be within the next two weeks.
As someone who charts regularly, this does not appear to be completely natural price action, a derivative flow of sorts. Flow does not naturally reproduce two pennants of identical shape and structure, and certainly not a third. And while the wave length within the pennant is of a different length, the symmetry shows the hallmark of something potentially algo controlled. Basically a transposing of the original squeeze at higher and higher Px levels as a method to extend the squeeze across a long time frame. Need to see it jump into the third range, and OBF to fly on a squeeze cover for this to be fully confirmed.

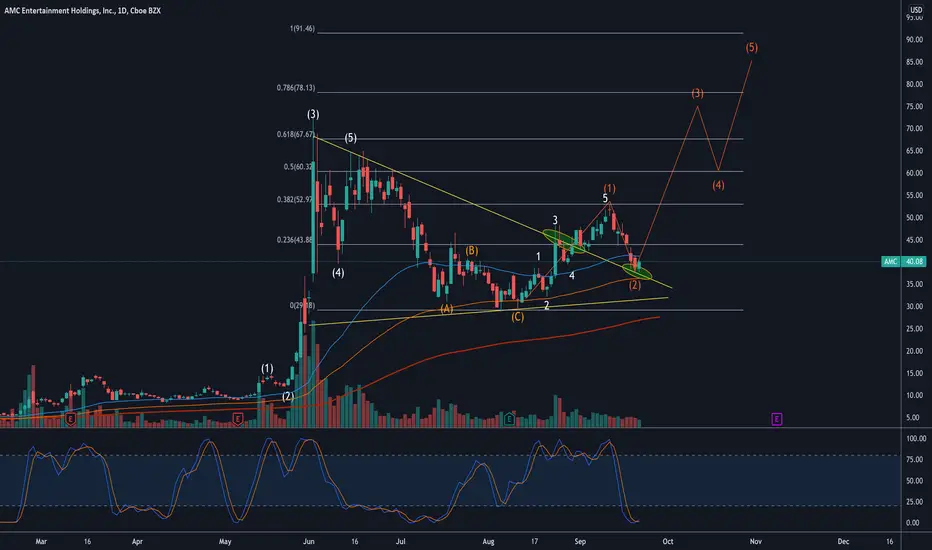
AMC symmetrical Triangle AMC forming a very nice Symmetrical Triangle, which is a neutral pattern and could go either way. However the down target is unrealistic without some very unfortunate news. The long target is $91.68. We have a daily MACD cross up about to happen as well. Great buy in spot with small stop loss if it breaks downward. I think this will play out by EOY. After earnings come out might take off!

AMC ELLIOT/WYCOFF ACCUMULATION ANALYSISNothing much to say just love doing these charts lol. Been here since January NYSE:AMC

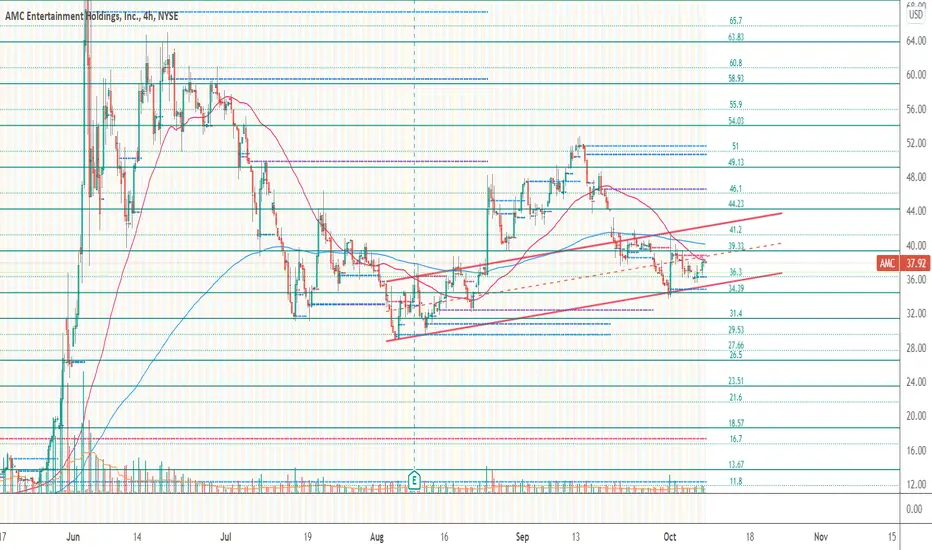
The critical price range for AMC
We have 39.30 and 34.40 at the lower trading zone and 44.20 and 39.30 at the next zone up.
AMC gapped down from 44.20, fell to around 34.40 and currently has 39.30 as a major resistance point. AMC is now trading in 39.30 and 34.40 trading zone.
It will need to hold above 39.30 to continue back up and fill the price gap at 44.20
AMC STOCK- I believe this is how the next move up will be.So basically I used bar pattern and traced it from March-June rup up. It matches perfectly to where we are at right now. Also kinda interesting that Elliot wave theory corresponds perfectly to where the bar pattern follows. (look at 1.61% and 2.61% fib tracement). So I believe that it will go to somewhat mid 40's, goes back down, and then touches low 50's again. Dips a little, and then the fifth wave begins (of macro 5) which it will gamma squeeze somewhere around 200.

AMC Possible 3rd wave out of MACRO 5NYSE:AMC
I think it will go down to 35, where the fib retracement is and where amc just broke out of. After that it matters how explosive the third wave is but at this moment price target overall is 54.

AMCAMC Entertainment Holdings Inc (NYSE:AMC) Rallied nicely Thursday on volume and broke out of a descending channel. If it clears back over 42, it may have some good upside.

AMC still in the make or break !!! Small update compared to my previous chart. Note that this is a speculation play based on the cycle theory but I still we are in the right direction.
The dip is expected and so is the breakout of the trend line to the downside. The coming days will prove this theory soo lets see !!! :)

AMC repeating itself after 87 bars? idea of repeating squeeze pattern, will this happen october 5 ?!
APES buy and hold the dip

$AMC Gap needs to be filledWe're watching what $AMC does and expect that sooner than later, the GAP marked on the chart will be filled.

AMC trade IdeaAMC is currently below 144 WMA and under selling pressure but it's not looking that bad, while you apply it to daily TF it's holding firm above 144 WMA, currently, AMC needs to break above $40.86 to get out of the current consolidation and then next it will face resistance at near $42.85. Get this indicator by visiting my profile under the Scripts section.

Huge break out potentially coming soon! Prepare the rocket!I’ll let the technical analysis do the talking. Any opinions are very welcome.

AMC buy SignalOh! So there is a Buy Signal on AMC and SPY is flying already. Looks like if this Buy Signal Hold we may see $44.31 on AMC and SPY will be back to bullish.

AMC Make or Break PART 2 OK, so i posted this one earlier in the second red circle a dip of 29.4% is the exact same dip before the June sqeeuze. Ofcourse this is a bit speculation but if the cycle theory is true 37.29 is the lowest point. If this breaks I believe the cycle theory is BS. In the upcomming 9 days we should see some upward movement and beginning of October it should start popping..
But all in all this is a bit speculative and I believe that the stock is manipulated and this theory could apply.

AMC LIVE TRADINGLooks like #AMC is slowly coming positive, We will see resistance at $42.37 and if broken we will see the next resistance at $45.01. Unfortunately, Live Stream on tradingview has an issue so same Live Stream of TradingView chart and Setup you can watch on YT, Click below YouTube Button to join Live trading Session on YT.

Elliot Wave 2 short idea. As you may know from my previous posts, I'm overall long on $AMC. However, I think we ended our fifth wave (within first wave) at $52 and we're looking for a short term pullback to complete wave 2.
PT: $38-40

$AMC Chart updateI'm waiting for the pullback to $42 or lower before jumping in on a long position with my first target of $50, second target at $57. What do you think?

AMC perfect entry and exitIs there any other script which determines entry and exit with this perfection?

AMC SECOND CORRECTED WAVE ALMOST COMPLETEAMC is in the 2nd corrective wave of Wave 1. I believe third wave will begin around the $40 Mark. Right now Amc is on leg C of the ABC.

So many similarities compared to the previous runup patternThe WHITE line pattern indicates AMC currently. The GREEN line pattern( Which I purposely offset to see easier) was the exact chart pattern with a 5 minute time frame from May 13th to May 24ths breakout. I think we will see a little deep for the next two weeks and then come beginning of October... the just may be upon us.....
Friday-17th We should See some sideways controlled movement, possibly end of day push to send it down to get in to the Option price zone they want. Expect Monday the 20th to dip to the 22nd, possibly 23, then finish sideways for the week. Then Monday to Wednesday end of September she moves sideways, until, THURSDAY..... October FIRST, New month..... Then it comes alive....... unless they have plans to full on exit and send the stock down as much as possible, then we sit back and watch the MOASS play out.... Personally, I think this gets controlled until next year and possibly popping then full fledge. Could be a Tesla slow squeeze...... shoot, maybe hedgies default and not pay like China...... Heck does anybody really know anymore?
