SOXX 2D: WHERE ARE SEMI'S HEADED?SOXX, 2D: Taking a look at the SOXX 2D chart I have drawn out a linear regression channel beginning on November 12, 2021 which was about 7 weeks prior to the ATH print at 557.12 on January 3, 2022. The SOXX proceeded to decline approximately 41% from ATH (557.10) down to its recent low at 326.70 on July 1st, 2022 before rallying almost 30% off the floor to 424.78. So, where are we now, and where are we going next?
Linear Regression: The linear regression channel in the chart is divided up by color and is illustrative of 6 standard deviations of potential price action expressing a 6 sigma potential linear range of 435.18 – 279.37 with the high confidence interval range (+-2SD) from 408.93 to 305.61. Our linear mean is currently sitting at 356.78 with a Pearson’s R^2 indicating a high central tendency at 0.894. the linear mean and is currently expressing a potential linear range of 435.51 (+3SD, red) to 308.20 (-2SD, blue). As we can see the recent rally is filling out the upper end of the linear range, clearly pushing deeply into the upper 3rd standard deviation range off the linear mean. Using central tendency as an approximation of trend strength there is a high potential for price to mean revert down to the 356.78 price region.
Fibonacci Retracements: I have left the Fibonacci Retracements up in the background and have also added white lines to mark the significant levels of 0, 0.5, and 1 retracement respectively. Despite the overextended nature of the recent rally, price failed to breach the 0.5 Retrace at 441.91 which would have gone a long way to indicate a high potential for the lows to be in. It is important to note that if price were to breach the 0.5 retrace to the upside it would reduce the probability for lower lows this year but would not eliminate them entirely.
Elliot Wave: It is my position that we are in the 5th wave down from the ATH as illustrated by the yellow EWT count on the chart. Given the somewhat unruly nature of 5th waves and their increased potential for irrational behavior, we will leave some grace with regard to our expected landing zone. It is my prediction that we will bottom out somewhere in the 334-303 range as illustrated in the yellow, square box. This thesis is in confluence with market trends during mid term election years in the month of September, which is that they have a tendency to decline through the month of September and early October before rallying into the late fall/winter after the election.
EMA Envelope: Our EMA envelope (top box), is a trend based EMA indicator based on the last 40 days. The envelope turned bearish(red) with a body close below the 387.12 price point and would turn bullish (green) if price were to bounce back up over the 405.83 price point. Signal is currently residing in the neutral zone as indicated by the yellow in the top box.
VFI (Volume Flow Index): Our volume flow index is a fixed range cumulative indicator based on the last 130 periods, which on a 2day time frame spans the last 260 days. As we can see the green line representing the volume flow is crossing over its moving average to the downside. Please also see that our VFI signal also failed to breach the zero and has not risen above the zero line since the late March rally.
RSI: Our RSI is sourcing data using a hlcc range configuration to add data point density to the measurement and potentially at the sacrifice of a more discerning measurement that might come from using a close only price range configuration. What we see is our RSI signal currently entering the bearish end of its range (<45).
MACD-X: Our MACD indicator is showing our lag differential (12-26) crossing over our 9 period ema to the downside and beginning to print its first few bars of negative trend coming off the recent rally which began at the beginning of July for the SOXX ETF.
SUMMARY: We have moving average trends rolling over to neutral from being recently bullish, volume flows that have been trending upward recently but not at levels supportive of 2021 price levels, an RSI that never hit overbought and has since reverted back to its median and a MACD beginning to indicate the potential for a downward trend to emerge.
What the above summary of indicators appears to be from my perspective is an upward retracement within a larger downward trend, or what is more commonly known as a “bear market rally”. It is my position that price will decline to its linear mean at 356.78 before making a decision of whether to spill further or consolidate in a range bound, downward trending diagonal. Until fundamental headwinds provide a better catalyst for the technicals to improve going into the late fall/early winter it would not be unreasonable to expect further downside volatility.
AMD

AMD + The Power Of Confluence - Measured Move & Target LevelsHello Traders, here is my analysis for AMD. - I apologize for the crammed chart, I did the best I could to keep the chart as simple yet detailed as possible. - Onto the analysis...
First off, if you're a new trader, this chart is an example of what the planning process for a swing trade could look like. Of course there are many different strategies, but for me this is the process I go through when planning a trade.
***Before I start with the breakdown, I want to point out how amazing TA can be: If you look at the chart, at the ("4)Bounce/Rally Target Level") at $85.50. That target was taken from finding the average % gain of the prior 3 bounces (36.76%) and projected it from $62 (Probable bottom). Whats so amazing is that the $85.50 level is also key resistance and directly at the descending trendline. - This amount of confluence tells me that there is a high probability that this move could play out in a similar fashion.
Like many other charts, AMD is overdue for a bounce... The questions that need to be answered are:
1) What level do I think it will bounce from?
2) What is the potential profit target?
3) Where do I enter positions?
1) "Where do I think it will bounce from?"
- To answer this, I used technical analysis to come up with the most probable level for a bottom.
- $62 is where I believe AMD is most likely to bounce from.
*As you can see AMD is oversold, this tells me that the sellers are likely becoming exhausted and will eventually stop selling.
*It looks as though AMD may make a measured move (measure the prior high to swing low = 25.63% - Project 25.63% from the swing high at $85.5 = $62)
*The measured move to $62 also happens to be a Gap Fill level which adds confluence to this potential target and adds confidence to this level being a bottom.
2) "What is the potential profit target?"
- The potential profit target for a bounce is $85.50 (This is from being projected off $62)
*I took the averages of the prior three bounces (36.76%) and projected it from the "probable bounce level"
3) "Where do I enter positions?"
- First off, you never want to try and time the bottom for one entry. It's rare that anyone consistently can time bottoms.
- More often than not you'll miss entries this way.
*What you want to do is figure out where you think price will likely bounce from, in this case $62 and enter multiple positions at key support levels on the way down.
*As you can see I've labeled Entries 1-3 on the chart.
*Enter small positions (start with 1% - 2% of your portfolio)
*You never want to be in a position where one trade can wipe you out.
*Entering large positions is not trading, it's gambling. You increase the risk to a point where the probabilities are no longer in your favor.
*Entering small positions ensures stability and longevity as a trader.
That's it, I know it was long but I hope that this was informative.
Thanks everyone and best of luck trading!

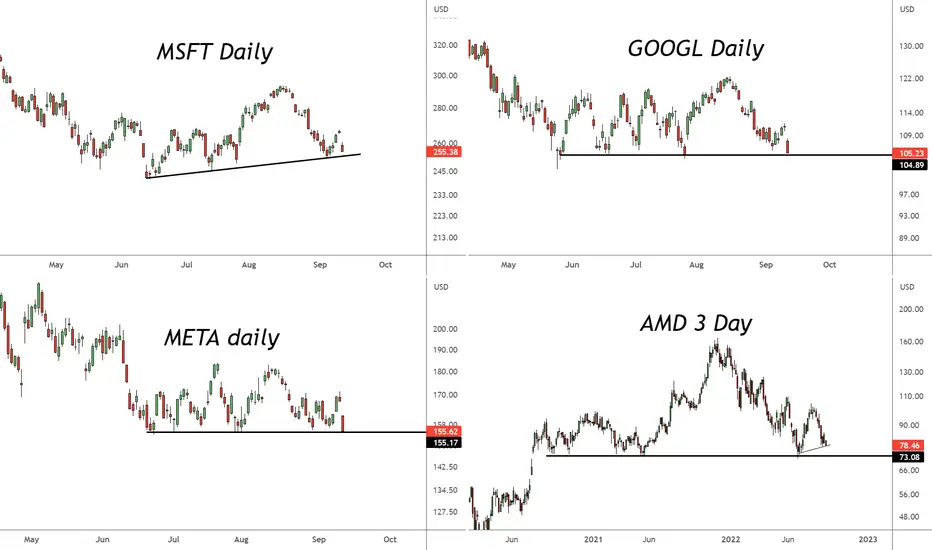
AMD Breaking Support LevelChart analysis: AMD has broken support level at 71.97, expect going to next level of support at 65.09.


pin signal rejection on $SPY key horizontal levelFOMC tomorrow. but look at this set-up. again, a pin bar is rejected from a horizontal key level and from bands on $SPY. place the stop and profit target then let the market do the work. This is a bounce play. not a statement for long-term investment

Big Tech - Head & Shoulder Pattern Galore These four big tech stocks are on thin ice.
A break of these necklines suggests more downside. These levels likely indicate around 11,900 on the Nasdaq as the line in the sand.
Question is, does this lead to capitulation or a longer duration downtrend. TBD...
Nasdaq 11,900 level = red line
Possible Long on SPX500 for next week, W is still bearish!Here we give price breakdown on SPX from weekly daily 4 hour perspective.
And give an idea of what to do during this coming week!

Elliott Wave View: AMD Rally Expected to Fail in 3, 7, 11 SwingShort term Elliott Wave view on AMD suggests the decline from 8.5.2022 high is unfolding as a zigzag Elliott Wave structure. Down from 8.5.2022 high, wave 1 ended at 90.9 and rally in wave 2 ended at 97.60. The stock resumes lower in wave 3 towards 78.52 and rally in wave 4 ended at 83.80. Stock resumes the final leg lower in wave 5 towards 77.74 which ended wave (A).
Wave (B) rally ended at 86.05 with internal subdivision as a zigzag. Up from wave (A), wave A ended at 80.80, wave B ended at 79.24, and wave C ended at 86.06. The stock has turned lower in wave (C) with internal subdivision as a 5 waves impulse.
Down from wave (B), wave ((i)) ended at 83.46 and rally in wave ((ii)) ended at 85.45. Stock resumes lower in wave ((iii)) towards 76.80 and wave ((iv)) ended at 77.37. Final leg lower wave ((v)) ended at 75.87 which completed wave 1 of (C). Wave 2 rally is in progress to correct cycle from 9.12.2022 peak towards 78.67 – 80.03 where sellers can appear for 3 waves pullback at least. As far as pivot at 86.06 high stays intact, expect rally to fail in 3, 7, or 11 swing for further downside.

AMD trade setup idea 15-september-2022AMD is in a downward channel since Jan this year. Partly because of the Semiconductor issue.
The current support level is an important level(75-77) for AMD. It has already tested this level twice.
We would have to wait for the price to show us the direction.
If we cross 78.5, we could take a long position with the first target around 83.5 levels.
If it penetrates the support levels of 75, we could take a short position with a mid term target of 60.

Double Bottom Pattern / AMD $110-120Hey, AMD is forming a good looking double bottom pattern and is primed for a breakout leading up to earnings 10/25 if the stock can get through the $94 range. AMD has strong support at the $70-75 range and has rallied upwards of $100+ when that resistance is tested, which it has been recently. I believe AMD has been beaten down more than the other comparative semi stocks and is due for an upward correction. Obviously this is dependent on the FED rate hike, however the market has priced in a full basis point and I strongly believe we will actually get a .75 considering we haven't had a full point hike done in a very long time. I see Powell playing it safe and not shocking the market, causing the market to react similarly to the July-August transition, which in turn sparked a huge bull rally. With all that being said... AMD is cheap with good call options prices.
AMD to $110-120

AMDDumper nicely since I last posted this chart. Weekly RSI breaking down again on the weekly chart and daily RSI rolling back over. I expect this to continue to dump and come down to the .786 and possibly the .886 which is the COVID high. May build out support at the COVID high around $60 or possibly dump more. I think the former is more likely though. I expect this to follow the rest of the semiconductor market given they have sold off extensively. Time will tell.

NVDA DAILY WOLFE WAVE SETUP OVER THE WEEKENDOn Sept 2, 2022, a daily wolfe wave entry was triggered. The projected target is calculated by extending a linear line between pivot 1 and 4 and projecting the line. This is represented as the green perforated line, as shown in the chart. Since there is no apex associated with the daily wolfe wave, an alternative price objective would be required using gaps, previous support levels or time. If there was an apex formec, then the projected target is defined by identifying the apex location and projecting a vertical line toward the green perforated projection tgt which is extending from left to right. Short term target is near gap at 150 or 21 day ma which is 164. Conservative level would be 155. I hope this helps.

AMD strong sellAMD has fallen out of the bullish trend channel and it couldn't show strength afterwards. Maybe the fall will stop at $73.
Entry price: 81
Target price 1: 73 +10.9%
Target price 2: -
Stop-loss: 87.5 -7.4%
Period length: 18-20 days

AMD - TRADE PLANCheck out the trade plan for AMD today based on the technical analysis. Hope this analysis is useful, make sure to hit the thumbs and also follow my tradingview profile for future updates. Thank you!

AMD, WeeklyAMD Weekly
Disclaimer : I am not a financial advisor nor a registered investment professional. This content is for entertainment purposes only and is not investment, tax, or financial advice. Always do your own diligence and research. You are solely responsible for all investment, tax, and financial decisions that you make.

AMD - Buy Point I know we're not supposed to be buying stocks right now. Just ask Powell.
What can I say....I'm a rebel...
AMD Testing the top side of the descending trendline. I like this set-up. Good risk-defined buy point.
Could be a good long call option play. Risk to sub .786 Fib retracement @ $78.50
Zoomed out Daily LOG Scale
Monthly LOG

AMD Ppotential inverse head and shoulder Potential inverse head and shoulder
MA 50D Support at bottom

AMD (Daily): Are we setting up for a fierce rally?Short update for those following along. We are closing in on circle wave ii support. As previously shown in the chart below:
So, we have a five wave impulse into wave circle i with a three wave corrective moving dropping down in the the wave circle ii support. Can it go lower? Sure. Another low to test the longer term .382 retracement of wave 3 is not off the table (see yellow 4 on chart and/or post about AMD Big Picture). Can we chop sideways for a bit in a protracted wave circle ii before we start wave (i) of wave circle iii. Sure. So what was the plan again? I believe I wrote:
"It might not be a bad idea to start layering into a position from around $87 to $80.00 with a stop around $80-$76. But it is probably best to wait for the (i)-(ii) of circle iii for the highest probability trade (again, not shown yet). Although this price action deserves some respect and a close eye, caution is warranted until price holds circle wave ii support and makes a new high for wave (i) of circle wave iii."
Since then, price made a slightly higher high in wave (v) of wave circle i, so the support is a bit higher than the last chart. But those confines still seem pretty applicable. Layering into an entry with a stop set between $80 and $77 seems like a good risk management plan. Assuming price can hold wave circle ii support, we could be getting ready to rally something fierce. If not, your stops are set and in place to limit the pain of another low. It's a purely objective plan based on price action and Elliot Wave Theory.
Overall, this chart still looks solid. I'll map out waves (i) through (v) of circle wave iii once/if price tests its last near term high of $104. If I have time, I'll probably post one or more additional charts showing smaller time scales or progress in the comments section below.
#LongAMD
#WaveTheory
#NotAdvice
#NotRecommendation
#MeasuredMoves
#PriceIsKing
#GoodLuck

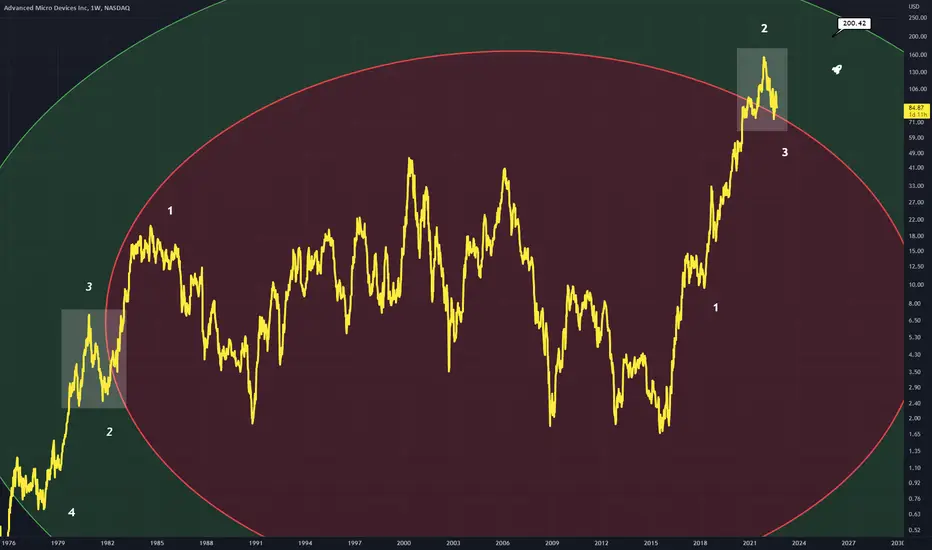
AMD Thoughts I set a target of $200 for AMD on this analysis based on the Fibonacci circle movement
(2),(3) are comparable areas, both aligning along 1.618. They can be interchanged as (2),(3)
(4) is the price reached at 2.618. Using this 2.618 reach we can apply it to the bullish situation saying price will again touch this level.
I am bullish on AMD .
2X $AMD TP1&2 HIT for 15%! (PERFECT MOVE)$AMD has broken and retested our entry and hit both take profits! WHAT A PERFECT MOVE!!! We are going to play the next leg down to finish this sequence @TP3, if there is a pull back! IF not then we set trail stops and LOCK IN PROFIT!

$AMD Inverse Head & Shoulder - Bring the dip ill buy the chips!Semi-conductors/chip stocks took a big dip this week after more negative earnings reported.
I am watching this inverse head & Shoulder pattern for a reversal with huge upside potential.
Declining selling volume.
Near oversold RSI
High risk (manage risk) as we are at a major support level. If we lose this level, the weight could get really heavy back into the 70's range.. are you catching my drift?

$AMD failing bull flag, 0.5 fib retracementFailing bull flag on AMD, not retesting 0.5fib level and around 50SMA. Potential to get down to $83-84. Looks weak

