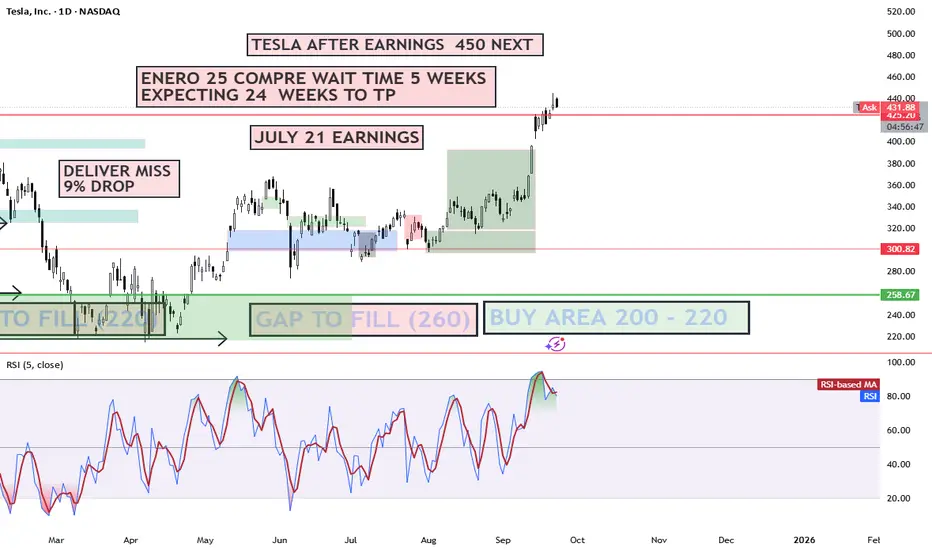
TESLA 500 BY EOY OR 2026 Why Tesla (TSLA) Could Hit $450 Then $500 by EOY 2025 or 2026: Key Catalysts Tesla's hovering around $315 today (as of Sept 23, 2025), down ~20% YTD amid sales dips, but the setup for a rebound to $450 (43% upside) and $500 (59% upside) is primed by execution on autonomy, EVs, and energy. Here's the bull case, blending fundamentals and forecasts:Robotaxi & FSD Rollout Momentum: Tesla's Cybercab unveil in Oct 2025 could catalyze a surge, with unsupervised Full Self-Driving (FSD) v13 hitting highways by year-end. ARK Invest's base case eyes $4,600 by 2026 (driven 60%+ by autonomy), but even conservative models like CoinCodex forecast $453 avg in 2026, with highs to $664 on ride-hailing revenue potentially adding $10T market value.
2 sources
Piper Sandler just hiked their PT, calling TSLA the "top idea" for AV investing.
EV Delivery Rebound & Affordable Models: Post-2025 sales weakness (1.8M deliveries est.), expect 2.3M+ in 2026 with Model 2 launch (~$25K EV) ramping production to 3M+ annually. This counters China/EU headwinds, recaptures 20%+ US market share, and boosts EPS to $0.49 next quarter—fueling a $450 breakout per LongForecast's Q3 2026 path.
2 sources
Morningstar sees a 2026 revival echoing 2016's Model 3 surge.
Energy Storage Boom: Megapack deployments exploding (Q2 2025: 9.4 GWh), with 50%+ YoY growth projected through 2026, diversifying revenue to 15%+ of total. This hedges EV volatility, pushing margins to 20%+ and supporting $500 on 11% revenue growth to $130B.
Optimus Humanoid Robot Sales: External sales kick off late 2025/early 2026, targeting $20K/unit with factory pilots scaling to millions. This could add $1T+ valuation long-term, per ARK, but even modest adoption lifts sentiment to $500 by EOY 2026.
2 sources
AMD
ADOBE 510 BY 2026 LONG TERM Why Adobe (ADBE) Could Hit $510 by 2026: Technical Breakdown Adobe's trading at ~$365 today, but bullish setups scream upside. Here's why $510 (40% gain) is in play:Bullish Triangle Breakout: ADBE's consolidated in a multi-year ascending triangle since 2020. A recent close above $370 resistance (near 50-day MA ~$383) signals breakout, targeting $510 (measured move from base at $330 low).
RSI Rebound: At 42 (neutral, not oversold), RSI is coiling for momentum shift. Weekly RSI >50 could trigger buy signals, aligning with AI-driven catalysts like Firefly integrations.
MACD Crossover Potential: MACD histogram narrowing (-5.26) hints at bullish crossover by Q4 2025. Paired with 200-day MA (~$420) as next support, this flips sentiment to "Strong Buy" per TradingView.
Analyst Backing: Consensus targets $465–$496 short-term, but long-term forecasts (e.g., LongForecast) eye $577 EOY 2026 on 11% revenue growth to $23B+.

$NVDA - $280 PT WEEKLY BULL FLAGStay Positioned with Nvidia's Weekly Bullish Chart. A Bull Flag is setting up with an imminent breakout. Long/Short Ratio is also very bullish at almost 60%. Price Target is $280. Remember Pole length of the flag = extended measured move at the breakout point of the flag.

TSLA path to 550/650 USD Breakout Still Pending🔥 What specifically drives TSLA into 550–650
📦 Deliveries + mix surprise
If unit volumes beat whisper numbers and mix favors higher-trim/FSD attach, you get more gross profit per vehicle without needing price hikes. Watch the cadence of regional incentives and shipping vectors; strong NA/EU mix plus improving China utilization is the sweet spot.
🛠️ Margin stabilization → operating leverage
Gross margin base effect + opex discipline = powerful flow-through. Even a 100–150 bps lift in auto GM, coupled with energy GM expanding as Megapack scales, can push operating margin into low-mid teens. That alone recodes the multiple market is willing to pay.
🔋 Energy storage stepping out of auto’s shadow
Megapack/Powerwall growth with multi-GW backlogs turns “side business” into a credible second engine. As deployments and ASP/contract mix normalize, investors begin modeling $10–$15B annualized energy revenue with attractive GM — this is multiple-expanding because it looks more like infrastructure/software-tinted industrials than cyclical autos.
🤖 Autonomy & software monetization bridges
Two things move the needle fast: (1) clear progress toward supervised autonomy at scale (drives FSD attach + ARPU), and (2) licensing (FSD stack, charging/NACS, drive units). Even modestly credible paid-miles/seat-based models (think $50–$150/month vehicles on fleet) transform valuation frameworks.
🦾 Optimus/robotics as a real option, not sci-fi
The market doesn’t need commercial ubiquity — it needs line-of-sight to pilot deployments and unit economics where labor-substitute ROI < 3 years. A few high-credibility pilots (warehousing, simple assembly, logistics cells) can tack on optionality premium that pushes the multiple toward the top of the range.
💹 Options-market reflexivity
Flows matter. Elevated call demand near ATH turns dealers short gamma, forcing delta hedging that lifts spot, which triggers more call buying → a familiar feedback loop. On breakouts, watch open interest skew to short-dated OTM calls, and put-call ratios compressing; these magnify upside in a tight float day.
🌍 Macro & liquidity
If indices hold highs and the rate path doesn’t tighten financial conditions, growth duration gets rewarded. TSLA’s beta + story premium thrives in that regime.
________________________________________
🧠 Outside-the-box accelerants
🛰️ “Software day” packaging
A coordinated showcase that bundles FSD progress, energy software (fleet, VPP), service/insurance data, and Optimus pilots into a single capital-markets narrative could reframe TSLA as a platform. The Street responds to packaging; it compresses time-to-belief.
🤝 Third-party FSD/charging licensing headlines
A single blue-chip OEM announcing software licensing + NACS deep integration reframes the competitive landscape. The equity market pays a software multiple for recurring seats.
🏗️ Capex signaling for next-gen platform without GM hit
Announcing a modular, high-throughput manufacturing scheme (cell to structure, gigacasting tweaks, logistics compression) with proof that unit economics are accretive from ramp can flip skeptics who anchor to past ramp pain.
⚡ Grid-scale contracts + financing innovation
If Tesla pairs utility-scale storage with project-level financing (think repeatable ABS-like channels for Megapack), you de-risk cash conversion cycles and unlock a new investor constituency (infrastructure/green income). That tightens the multiple.
________________________________________
🏎️ Comparative playbook: RACE (Ferrari) & NVDA (NVIDIA)
👑 RACE — the scarcity & brand ROIC lens
Ferrari’s premium multiple rests on scarcity, orderbook visibility, and brand pricing power. TSLA doesn’t have scarcity, but it can borrow the RACE lens via (a) limited-run, ultra-high-margin trims that anchor halo pricing, (b) waitlist-like energy backlogs that create visibility, and (c) bespoke software packages that mimic “personalization” margin. In bull phases, RACE trades as a luxury compounder rather than an automaker; TSLA can earn a slice of that premium when the energy + software story dominates.
🧮 NVDA — the flywheel & supply-constrained S-curve
NVIDIA’s explosive run blended (1) clear demand > supply, (2) pricing power, (3) ecosystem lock-in. TSLA’s battery and compute stacks can echo that dynamic: limited 4680/cell supply + Megapack queues + proprietary autonomy data moat. The moment the market believes TSLA is supply-gated (not demand-gated) in energy/AI, it will award NVDA-like scarcity premia. Add toolchain stickiness (training data, fleet miles, Dojo/AI infra), and you get ecosystem multiples rather than auto multiples.
📊 What the comps teach for TSLA’s 550–650 zone
• RACE lesson: visibility + pricing power boost the quality of earnings → higher P/E durability.
• NVDA lesson: credible scarcity + platform control turbocharge EV/Sales and compress the market’s time-to-future state.
• Translation for TSLA: blend of luxury-like quality (energy contracts + premium trims) and platform scarcity (cells/AI stack) → multiple rerate into our target band.
________________________________________
🧾 Valuation outlook
🧮 Earnings path
• Units up mid-teens % Y/Y; ASP stable to slightly higher on mix; energy + software up strongly.
• Auto GM +100–150 bps; Energy GM expands on scale; opex +SMC disciplined → op margin 12–15%.
• Share count glide modest. Forward EPS ≈ $9–$11.
• Multiple: 50× (conservative growth premium) → $450–$550; 60× (software/autonomy visibility) → $540–$660.
• Why the market pays up: visible recurring high-margin lines (FSD, energy software, services) + AI/robotics optionality.
📈 EV/Sales path
• Forward revenue $130–$150B (auto + energy + software/services).
• Assign blended EV/Sales 6.5–7.5× when energy/software dominate the debate.
• Less net cash → equity value per share in $550–$650.
• Check: At 7× on $140B = $980B EV; equity ≈ $1.0–$1.1T with cash, divided by diluted shares → mid-$500s to $600s. Momentum premium and flow can extend to upper bound.
________________________________________
🧭 Technical roadmap & market-microstructure
🧱 Breakout mechanics
A decisive weekly close above prior ATH with rising volume and a low-volume retest that holds converts resistance to a springboard. Expect a “open-drive → pause → trend” sequence: day 1 impulse, 2–5 sessions of rangebuilding, then trend resumption.
🧲 Volume shelves & AWVAPs
Anchored VWAPs from the last major swing high and the post-washout low often act like magnets. Post-break, the ATH AVWAP becomes first support, then the $500 handle functions as the psychological pivot. Above there, $550/$590/$630 are classical measured-move/Fib projection waypoints; pullbacks should hold prior shelf highs.
🌀 Options & dealer positioning
On a break, short-dated OTM calls populate 1–2% ladders; dealers short gamma chase price up via delta hedging. Expect intraday ramps near strikes (pin-and-pop behavior) and Friday accelerants if sentiment is euphoric. A steepening skew with heavy call open interest is your tell that supply is thin.
________________________________________
🧨 Risks & invalidation
🚫 Failed retest below the breakout shelf (think: a fast round-trip under the $4-handle) downgrades the setup from “trend” to “blow-off.”
🧯 Margin or delivery disappointments (e.g., price-war resumption, regional softness) break the EPS/EV-Sales bridges.
🌪️ Macro shock (rates spike, liquidity drains) compresses long-duration multiples first; TSLA is high beta.
🔁 Flow reversal — if call-heavy positioning unwinds, gamma flips to a headwind and accelerates downside.
________________________________________
💼 Trading & portfolio expressions for HNWI
🎯 Core + satellite
Hold a core equity position to capture trend, add a satellite of calls for convexity. If chasing, consider call spreads (e.g., 1–3 month $500/$600 or $520/$650) to tame IV.
🛡️ Risk-managed parity
Pair equity with a protective put slightly OTM or finance it with a put spread. Alternatively, collars (write covered calls above $650 to fund downside puts) if you’re guarding a large legacy stake.
⚙️ Momentum follow-through
Use stop-ins above key levels for systematic adds, and stop-outs below retest lows to avoid round-trips. Size reduces into $590–$630 where target confluence lives; recycle risk into pullbacks.
💵 Liquidity & slippage
Scale entries around liquid times (open/closing auctions). For size, work algos to avoid prints into obvious strikes where dealers can lean.
________________________________________
🧾 Monitoring checklist
🔭 Delivery run-rate signals (regional registration proxies, shipping cadence).
🏭 Margin tells (bill of materials trends, promotions cadence, energy deployment updates).
🧠 Autonomy milestones (software releases, safety metrics, attach/ARPU hints).
🔌 Licensing/partnership beats (NACS depth, FSD/AI stack interest).
📊 Options dashboard (short-dated call OI ladders; put-call ratio shifts; gamma positioning).
🌡️ Macro regime (rates, liquidity, risk appetite).
________________________________________
✅ Bottom line
🏁 The 550–650 tape is not a fairy tale — it’s a stacked-catalyst + rerate setup where energy/software/autonomy rise in the narrative mix, margins stabilize, and options-market reflexivity does the rest. Execute the breakout playbook, respect invalidation lines, and use convex expressions to lean into upside while protecting capital.
esla (TSLA) — Breakout Playbook
🎯 Core Thesis
• Insider conviction: Musk’s ~$1B buy.
• Risk-on macro: equities at highs, liquidity supportive.
• Options reflexivity: call-heavy flows can fuel upside.
• ATH breakout (~$480–$490) = gateway to price discovery.
________________________________________
🚀 Upside Drivers to $550–$650
• Deliveries & Mix: Surprise beat + higher trim/FSD attach.
• Margins: GM stabilization + energy scaling → op margin 12–15%.
• Energy: $10–15B rev potential with infra-like multiples.
• Autonomy/Software: FSD attach, ARPU, licensing.
• Optimus/Robotics: Pilot deployments → ROI < 3 yrs adds optionality.
• Licensing Headlines: OEMs adopting NACS/FSD stack.
• Capital Markets Narrative: Packaged “software + energy + robotics” story reframes Tesla as a platform.
________________________________________
🏎️ Comparative Bull Run Lens
• Ferrari (RACE): Scarcity, orderbook, luxury multiples.
• NVIDIA (NVDA): Scarcity + ecosystem flywheel → EV/Sales premium.
• Tesla Parallel: Blend of luxury quality (energy backlogs, halo trims) + AI scarcity (cells, fleet data, Dojo).
________________________________________
📊 Valuation Bridges
• EPS Path: $9–$11 EPS × 50–60× = $450–$660.
• EV/Sales Path: $130–150B revenue × 6.5–7.5× = $550–$650.
________________________________________
📈 Technical Roadmap
• Breakout > $490 → retest holds → next legs:
o $550 / $590 / $630 / stretch $650–$690.
• Watch anchored VWAPs; ATH shelf flips to support.
• Options chase accelerates above round strikes.

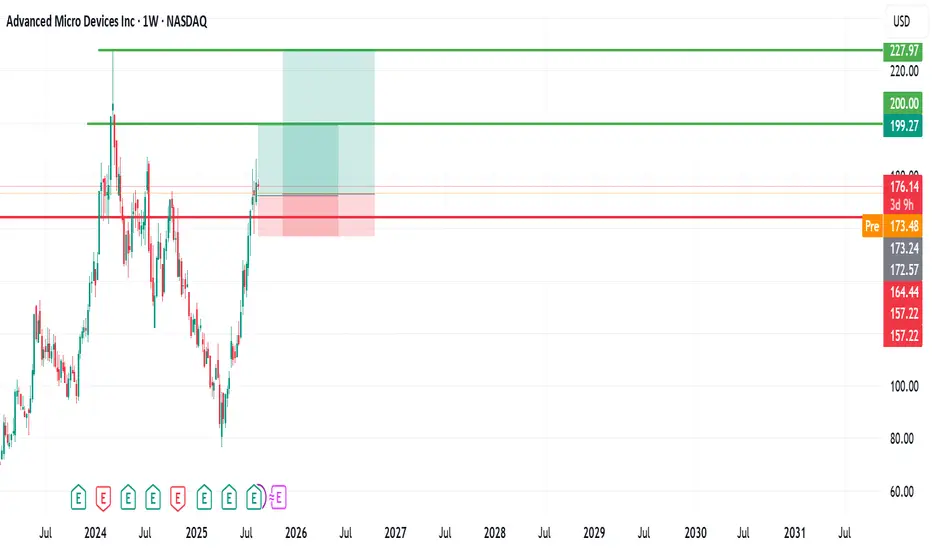
Advanced Micro Devices (AMD) Stock Analysis. My buyAdvanced Micro Devices (AMD) Stock Analysis
AMD, listed on NASDAQ, has generally been on an upward trend. However, the last 2 weeks, the stock experienced a brief flash downturn, dropping to around the $157 level and witnessed a good recovery last week, reaching $186 zone.
Since then, it has pulled back and is currently trading at approximately $176 share.
Outlook:
I remain bullish on AMD with entries from $176 - $172 and anticipate a potential move toward the $200 level, with a longer-term target around its all-time high near $226.
For my entry strategy, I am adding positions at different levels, with an initial entry around $176 and another if it drops further
Position (s) are for a mid- to long-term hold.
Let’s see how it unfolds! If you have any insights or thoughts, please share them in the comments. I’d love to connect with you. Don’t forget to follow, share, and subscribe. Thank you.
PLTR 1D Time frameCurrent Price & Market Metrics
Current Price: $162.36 USD
Previous Close: $156.10 USD
Day Range: Not available
52-Week Range: Not available
Market Cap: Not available
P/E Ratio: Not available
EPS: Not available
🔎 Technical Indicators
Relative Strength Index (RSI): 41.18 — Neutral
Moving Averages:
5-day: $155.47 — Buy
10-day: $156.69 — Sell
20-day: $164.09 — Sell
50-day: $156.92 — Sell
100-day: $140.04 — Buy
200-day: $111.35 — Buy
Moving Average Convergence Divergence (MACD): -1.74 — Sell
Commodity Channel Index (CCI): -47.49 — Neutral
Price Rate of Change (ROC): -10.30 — Sell
Trend Strength Indicator (ADX): 24.55 — Neutral
📈 Support & Resistance Levels
Support: $152.80 – $154.27
Resistance: $164.77
📅 Outlook
Bullish Scenario: A breakout above $164.77 could signal a move toward higher levels.
Bearish Scenario: A drop below $152.80 may lead to further downside.
Overall Bias: Neutral, with mixed signals from momentum indicators and moving averages.

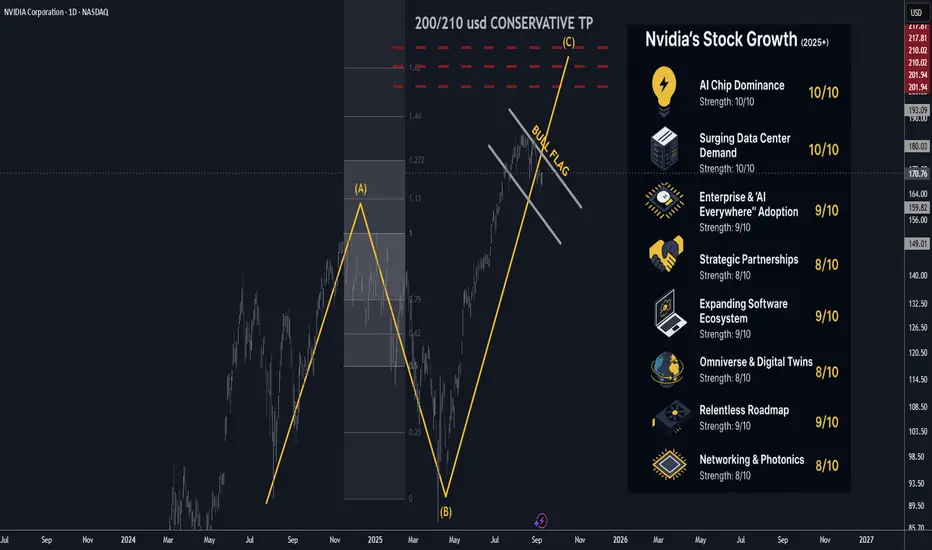
Nvidia (NVDA) 2025+ Catalysts Updated: Analyst Views September🚀 Nvidia (NVDA) 2025+ Catalysts & Risks: Analyst Views — Updated September 2025
________________________________________
📝 Summary Outlook (September 2025)
Nvidia remains at the center of the global AI boom, with dominant GPU share, a strengthening networking/software moat, and multi-year sovereign and enterprise buildouts driving demand. Q2 FY26 confirmed strong momentum, while Q3 guidance points to continued growth. The main risks lie in tariff policy, China licensing, supply chain tightness, and valuation sensitivity. Street consensus remains bullish, with targets in the $207–$211 range and a Strong Buy bias.
🔑 Key Catalysts Driving Nvidia’s Stock Growth (2025+)
1. 🏆 AI Chip Dominance — Score: 10/10
Nvidia still commands ~90%+ of data-center AI accelerators, with CUDA/NVLink lock-in keeping switching costs high.
2. 🏗️ Surging Data Center Demand — Score: 10/10
Hyperscalers remain in an AI “build” cycle. 2025 data-center CapEx is approaching ~$300B, with Nvidia reporting record $41.1B Data Center revenue in its latest quarter.
3. 🌐 Enterprise & “AI Everywhere” Adoption — Score: 8.7/10
Companies across industries are rolling out AI assistants, copilots, and retrieval-augmented applications; Nvidia benefits via GB200 NVL72 racks and RTX-based inference at the edge.
4. 🤝 Strategic/Channel Partnerships — Score: 8.9/10
Cisco is integrating Spectrum-X into networking solutions, while HPE has expanded its Nvidia “AI factory” offerings—broadening reach into enterprise and hybrid AI buildouts.
5. 🚗 Automotive & Robotics — Score: 8.4/10
Auto revenue grew ~70% Y/Y; DRIVE Thor shipments have begun, and Nvidia’s Jetson/AGX Thor and robotics platforms are expanding into industrial automation.
6. 🧑💻 Software & Subscriptions — Score: 8.6/10
Nvidia’s AI Enterprise, DGX Cloud, CUDA-Q, and TensorRT deepen recurring, high-margin revenue and increase developer lock-in.
7. 🌎 Omniverse, Digital Twins & Industrial AI — Score: 8.2/10
Ansys, Siemens, and other industrial software vendors are embedding Omniverse into simulation suites, accelerating adoption of “digital twins” and simulation AI workflows.
8. 🛜 Networking & Photonics — Score: 8.8/10
Spectrum-X Photonics enables co-packaged optics for exascale “AI factories,” improving bandwidth and efficiency while giving Nvidia more end-to-end control.
9. 🧪 Relentless Roadmap (Blackwell → Rubin) — Score: 9.0/10
Blackwell Ultra is ramping into 2025, with the Rubin architecture slated for 2026—sustaining Nvidia’s upgrade cycles.
10. 🌍 Sovereign & Global AI Buildouts — Score: 8.5/10
Europe, the Middle East, and India are launching sovereign AI projects. Saudi-backed Humain alone has committed to tens of thousands of Blackwell chips for 2026 buildouts.
________________________________________
📈 Latest Analyst Recommendations (September 2025)
• Street Stance: Strong Buy/Overweight remains dominant. ~85% of analysts rate NVDA a Buy; avg 12-mo PT ~$207–$211.
• Recent Calls: Multiple firms reiterated Overweight/Buy, with price targets up to $230.
• Common Bull Case: Nvidia’s accelerator lead, software moat, sovereign/enterprise AI pipeline, and expanding networking portfolio.
• Common Cautions: Premium valuation, competition from custom silicon, and export/tariff risk.
________________________________________
🗞️ Latest Events & News (Aug–Sep 2025)
• Q2 FY26 results (reported Aug 27, 2025): Revenue $46.7B (+56% Y/Y); Data Center $41.1B; Blackwell shipments +17% Q/Q; buyback program boosted by $60B.
• Q3 FY26 guidance: ~$54B (±2%) revenue.
• Networking push: Spectrum-X Photonics unveiled; Cisco partnership expanding enterprise deployments.
• Omniverse OEM deal: Ansys to embed Omniverse tech within its simulation platforms.
• Sovereign AI momentum: Saudi Humain centers to deploy 18k+ Blackwell chips starting 2026; UAE and India also ramping large-scale AI initiatives.
• Ecosystem investing: Nvidia continues selective investments in AI startups, strengthening CUDA adoption.
________________________________________
🇺🇸🇨🇳 US–China Tariffs & Export Controls — September 2025 Update
• Tariff truce extended (Aug 2025): Current tariffs remain at ~30% U.S. on Chinese imports and ~10% reciprocal from China. Next decision point: Nov 10, 2025.
• Supreme Court review: The Court will hear a case challenging U.S. executive authority on tariffs this fall.
• China export licensing: U.S. has begun granting licenses for Nvidia’s H20 China-compliant GPUs. Advanced Blackwell exports remain restricted without further approvals.
Impact on Nvidia: Truce reduces near-term disruption, but future tariff or licensing changes remain key risks. China sales are limited to compliant GPUs with lower margins.
________________________________________
⚠️ Key Negative Drivers & Risks (Updated)
1. 🇨🇳 US–China Tech Policy
Tariff truce is temporary; licensing decisions and court rulings keep China exposure uncertain.
2. 🏛️ Regulatory/Legislative Overhang
Proposals like the GAIN AI Act could impose stricter controls on exports and prioritize domestic deployments.
3. 🏭 Supply Chain Bottlenecks
Advanced packaging and HBM memory remain tight despite expansions—potential bottlenecks for shipments.
4. 🧮 Competitive Threats & Custom Silicon
AMD, Intel, and hyperscaler-designed accelerators continue to advance, potentially eroding Nvidia’s hyperscale share.
5. 🏷️ Valuation & Expectations
Nvidia trades at high multiples; any slowdown or guidance miss could trigger volatility.
6. 💵 Customer Concentration
Top cloud giants still account for a large share of revenue; CapEx pauses or custom chip adoption would materially impact results.
________________________________________
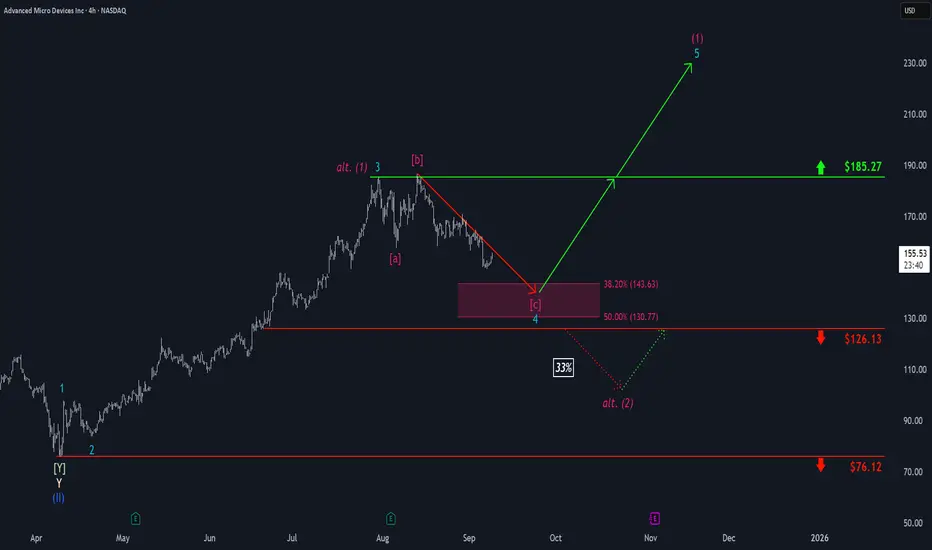
AMD: Drawing Closer...Step by step, AMD has been drawing closer to our magenta Target Zone between $143.63 and $130.77, which remains a favorable range for long entries. Prices should establish the low of turquoise wave 4 within this zone before reversing higher to resume the ongoing upward impulse—initially breaking above resistance at $185.27 and targeting the peak of magenta wave (1). However, we see a 33% chance that magenta wave alt. (1) has already completed, with a quicker low for wave alt. (2) likely to form below support at $126.13. Due to this alternative scenario, potential long trades within the magenta zone could be protected with a stop either 1% below the lower boundary of the zone or at the $126.13 level.
AMD $160C – Tactical Bounce Trade You Don’t Want to Miss
# ⚡ AMD Weekly Mean-Reversion Setup (Sept 7, 2025)
### 🔍 Market Snapshot
* **Price:** \~\$151.14
* **Technicals:** Daily RSI 28.4 → Deeply oversold 📉 | Weekly RSI 54.1, falling
* **Options Flow:** Strongly bullish (C/P = 2.13) ⚡
* **Volatility:** Low (VIX \~15), gamma low → cheap premium
* **Timeframe:** 5-day weekly expiry
---
### 🎯 Trade Idea: Tactical Bounce Play
* **Instrument:** AMD
* **Direction:** CALL (Mean-reversion)
* **Strike:** \$160
* **Expiry:** 2025-09-12
* **Entry:** \$0.77 (mid/ask)
* **Profit Target:** \$1.54 (+100%)
* **Stop Loss:** \$0.31 (-40%)
* **Size:** 1 contract (small % account, scale per risk rules)
* **Confidence:** 65%
---
### ⚠️ Key Risks
* Prior week -10% drop & heavy distribution → counter-trend risk
* Full payoff requires \~\$9 move in 5 days → moderate probability
* Concentrated \$150 puts can act as support or accelerate downside
* Weekly theta decay → exit by Thursday, avoid Friday gamma ⚡
* News/macro shock risk → use small sizing
---
### 🔑 Trade Rationale
1. Daily RSI extreme → plausible 3–5 day bounce
2. High call flow @ \$160 → short gamma/short-term buying interest
3. Low VIX → cheap premium relative to potential move
---
### ⚙️ Execution Notes
* Enter at open, limit \$0.77
* Stop at \$0.31, take partial profit at +50% (\$1.16), full at +100% (\$1.54)
* Cut if price drops below \$148–\$149 on heavy volume
---
📊 **Summary:** Tactical, defined-risk mean-reversion play. Not a trend reversal — small allocation, event-driven weekly call.
\#AMD #OptionsTrading #WeeklySetups #TradingView #MeanReversion

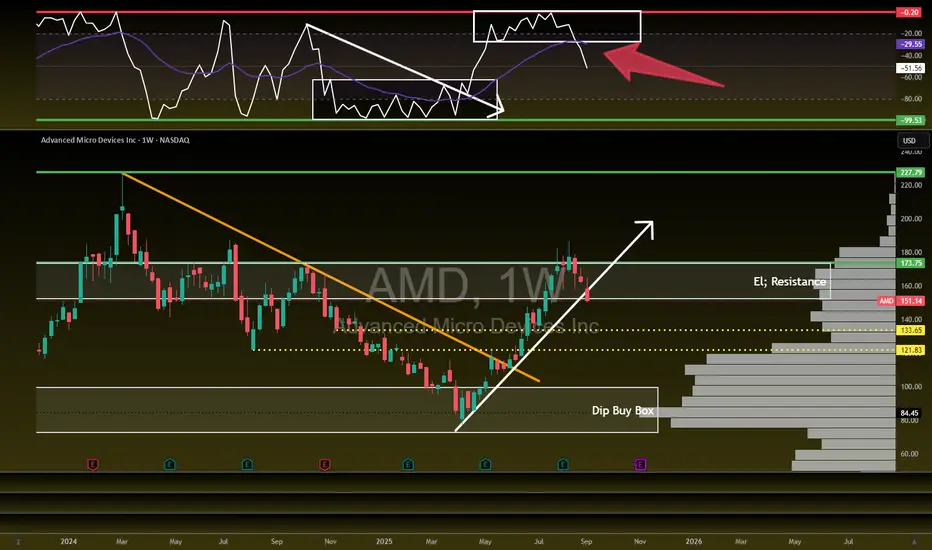
AMD - Free Fall TimeNASDAQ:AMD - Free Fall Time
Hit El' Resistance and collapsed. Uptrend broken.
WCB broken down and looking at $134 or $122 for a bottom from here.
Can't wait to get back into this trade once we flip again.
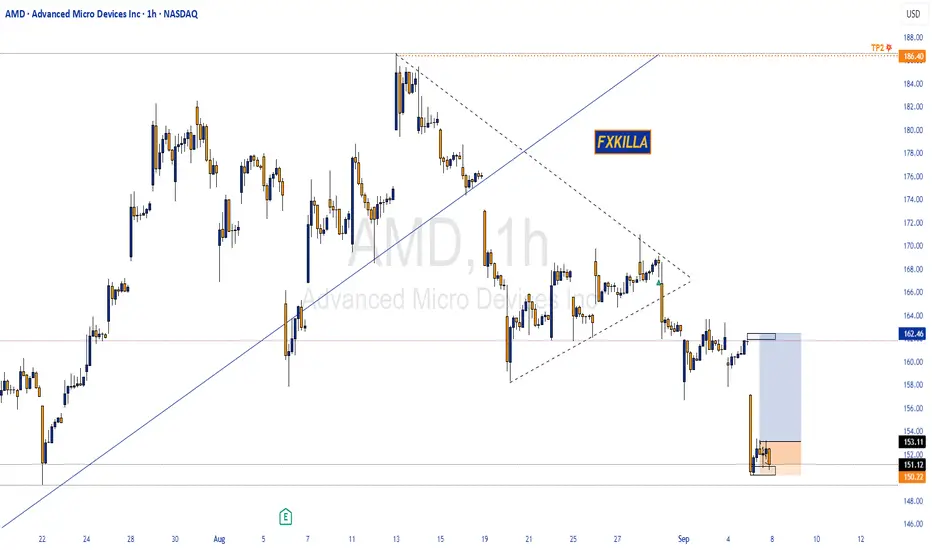
AMD HIGH PROBABILTY SETUP SOON !!!🚨 AMD HIGH PROBABILITY BUY SETUP 🚨
* Here We Can See Clearly The Next Potential Move For AMD Coming Hours/Days.
* Keep Your Eyes Close On Your Trading Positions.
* Happy PIP Hunting Traders.
FXKILLA
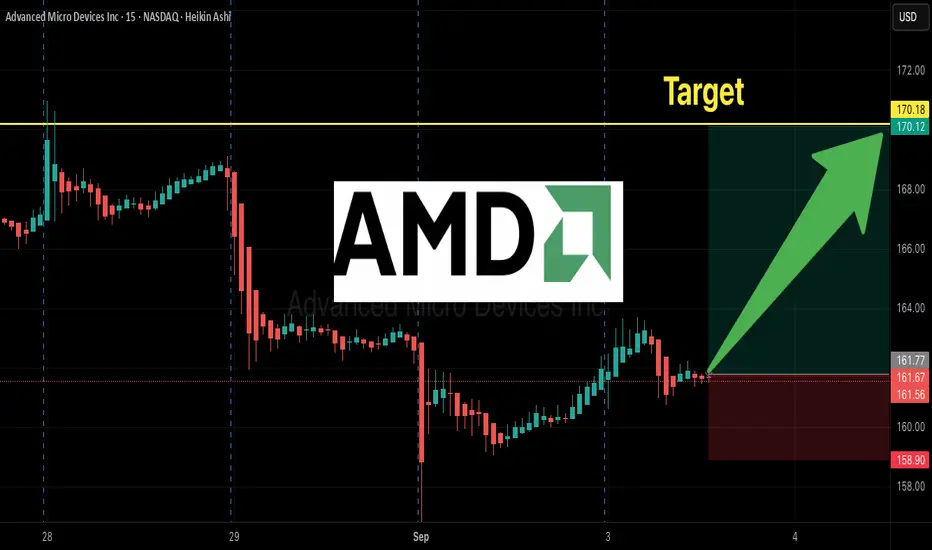
AMD Weekly Call Play – $170 Strike Ready to Explode?
## 🔥🚀 AMD Weekly Options Setup (Sep 3, 2025) 🚀🔥
💎 **High-Risk, High-Reward Call Play!** 💎
### 📊 Market Consensus
* 📈 **Bias:** Moderately Bullish (short-term upside skew).
* 🏦 **Flow:** Institutional heavy call buying (C/P = **2.19**) at \$170 strike.
* 📊 **RSI:** Weekly strong (70.8), Daily weak (43.2) → divergence ⚠️.
* ⏰ **Risk:** Only 2 DTE → Gamma & Theta decay **very high**.
---
### 🎯 Trade Setup
* 🏦 **Instrument:** AMD Weekly Call (Exp 09/05)
* 🚀 **Strike:** \$170
* 💵 **Entry:** \$0.59
* 🛑 **Stop Loss:** \$0.30 (≈50%)
* 🎯 **Target:** \$1.18 (+100%)
* 📅 **Exit Rule:** Close **by Thursday EOD** (don’t hold into Friday gamma).
* 📏 **Size:** 1 contract (keep it small)
* 📈 **Confidence:** 65%
---
### ⚠️ Key Risks
* ⏳ Time decay → Premium can evaporate fast.
* 📉 Weak daily momentum → Possible pullback.
* 🕒 Slippage & spreads → Use **limit orders**.
---
## 📌 Tags (TradingView + SEO Boost)
\#AMD #OptionsTrading #WeeklyOptions #CallOptions #SwingTrade #Breakout #TechStocks #RiskReward #StockMarket #TradingSetup #GammaRisk #ThetaDecay #MomentumTrading
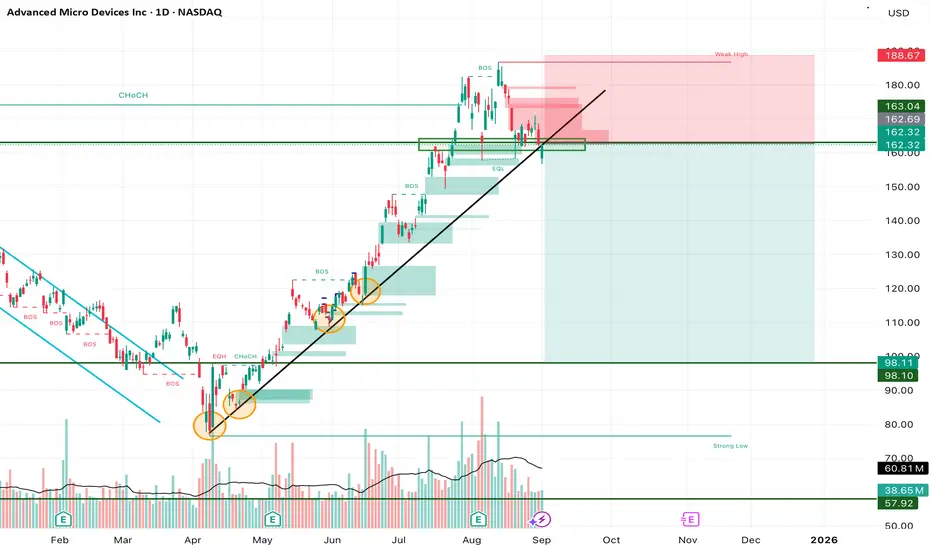
AMD Trendline Break – Short-Term Weakness, Long-Term AI Power PlAMD has broken below its long-standing ascending trendline, which has been respected multiple times since April. This is the first real sign of weakness after months of steady upside. The $162–165 zone, once strong support, is now acting as resistance. Unless bulls can reclaim this area quickly, AMD risks sliding lower toward $150 or even deeper levels.
Technical View:
• Trendline: Broken on daily chart → bearish short-term shift.
• Resistance: $162–165 (former support), $186–187 (weak high).
• Support Levels: $150 psychological, then $135–140 range.
• Indicators: RSI softening, MACD negative, short-term MAs leaning bearish.
Fundamental Backdrop:
Despite this technical weakness, AMD’s long-term story remains strong. HSBC recently upgraded AMD with a $200 price target, citing its MI350 AI chips that rival Nvidia’s Blackwell GPUs. The MI400, due in 2026, could expand GPU sales to $20B by 2028. Melius Research also raised its target to $175, highlighting AMD’s AI trajectory. Fundamentally, AMD is building momentum as a serious competitor in the AI chip race.
Trade Setup (Swing Idea):
• Entry Zone: $162–165 rejection area.
• Stop Loss: Above $188 (weak high).
• Take Profit 1: $150 (psychological level).
• Take Profit 2: $135–140 demand zone.
• Long-Term Accumulation: Any dip below $150 could be a strategic buy for investors with a $175–200 upside target in the AI cycle.
My View:
Short-term, the break of trendline favors bears — I’m watching for a retest of $162–165 to confirm resistance. Medium-term, I see pullback opportunities. Long-term, AMD’s AI roadmap gives conviction that dips should be accumulated rather than feared.
(Not Financial Advice) NASDAQ:AMD
AMD (2025+) Catalysts & Risks: 300 USD PT Bulls🟥 AMD (2025+) Catalysts & Risks: Analyst Views
________________________________________
🔑 Key Catalysts Driving AMD’s Stock Growth (2025+)
🌌 Quantum-Centric Supercomputing with IBM
AMD’s collaboration with IBM to merge CPUs/GPUs with quantum computing promises a whole new class of hybrid architectures. If successful, this could unlock brand-new compute markets in research, defense, and enterprise.
Impact Score: 9.5/10
🏗️ Hyperscaler Traction & Data-Center GPU Gains
AMD’s MI355 and upcoming MI400 accelerators are gaining traction with big cloud players. Even a modest 10% market share in AI GPUs would be transformative for AMD’s revenue mix.
Impact Score: 9/10
📈 Analyst Upgrades & Bullish Price Targets
Wall Street has turned bullish—multiple PT hikes point to 20–40% upside. Analyst enthusiasm often accelerates institutional inflows, reinforcing AMD’s momentum.
Impact Score: 7.5/10
🌍 Global AI Accelerator Growth & Middle East Expansion
AMD is securing multi-billion sovereign AI infrastructure deals in the Gulf (Saudi, UAE). These large-scale contracts validate AMD’s credibility as a true Nvidia alternative.
Impact Score: 8.5/10
💰 Strong Financial Performance & Executive Optimism
Q1 results crushed expectations with revenue and profit growth across data center and AI. Sustained beats strengthen AMD’s credibility and support multiple expansion.
Impact Score: 8/10
🔗 Broad Ecosystem & Strategic Acquisitions
Acquisitions like Xilinx and Silo AI give AMD a richer portfolio spanning FPGAs, AI software, and custom servers (Helios). This positions AMD as more than just a chipmaker—an AI infrastructure player.
Impact Score: 7/10
________________________________________
⚠️ Key Negative Drivers & Risks
🇨🇳 China Export Restrictions
AMD is losing access to a massive end market due to US export rules. This already shaved off ~$1B in projected sales and could worsen with future policy shifts.
Risk Severity: 9/10
📉 Under-whelming AI GPU Sell-In
Past misses on data-center GPU sales remind investors that adoption is not guaranteed. If hyperscalers hesitate, AMD’s AI growth story could stall.
Risk Severity: 7.5/10
💸 Valuation & Excess Rally Risks
Shares are up massively YTD—if results don’t keep pace, profit-taking could spark sharp pullbacks.
Risk Severity: 7/10
⚡ Short-Term Volatility & Earnings Reaction
Even with growth, near-term misses or cautious guidance could swing the stock hard.
Risk Severity: 6.5/10
🥊 Competitive Pressure
Nvidia’s CUDA ecosystem remains deeply entrenched, while custom silicon from hyperscalers (Google TPUs, AWS Trainium) eats into the TAM. AMD is fighting uphill.
Risk Severity: 8/10
________________________________________
📝 Summary Outlook (Sept 2025)
AMD is no longer the underdog—it’s becoming a legitimate AI infrastructure contender. The IBM quantum partnership and hyperscaler adoption of MI400 GPUs could be game-changers. Sovereign AI deals in the Middle East and ecosystem-expanding acquisitions amplify the story.
But execution risk is high—China export bans, entrenched Nvidia dominance, and valuation stretch leave little room for error. Success hinges on AMD proving it can scale its AI GPUs and secure recurring demand.
Rank Catalyst 🚀 Score (0–10)
1⃣ 🌌 Quantum-Centric Supercomputing with IBM 9.5
2⃣ 🏗️ Hyperscaler GPU Adoption (MI355/MI400) 9
3⃣ 🌍 Middle East AI Mega Deals 8.5
4⃣ 💰 Strong Financial Growth 8
5⃣ 📈 Analyst Upgrades & PT Revisions 7.5
6⃣ 🔗 Ecosystem & Acquisitions (Xilinx, Silo AI, Helios) 7

AMD Pullback Opportunity After 70%+ Rally – Watching $111–$120 📈 AMD Update – Strategic Re-Entry Plan
From our original buys at $108, AMD has delivered an impressive 70%+ rally. This strong momentum reflects continued bullish sentiment and growth potential in the semiconductor sector.
We’re now looking to add on a pullback into a confluence support zone between $111 and $120. This level aligns with the:
61.8% Fibonacci retracement
99-day TRAMA
Horizontal support at $120
📍 Entry Zone: $111–$120
🎯 Take Profit Targets: $160 / $220 / $300
❌ Stop Loss: Weekly close below $100
#AMD #NASDAQ #SwingTrade #Fibonacci #TechnicalAnalysis #StockMarket #TradingIdeas

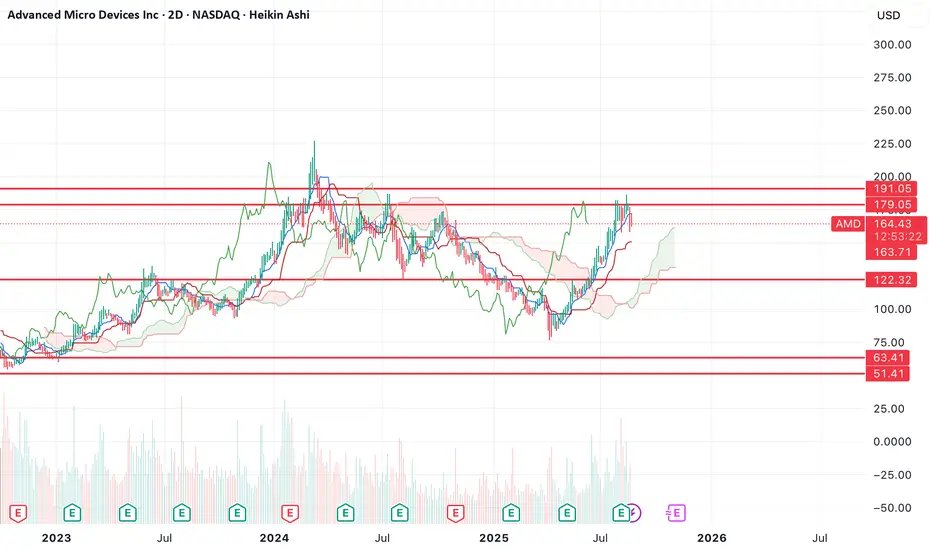
$AMD another HTF lower high? Back to retest lows?While many people are bullish AMD here, I don't think the chart looks that great. The recent rejection here sets up a double top and the possibility for us to go down and retest the lows again.
You can see using Heikin Ashi candles that bearish momentum has already started on the 2D timeframe. You'd need a very strong move higher from here to negate both the double top and the bearish momentum.
The only possibility for the bulls is to break above $191. However, bullish move that goes belows that level will most likely get sold lower.
If price does continue down from here, then I think the most likely outcome is that we test the bottom two supports on the chart before the bullish move starts.
Looking at the chart, it looks to me like the real bull run starts early 2026.
AMD Options Alert: $190 Call Ready to Pop!
# 🚀 AMD Weekly Options Analysis (Aug 19, 2025) 🚀
### **Market Snapshot**
📊 **Daily RSI:** 56.3 ⬇️ (Neutral)
📈 **Weekly RSI:** 85.1 ⬇️ (Potential Reversal ⚠️)
📉 **Volume:** Weak institutional activity (0.6x last week)
🔥 **Options Flow:** Call/Put ratio 1.21 → Moderate Bullish
✅ **Volatility:** Favorable (VIX < 15)
💡 **Overall Bias:** Moderate Weekly Bullish
---
### **Model Breakdown**
| Report | Trend | Volume | Options Flow | Bias |
| -------------------- | ------------------ | ------- | ------------ | ------------------- |
| **Grok/xAI** | NEUTRAL | WEAK 📉 | BULLISH 🔥 | Moderate Bullish 👍 |
| **Gemini/Google** | NEUTRAL/Bearish ⚠️ | WEAK 📉 | BULLISH 🔥 | Neutral/Bearish 🤔 |
| **Claude/Anthropic** | NEUTRAL/Bearish ⚠️ | WEAK 📉 | BULLISH 🔥 | Moderate Bearish 👎 |
| **Llama/Meta** | NEUTRAL ⚠️ | WEAK 📉 | BULLISH 🔥 | Moderate Bullish 👍 |
| **DeepSeek** | NEUTRAL ⚠️ | WEAK 📉 | BULLISH 🔥 | NEUTRAL 🤷 |
✅ **Consensus:**
* Weak volume = concern 🚨
* Low VIX = favorable for options 💎
* RSI signals mixed; overbought caution ⚠️
---
### **💥 Trade Recommendation 💥**
**Strategy:** Cautious Naked Call
* 🎯 **Instrument:** AMD
* 💰 **Strike:** \$190
* 🗓️ **Expiry:** Aug 22, 2025
* 💵 **Entry Price:** \$0.70
* 🎯 **Profit Target:** \$1.05 (50%)
* 🛑 **Stop Loss:** \$0.35
* ⏰ **Entry Timing:** Market Open
* 📈 **Confidence:** 65%
⚠️ **Key Risks:**
* ⏳ Accelerated time decay (3-day expiry)
* 📉 Weak volume may trigger profit-taking
---
### **Trade JSON**
```json
{
"instrument": "AMD",
"direction": "call",
"strike": 190.00,
"expiry": "2025-08-22",
"confidence": 0.65,
"profit_target": 1.05,
"stop_loss": 0.35,
"size": 1,
"entry_price": 0.70,
"entry_timing": "open",
"signal_publish_time": "2025-08-19 09:51:08 UTC-04:00"
}
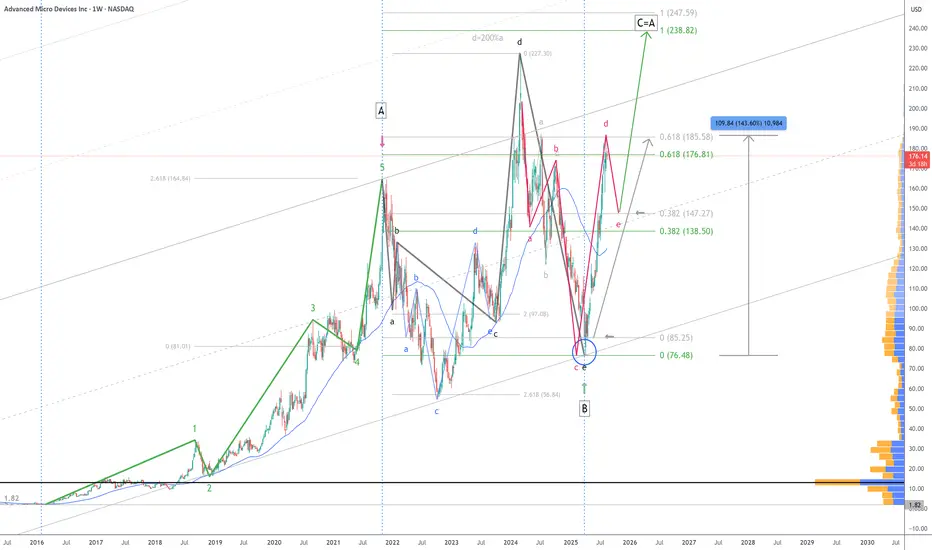
$AMD Analysis: Perfect Hit & One of Many Scenarios! 8/18/2025NASDAQ:AMD hits the 61.8% target of major wave A - up nearly 144% gain in 3 months! 👌
📈 A pause near $148 could complete the red NT (abcde) structure before a potential continuation toward C=A target at $236 or $247
One of many paths... let’s see how it unfolds!
Cheers!
#ElliottWave #AMD #TechnicalAnalysis
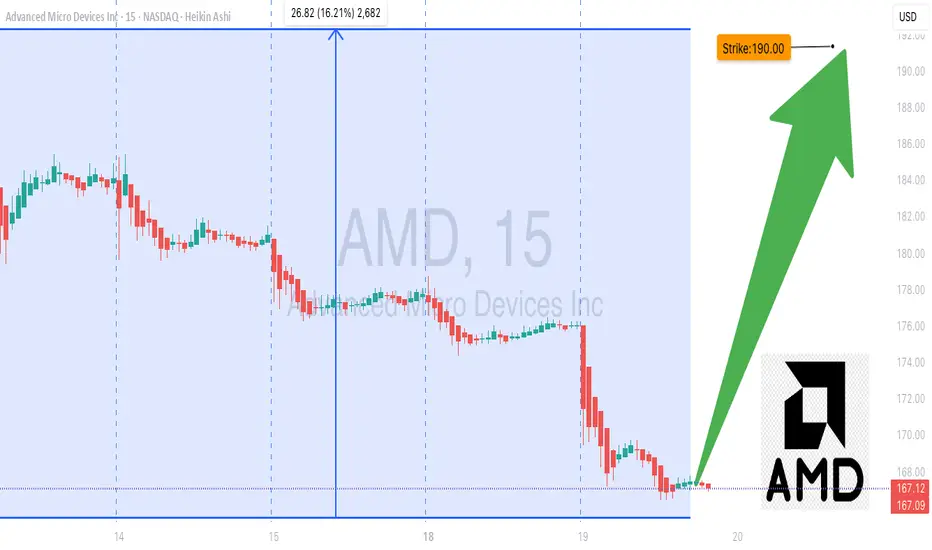
AMD Ready to Break Higher – $190 Calls Flashing Opportunity!
# 🚀 AMD Weekly Options Analysis (2025-08-17) – Don’t Miss Out!
### 🔎 Market Overview
AMD’s weekly options landscape shows **strong bullish sentiment**: high call volume and supportive sentiment suggest traders expect upward movement, though some caution arises from declining short-term indicators.
---
### 📊 Key Model Insights
* **Call/Put Ratio:** 2.03 → strong bullish flow
* **Weekly RSI:** 87.8 → extremely bullish momentum
* **Daily RSI:** 59.1 → short-term downward trend, caution advised
* **Volume:** 0.8x last week → declining institutional participation
* **Gamma Risk:** Low → favorable for entering near-term options
---
### 📌 Agreement & Disagreement
* **Agreement:** All models confirm **moderate-to-strong bullish sentiment** due to options flow and low VIX environment.
* **Disagreement:** Some models flag **weak volume**, raising caution, while others remain confident in ongoing bullish trends.
---
### 📊 Recommended Trade
* **Direction:** CALL (Long)
* **Strike:** \$190.00
* **Expiry:** 2025-08-22
* **Entry Price:** \$0.70 (midpoint)
* **Stop Loss:** \$0.35 (50% of premium)
* **Profit Target:** \$1.40 (100% gain)
* **Entry Timing:** Market Open
* **Confidence:** 65%
---
### ⚠️ Key Risks
* Weak volume → reduced institutional conviction
* Declining daily RSI → potential short-term reversals
* Monitor news/events → can affect volatility or price
---
📊 **TRADE DETAILS JSON**
```json
{
"instrument": "AMD",
"direction": "call",
"strike": 190.00,
"expiry": "2025-08-22",
"confidence": 0.65,
"profit_target": 1.40,
"stop_loss": 0.35,
"size": 1,
"entry_price": 0.70,
"entry_timing": "open",
"signal_publish_time": "2025-08-17 09:30:00 EDT"
}
``

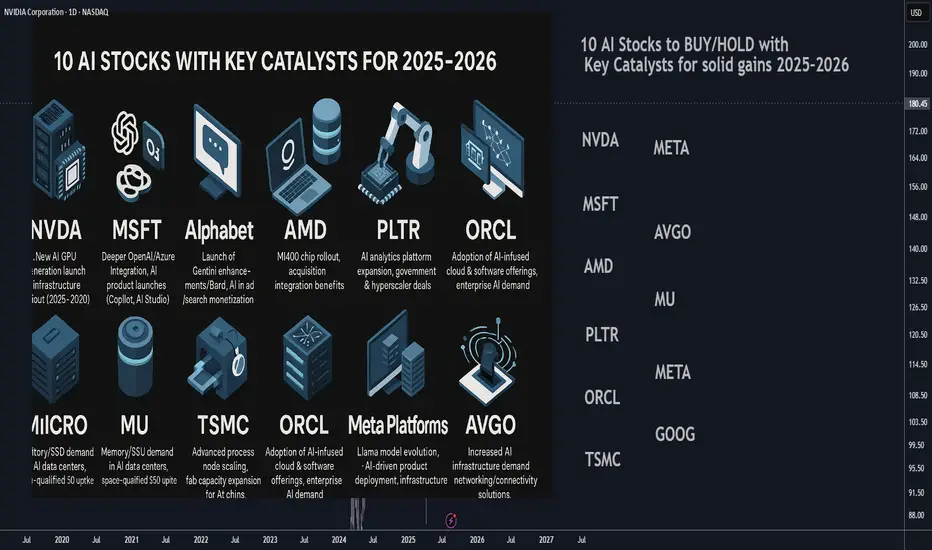
10 AI Stocks to BUY/HOLD with Key Catalysts for solid gains 202510 AI Stocks to BUY/HOLD with Key Catalysts for solid gains 2025–2026
________________________________________
1. NVIDIA (NASDAQ: NVDA)
• Catalyst: Expansion of AI infrastructure via new GPU generations (e.g., Blackwell), continued dominance in AI training/deployment. Regulatory/availability clarity in key markets like China could also drive demand.
• Highlights: Leader in AI GPUs; high analyst upgrades and raised targets; strong global demand from data centers and hyperscale AI deployments.
________________________________________
2. Microsoft (NASDAQ: MSFT)
• Catalyst: Deepening integration of AI across products and services (e.g., Office, Teams), OpenAI partnership further embedded in Azure services, AI product launches (Copilot, AI Studio).
• Highlights: Extensive cloud & enterprise reach; strong balance sheet; strategic positioning as AI infrastructure and application leader.
________________________________________
3. Alphabet (NASDAQ: GOOGL)
• Catalyst: Rollout of key AI products (e.g., Gemini, Bard enhancements), continued monetization of AI in search & advertising, rising AI-related cloud license revenue.
• Highlights: Core AI research leader; growing earnings momentum; sustained institutional inflows and investor confidence tied to AI growth.
________________________________________
4. AMD (NASDAQ: AMD)
• Catalyst: Launch of AI-optimized server chips (e.g., MI400 series), integration of AI functionality in CPUs/GPUs, synergy from Xilinx and Silo AI acquisitions.
• Highlights: Aggressive roadmap in AI compute; acquisitions bringing AI IP and talent; gaining share in AI server ecosystem.
________________________________________
5. Palantir (NYSE: PLTR)
• Catalyst: Expansion of AI-driven government and commercial contracts, rollout of AI-enabled analytics platforms such as Palantir AI suite, new hyperscaler partnerships.
• Highlights: AI-analytics leader with strong public-sector footprint; pivoting toward cloud-based AI; high-margin recurring revenue potential.
________________________________________
6. Micron Technology (NASDAQ: MU)
• Catalyst: Accelerated demand for AI-optimized memory and storage (e.g., HBM, SSDs); uptake of Micron's AI/space-qualified SSDs; expansions into AI data center deployments.
• Highlights: Strong sequential performance in earnings; double-digit growth in AI segments; positioned as non-GPU hardware beneficiary of AI boom.
________________________________________
7. TSMC (NYSE: TSM)
• Catalyst: Scaling advanced process nodes (e.g., N3E, N2) to support AI chips, capacity expansion initiatives, securing AI chip orders from Nvidia, AMD, and other fabless players.
• Highlights: Global leader in semiconductor foundry; high-barrier-to-entry business model; direct beneficiary of AI silicon ramp-up.
________________________________________
8. Oracle (NYSE: ORCL)
• Catalyst: Launch and adoption of Oracle Cloud AI capabilities (OCI AI, embedded ML), AI-driven Oracle Fusion applications, increasing AI-related capex by enterprise customers.
• Highlights: Strong enterprise penetration; AI-infused software suite; renewed investor interest from hedge funds targeting AI exposure.
________________________________________
9. Meta Platforms (NASDAQ: META)
• Catalyst: Continued investment in large-scale AI infrastructure (data centers), Llama 3 and generative AI models, new AI products in social, AR/VR, and enterprise.
• Highlights: Massive AI compute investments; pioneering open models like Llama; turning AI into a core product strategy beyond social media.
________________________________________
10. Broadcom (NASDAQ: AVGO)
• Catalyst: AI-related semiconductor solutions (e.g., networking, connectivity, acceleration) embedded in data center infrastructure, demand from AI workload networking.
• Highlights: Integral player in AI infrastructure as part of the “Fab 4”; diversified exposure across chips critical for AI workloads.
________________________________________
How to Monitor These Catalysts
• Product Launches & Roadmap Updates (e.g., NVDA GPU release events, AMD MI400 launch, META model updates)
• Earnings Calls / Financial Guidance revealing AI revenue — especially with MSFT, GOOGL, ORCL, MU, and AVGO
• Partnership or Contract Announcements — e.g., Palantir industry deals, Oracle enterprise AI deployments
• Capacity & Scaling News — e.g., TSMC fab expansion, Micron memory contracts, Meta data center buildouts
SHORT SET UP PO3 USDJPYAny thoughts on this set up USDJPPY swing short Po3.
to suplement this is my take for Dollar index

Amd - New all time highs will follow!🪠Amd ( NASDAQ:AMD ) rallies even much further:
🔎Analysis summary:
After Amd perfectly retested a major confluence of support a couple of months ago, we saw a textbook reversal. This retest was followed by a rally of more than +100% in a short period of time. But considering all the bullish momentum, Amd is far from creating a top formation.
📝Levels to watch:
$200
SwingTraderPhil
SwingTrading.Simplified. | Investing.Simplified. | #LONGTERMVISION

$NVDA - $280-300 YEAR END TARGET Trend is your friend, just keep it simple. Lots of runway ahead accompanied with improved gross margins of mid 70% during back half of the year on already high margins. Technical trend channel has a price objective between $280 to almost $300.
